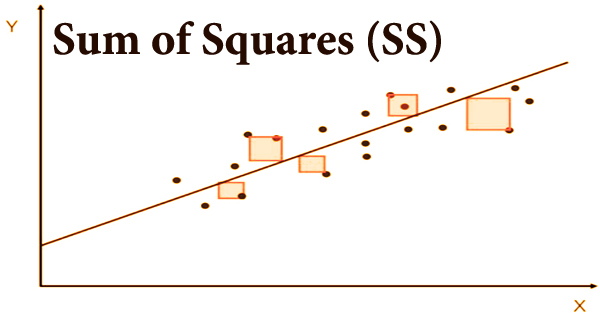
The sum of squares (SS) is a statistic that measures how far individual measurements deviate from the mean. It is a statistical technique that is used in regression analysis to determine the dispersion of data as well as how well the data fits the model. The objective of regression analysis is to see how well a data series can be fitted to a function that can explain how the data series was created. Subtract each measurement from the mean, square the difference, and then add (sum) all the resultant measurements to get the sum of squares.
The sum of squares gets its name from the fact that it is calculated by adding the squared differences. It is a mathematical method for determining the function that best fits (varies the least) the data. One of the most essential outcomes in regression analysis is the sum of squares. As a general rule, a smaller sum of squares suggests a better model since the data is less variable.
Because it quantifies the degree of variability in the data, the sum of squares is also known as a variance. Because linear regression models are frequently employed in both theoretical and practical finance, knowing the sum of squares is crucial in finance. The sum of squares can be calculated using a variety of equations and procedures. It is equivalent to the sum of squares of variance between individual values and the mean in statistics, i.e.,
Σ(xi + x̄)2
Where,
xi represents individual values and x̄ is the mean.
A high sum of squares indicates that the data has a lot of variability, whereas a low sum of squares (most of the observations are near to the mean) indicates that the data has a lot of variability. The most often used measure of central tendency is the mean SS, which is the average of a group of values. Simply add up the values in the data set and divide by the number of values to get the arithmetic mean.
To get the sum of squares for a piece of data, add all the measures together and divide by the total number of measurements in the data set. The total sum of squares, regression sum of squares, and residual sum of squares are the three major forms of sum of squares used in regression analysis.
- Total sum of squares: A deviation of the values of a dependent variable from the sample mean of the dependent variable is called the total sum of squares. The total sum of squares, in essence, estimates the entire variance in a sample.
- Regression sum of squares: The regression sum of squares is a measure of how effectively a regression model fits the data being modeled. A larger regression sum of squares means the model isn’t fitting the data effectively.
- Residual sum of squares: The residual sum of squares is a method of calculating the variance in modeling mistakes. In other words, it shows how the model cannot explain the variance in the dependant variable in a regression model. A smaller residual sum of squares suggests that the regression model can better describe the data, whereas a greater residual sum of squares shows that the model can not adequately explain the data.
The sum of squares (SS) is used to determine if two variables have a linear connection, and the residual sum of squares refers to any unexplained variability. The distance between each data point and the line of best fit is squared and then totaled to produce the sum of squares. This value will be minimized by using the line of greatest fit. Many more considerations than those listed above go into making an investing choice on which stock to buy.
To determine with greater confidence how high or low an asset’s variability is, an analyst may need to work with years of data. As the number of data points in the collection grows, the sum of squares grows as the values become increasingly spread apart. To compute any of the two metrics, you must first calculate the sum of squares. The average of the total of squares is the variance (i.e., the sum of squares divided by the number of observations). The square root of the variance is the standard deviation.
Information Sources: