Introduction
Schizophrenia is a psychiatric disorder, affecting behaviour, thinking, and emotion. The term schizophrenia comes from the Greek words schizo means split or divide and phrenos means mind (Goldner et al., 2002). This rarely treated psychiatric disorder strikes primarily teenagers and young adults, leading to severe psychological disability during the potentially creative and productive life.
1.2 DSM-IV Criteria for Schizophrenia Disorder
According to DSM-IV the following criteria can be observed for Schizophrenia disorder
A) Characteristic Symptoms: Two (or more) of the following symptoms, present for a significant portion of time (1-month period).
• delusions
• hallucinations
• disorganized speech (e.g., frequent derailment or incoherence)
• grossly disorganized or catatonic behavior
• negative symptoms, i.e., affective flattening, alogia, or avolition
B) Social/occupational dysfunction: For a significant portion of the time since the onset of the disturbance, one or more major areas of functioning such as work, interpersonal relations, or self-care are markedly below the level achieved prior to the onset (or when the onset is in childhood or adolescence, failure to achieve expected level of interpersonal, academic or occupational achievement).
C) Duration: Continuous signs of the disturbance persist for at least 6 months. This 6-month period must include at least 1 month of symptoms (or less if successfully treated) that meet criterion A (i.e., active-phase symptoms) and may include periods of prodromal or residual symptoms. During these prodromal or residual periods, the signs of the disturbance may be manifested by only negative symptoms or two (or more) symptoms listed in criterion A present in an attenuated form (e.g.,odd beliefs, unusual perceptual experiences).
D) Schizoaffective and Mood Disorder exclusion: Schizoaffective disorder and mood disorder with psychotic features have been ruled out because either
• no major depressive, manic or mixed episodes have occurred concurrently with the active-phase symptoms; or
• if mood episodes have occurred during active-phase symptoms, their total duration has been brief relative to the duration of the active and residual periods.
E) Substance/general medical condition exclusion: The disturbance is not due to the direct physiological effects of a substance (e.g., a drug of abuse, a medication) or a general medical condition.
F) Relationship to a Pervasive Developmental Disorder:
If there is a history of autistic disorder or another pervasive developmental disorder, the additional diagnosis of schizophrenia is made only if prominent delusions or hallucinations are also present for at least a month (or less if successfully treated).
1.3 Classification
Historically, schizophrenia in the West is classified into simple, catatonic, hebephrenic (now known as disorganized), and paranoid. The DSM contains five sub-classifications of schizophrenia:
• Paranoid type: Where delusions and hallucinations are present but thought disorder, disorganized behavior, and effective flattening are absent (DSM code 295.3/ICD code F20.0)
• Disorganized type: It is named ‘hebephrenic schizophrenia’ in the ICD, where thought disorder and flat affect are present together (DSM code 295.1/ICD code F20.1)
• Catatonic type: Here prominent psychomotor disturbances are evident. Symptoms can include catatonic stupor and waxy flexibility (DSM code 295.2/ICD code F20.2)
• Undifferentiated type: Psychotic symptoms are present but the criteria for paranoid, disorganized, or catatonic types have not been met (DSM code 295.9/ICD code F20.3)
• Residual type: Here positive symptoms are present at a low intensity only (DSM code 295.6/ICD code F20.5)
The ICD-10 recognises a further two subtypes:
• Post-schizophrenic depression: A depressive episode arising in the aftermath of a schizophrenic illness where some low-level schizophrenic symptoms may still be present (ICD code F20.4)
•Simple schizophrenia: insidious but progressive development of prominent negative symptoms with no history of psychotic episodes (ICD code F20.6)
1.4 Etiology
No clear picture of the etiology of this disorder has emerged. Through the hypothesis of “Neural Supernova”, a new hypothesis to explain the etiology of schizophrenia is proposed. According to this hypothesis, high levels of dopamine may result from excessive biosynthesis of the amino acid tyrosine, the precursor of dopamine. Possible mutagenesis of tryptophan synthetase or calmodulin, and low Mg2+ and high Fe2+ levels may also result in “Neural Supernova”, which is the rapid metabolic breakdown of glucose in the brain causing psychosis and ischemia. The genetic factors are the most robust of all, contributing 30 to 40% of the agreement observed in monozygotic twins (Torrey et al., 1992 ).
Schizophrenia and manic disorder often show up in the same family. Genetic abnormalities for both diseases appear on many of the same chromosomes, pathways of the neurotransmitter dopamine (a neurotransmitter acts as a chemical messengers between nerve cells) appear to be important in both illnesses. A significantly reduced level (50%) of reelin (Reelin is a protein that is important for information processing.) and its mRNA (Impagnatiello et al., 1998). and elevated levels of vesicular monoamine transporter ,VMAT2 (VMAT2 is a protein in the brain that regulates the transport of important neurotransmitters) may be useful markers for schizophrenia (Zucker et al., 2002).
Scientist Kraepelin found cause of schizophrenia is that over-secretion of the sex glands lead to creation of stimulating chemicals in the digestive systems (Kraepelin 2005). According to Albert, heredity is the cause of schizophrenia (Albert 1927). Social environment is the another vital factor for creating schizophrenia (Graae 2007). Adolf Meyer stated that biological maladjustment towards the environment as the main cause of schizophrenia to a repression of the life force and to repressed emotional complexes (Ferreira et al., 1961). Other study found that a decrease in polyunsaturated fatty acids in red blood cell membranes in patients with schizophrenia as compared with people who did not have schizophrenia. ( Hallahan et al., 2005).
A recent review listed seven genes as likely to be involved in the inheritance of schizophrenia or the risk of developing schizophrenia (Harrison & Owen 2003). Some family association studies have demonstrated a relationship to a gene known as COMT that is involved in encoding the dopamine catabolic enzyme catechol-O-methyl transferase (Shifman, et al., 2002). Schizophrenic patients tend to have low levels of DHA in their systems. Preliminary studies have shown that ingestion of 10 grams of a combination of DHA and EPA daily for several months markedly lessened symptoms in schizophrenics for many months. There is also considerable evidence indicating that stress may trigger episodes of schizophrenia. (Bebbington & Kuipers 1994).
One particularly stable and replicable finding has been the association between living in an urban environment and risk of developing schizophrenia, even after factors such as drug use, ethnic group and size of social group have been controlled (Van 2004). Those who have a history of serious childbirth complications, anoxia, secondary hemorrhage and birth complications are at increased risk to display enlarged third ventricle, periventricular damage, and prevalence of negative symptoms. (Wright et al., 1995). In a meta-analysis of 12 studies looking for complications of pregnancy and labor in 700 schizophrenics and 635 controls, found a significant association between schizophrenia and premature rupture of membranes, gestational age less than 37 weeks and use of resuscitation or of an incubator. They also found a borderline association with forceps delivery and birth weight lower than 2,500 g. (Geddes et al., 1999). Deficiency of specific nutrients causing neural tube defects have been reported even in countries with adequate food supplies. (Susser E & Lin et al., 1992).
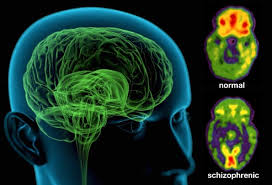
Much recent research has focused on differences in structure or function in certain brain areas in people diagnosed with schizophrenia. which came from the discovery of ventricular enlargement in people diagnosed as schizophrenic, for whom negative symptoms were most prominentm (Johnstone et al., 1976). Studies using neuro- psychological tests and brain scanning technologies such as Functional Magnetic Resonance Imaging (or fMRI) and Positron emission tomography (PET) to examine functional differences in brain activity have shown that differences seem to most commonly occur in the frontal lobes, hippocampus, and temporal lobes These differences are heavily linked to the neurocognitive deficits which often occur with schizophrenia, particularly in areas of memory, attention, problem solving, executive function and social cognition (Green 2001).
Low levels of glutathione have been associated with neurological disease, cataracts, and skin deterioration, taking acetaminophen frequently for pain can actually cause other, more serious problems. When the patient is unable to find proper and desirable expression for his instincts of self-respect, he becomes a prey to schizophrenia. Several epidemiological studies have shown that maternal exposure to influenza virus or other viruses during the second trimester of gestation is associated with increased incidence of schizophrenia later in adulthood. (Adams et al., 1993) In spite of these observations, the only definitive evidence is the association of lowered ingestion of folic acid during the first trimester of pregnancy with an increased risk for neural tube defects (spina bifida, hydrocephalus, anencephaly). Evidence relating nutritional deprivation in utero to subsequent schizophrenia can be considered to be a strong argument favoring the retinoid theory of schizophrenia (Goodman et al., 1996).
So from the above discussion it is observable that there is no unique reason for schizophrenia.
1. 5 Pathophysiology
The pathophysiology of schizophrenia is not well understood. That schizophrenia results from an excess of dopamine has been the dominant hypothesis for decades, with several modifications and expansion of the hypothesis made during the 1990s. Brain imaging studies have shown evidence of increased synaptic dopamine release in response to amphetamine administration in the striatum of schizophrenic patients. Excess dopamine may explain the positive symptoms but not the negative symptoms or other aspects of the disease. The pathophysiologic mechanisms are presumably complex—even a deficiency of dopamine is a viable explanation for negative symptoms. The clinical observations that long-term phencyclidine (PCP) use produces a broader cluster of schizophrenia-like symptoms than seen with use of dopamine agonists has led to speculation that a lack of glutamine may be involved. In contrast to the predominantly paranoid symptoms associated with long-term use of dopamine agonists, long-term PCP use produces negative symptoms and cognitive impairment in addition to reality distortion. These schizophrenia-like symptoms from PCP are hypothetically initiated by blockade of the ion channel in the N-methyl-D-aspartate (NMDA) receptor complex, resulting in diminished glutamatergic neurotransmission. Both dopaminergic and glutamatergic terminals converge on the spines of pyramidal neurons in cortex. This suggests a shared mechanism by which glutamate and dopamine play a role in schizophrenia. Although the two neurotransmitter systems share complex presynaptic and postsynaptic interactions, modulation of glutamate release by D1 dopamine receptors may mediate some of the effects of dopamine on psychosis (William et al., 2002).
Earlier postmortem histopathologic examination of the brains of patients with schizophrenia showed slight reductions in neocortical gray matter volume, decreased neuronal size, and neuronal disarray in several corticolimbic structures. Subsequent investigations have focused on changes of neuronal connectivity or microcircuitry within the cortical layers and have noted an increase in cell packing density without a change in the number of neurons. These findings suggest a decrease in neuropil and a reduction in dendritic spine density on pyramidal neurons in the prefrontal cortex. Using complementary DNA microarrays,
Postmortem studies conducted on patients with schizophrenia reveal that GABAergic hypofunction in the PFC (prefrontal cortex) and the hippocampus may be an important contributor to the pathophysiology and symptomatology of the illness. Both GABAergic neuronal density and GABA synthesis are decreased in schizophrenia. Poor memory and affect regulation, and altered working memory function are likely clinical manifestations of GABAergic hypofunction (Yanina et al., 2005).
In addition to drug probe and postmortem studies exploring the pathophysiology of schizophrenia, in vivo structural imaging studies of the brain show cortical volume reductions of one or more of the constituent structures of the medial temporal lobe (comprising the hippocampus, the amygdala, and the parahippocampal gyrus). Some studies note smaller prefrontal cortical volume, but this finding is not consistent across studies and may be limited to a subgroup of schizophrenic patients. Reductions in thalamic volume, particularly of the thalamic nuclei forming part of the temporal-thalamic and prefrontal-thalamic circuitry, are also noted (William et al., 2002).
1.6 Epidemiology
Schizophrenia occurs equally in males and females although typically appears earlier in men with the peak ages of onset being 20–28 years for males and 26–32 years for females (Castle et al., 1991) Much rare are instances of childhood-onset and late- (middle age) or very-late-onset (old age) schizophrenia (Hassett et al., 2005).The lifetime prevalence of schizophrenia, that is, the proportion of individuals expected to experience the disease at any time in their lives, is commonly given at 1%. A systematic review of many studies, however, found a lifetime prevalence of 0.55%( Goldner et al., 2002). Despite the received wisdom that schizophrenia occurs at similar rates throughout the world. Its prevalence varies across the world (Jablensky et al., 1992) within countries and at the local and neighbourhood level(Kirkbride et al., 2007). One particularly stable and replicable finding has been the association between living in an urban environment and schizophrenia diagnosis, even after factors such as drug use, ethnic group and size of social group have been controlled for ( Van et al., 2004) Schizophrenia is known to be a major cause of disability. In a study of 14 countries, active psychosis was ranked the third-most-disabling condition, after quadriplegia and dementia and before paraplegia and blindness. (Ustan et al., 1999)
Geographically, schizophrenia appears to be evenly distributed throughout the world. A country’s stage of economic development, degree of urbanization, or climate seem to have little influence on schizophrenia prevalence.
1.7 Diagnosis and Clinical Features
Although there are no biological tests which confirm schizophrenia, tests are carried out to exclude medical illnesses which may rarely present with psychotic schizophrenia-like symptoms (American Psychiatric Association 2004). These include blood tests measuring TSH to exclude hypo- or hyperthyroidism, basic electrolytes and serum calcium to rule out a metabolic disturbance, full blood count including ESR to rule out a systemic infection or chronic disease, and serology to exclude syphilis or HIV infection. Two commonly ordered investigations are EEG to exclude epilepsy, and a CT scan of the head to exclude brain lesions. It is important to rule out a delirium which can be distinguished by visual hallucinations, acute onset and fluctuating level of consciousness and indicates an underlying medical illness. According to the American Psychiatric Association, symptoms that must be present for diagnosis include a defined combination of delusions, hallucinations, and characteristic disturbances in affect, goal oriented behavior, form of thought and psychomotor behavior that cannot be established as the result of an organic disturbance. Individuals must also show continuous signs of the illness for at least six months where occupational and social functioning have deteriorated and an acute period of active symptoms must be present for at least one week.
Typically, the clinical symptoms of schizophrenia are divided into ‘positive’ and ‘negative’ types.
Positive symptoms include delusions (irrational beliefs), hallucinations (sensory perceptions with no outside stimulus), thought disorder (e.g., loosened associations) and bizarre behavior.
Negative symptoms include flat affect, social withdrawal, lack of motivation and initiative, impaired judgment and difficulty in planning.
1.8 Diagnostic issues and controversies
Schizophrenia as a diagnostic entity that has been criticised as lacking in scientific validity or reliability ( Bentall 1992). One alternative suggests that the issues with the diagnosis would be better addressed as individual dimensions along which everyone varies, such that there is a spectrum or continuum rather than a cut-off between normal and ill. This approach appears consistent with research on schizotypy and of a relatively high prevalence of psychotic experiences (Boyle 2002 and Verdoux 2002) and often non-distressing delusional beliefs (Johns 2001) amongst the general public (Verdoux 2002). Another criticism is that the definitions used for criteria lack consistency (Peter 2005) this is particularly relevant to the evaluation of delusions and thought disorder. More recently, it has been argued that psychotic symptoms are not a good basis for making a diagnosis of schizophrenia as “psychosis is the ‘fever’ of mental illness, a serious but nonspecific indicator”( David 1999).
Perhaps because of these factors, studies examining the diagnosis of schizophrenia have typically shown relatively low or inconsistent levels of diagnostic reliability. Most famously, David Rosenhan’s demonstrated that the diagnosis of schizophrenia was (at least at the time) often subjective and unreliable (Rosenhan 1973). More recent studies have found agreement between any two psychiatrists when diagnosing schizophrenia tends to reach about 65% at best (McGorry 1995). This, and the results of earlier studies of diagnostic reliability (which typically reported even lower levels of agreement) have led some critics to argue that the diagnosis of schizophrenia should be abandoned (Read 2004).
In 2006, campaigners in the UK, under the banner of campaign for abolition of the schizophrenia Label, argued for a similar rejection of the diagnosis of schizophrenia and a different approach to the treatment and understanding of the symptoms currently associated with it (Green 2001).
Alternatively, other proponents have put forward using the presence of specific neurocognitive deficits to make a diagnosis. These take the form of a reduction or impairment in basic psychological functions such as memory, attention, executive function and problem solving. It is these sorts of difficulties, rather than the psychotic symptoms (which can in many cases be controlled by antipsychotic medication), which seem to be the cause of most disability in schizophrenia. However, this argument is relatively new and it is unlikely that the method of diagnosing schizophrenia will change radically in the near future (Wilkinson 1986)
1.9 Prognosis
Prognosis for any particular individual affected by schizophrenia is particularly hard to judge as treatment and access to treatment is continually changing, as new methods become available and medical recommendations change. Numerous international studies have demonstrated favorable long-term outcomes for around half of those diagnosed with schizophrenia, with substantial variation between individuals and regions (Harrison et al., 2001). One retrospective study found that about a third of people made a full recovery, about a third showed improvement but not a full recovery, and a third remained ill (Harding et al., 1987). A clinical study using strict recovery criteria (concurrent remission of positive and negative symptoms and adequate social and vocational functioning continuously for two years) found a recovery rate of 14% within the first five years (Robinson et al., 2004). A 5-year community study found that 62% showed overall improvement on a composite measure of symptomatic, clinical and functional outcomes (Harvey et al., 2007). Rates are not always comparable across studies because an exact definition of what constitutes recovery has not been widely accepted, although standardized criteria have been suggested (Van et al., 2006). The World Health Organization conducted two long-term follow-up studies involving more than 2,000 people suffering from schizophrenia in different countries. These studies found patients have much better long-term outcomes in developing countries (India, Colombia and Nigeria) than in developed countries (USA, UK, Ireland, Denmark, Czech Republic, Slovakia, Japan, and Russia) (Hopper et al., 2000), despite the fact antipsychotic drugs are typically not widely available in poorer countries, raising questions about the effectiveness of such drug-based treatments.
Several factors are associated with a better prognosis of schizophrenia which are being female, acute (vs. insidious) onset of symptoms, older age of first episode, predominantly positive (rather than negative) symptoms, presence of mood symptoms and good premorbid functioning (Davidson et al., 1997 and Lieberman et al., 1996). Most studies done on this subject, failed to make any correlation with a clear cause or effect. Evidence is also consistent that negative attitudes towards individuals with schizophrenia can have a significant adverse impact. In particular, critical comments, hostility, authoritarian and intrusive or controlling attitudes (termed high ‘Expressed emotion’ or ‘EE’ by researchers) from family members have been found to correlate with a higher risk of relapse in schizophrenia across cultures (Bebbington et al., 1994).
1.10 Treatment
Even though schizophrenic disorder is common, debilitating, and expensive, researchers have directed relatively little attention to developing effective treatment for primary care. Though there is no cure for schizophrenia, a wide variety of treatment options are available to sufferers with the disorder. Schizophrenia treatment is now quite effective in most cases, and can suppress symptoms and prevent relapse in the majority of schizophrenics. However, treatments are ongoing and usually lifelong.
The first line treatment for schizophrenia is usually the use of antipsychotic medication. The newer atypical antipsychotic medication (such as olanzapine, risperidone and clozapine) is preferred over older typical antipsychotic medication (such as chlorpromazine and haloperidol), as the atypicals have different side effect profiles, including less frequent development of extrapyramidal side-effects. However, it is still unclear whether newer drugs reduce the chances of developing the rare but potentially life-threatening neuroleptic malignant syndrome.
Atypical antipsychotics have been claimed to have additional beneficial effects on negative as well as positive symptoms. However, the newer drugs are much more costly as they are still within patent, whereas the older drugs are available in inexpensive generic forms. Aripiprazole a drug from a new class of antipsychotic drugs (variously named ‘dopamine system stabilizers’ or ‘partial dopamine agonists’) has recently been developed and early research suggests that it may be a safe and effective treatment for schizophrenia (Potkin et al., 2003).
Hospitalisation may occur with severe episodes. This can be voluntary or (if mental health legislation allows it) involuntary (called civil or involuntary commitment). Mental health legislation may also allow a person to be treated against their will. However, in many countries such legislation does not exist, or does not have the power to enforce involuntary hospitalisation or treatment.
Psychotherapy or other forms of talk therapy may be offered, with cognitive behavioural therapy being the most frequently used. This may focus on the direct reduction of the symptoms, or on related aspects, such as issues of self-esteem, social functioning, and insight. There have been some promising results with cognitive behavioural therapy, but the balance of current evidence is inconclusive (Cormac et al., 2002).
Other support services may also be available such as drop-in centres, visits from members of a ‘community mental health team’ and patient-led support groups. In recent years the importance of service-user led recovery based movements has grown substantially throughout Europe and America. Groups such as the Hearing Voices Network and more recently, the Paranoia Network, have developed a self-help approach that aims to provide support and assistance outside of the traditional medical model adopted by mainstream psychiatry. By avoiding framing personal experience in terms of criteria for mental illness or mental health, they aim to destigmatise the experience and encourage individual responsibility and a positive self-image.
In many non-Western societies, schizophrenia may be treated with more informal, community-led methods. A particularly sobering thought for Western psychiatry is that the outcome for people diagnosed as schizophrenic in non-Western countries may be actually be much better (Kulhara 1994) than for people in the West. The reasons for this recently discovered facts are still far from clear, although cross-cultural studies are being conducted to find out why. One important factor may be that many non-Western societies (including intact Native American cultures) are collectivist societies, in that they emphasize working together for the good other society members. This is in contrast to many Western societies, which can be highly individualistic. Collectivist societies tend to stress the importance of the connectedness of extended family, providing a useful support mechanism for the stress that mental illness plays on both the ill and others around them.
1.11 Alternative Treatments
Alternative treatments for schizophrenia are available, although they are never recommended without first seeking medical treatment. They are most effective when paired with antipsychotics and administered under doctor supervision. In particular, dietary supplements have proven to have dramatic effects on the symptoms of schizophrenia.
Glycine Supplements: Glycine, an amino acid, is shown to help alleviate negative symptoms in schizophrenics by up to 24%.
Omega-3 Fatty Acids: Found in fish oils, Omega-3 fatty acids high in EPA can help to reduce positive and negative symptoms associated with schizophrenia.
Antioxidants: The antioxidants Vitamin E, Vitamin C, and Alpha Lipoic Acid show a 5 to 10% improvement in symptoms of the disorder.
Other natural therapies for schizophrenia that have been found to be at least somewhat effective include vitamin E, an important fat soluble antioxidant that protects cell membranes; alpha lipoic acid; N-acetyl cysteine, acetile; L-carnitine; co-enzyme Q10; phosphatidylserine; NADH (nicotinamide adenine dinucleotide); and ginkgo biloba.
1.12 Alternative approaches to schizophrenia
An approach broadly known as the anti-psychiatry movement, most active in the 1960s, opposes the orthodox medical view of schizophrenia as an illness (Cooper 1969). Psychiatrist Thomas Szasz has argued that psychiatric patients are not ill but are just individuals with unconventional thoughts and behaviour that make society uncomfortable. (Szasz 1984). He argues that society seeks to unjustly control such individuals by classifying their behaviour as an illness and forcibly treating them as a method of social control. An important but subtle point is that Szasz has never denied the existense of the phenomena that mainstream psychiatry classifies as an illness (such as delusions, hallucinations or mood changes) but simply does not believe that they are a form of illness.
Similarly, psychiatrist R. D. Laing has argued that the symptoms of what we call mental illness are just reasonable (although perhaps not always obviously comprehensible) reactions to impossible demands that society and particularly family life puts on some individuals (Colin 2004). Laing was revolutionary in valuing the content of psychotic experience as worthy of interpretation, rather than considering it simply as a secondary but essentially meaningless marker of underlying psychological or neurological distress.
It is worth noting that neither Szasz nor Laing ever considered themselves to be ‘anti-psychiatry’ in the sense of being against psychiatric treatment, but simply believed that it should be conducted between consenting adults, rather than imposed upon anyone against their will (Colin 2004). In the 1976 book The Origin of Consciousness in the Breakdown of the Bicameral Mind, by psychologist Julian Jaynes proposed that until the beginnings of historic times schizophrenia or a closely similar condition was the normal human consciousness (Jaynes 1976), a “bicameral mind” in which a normal state of low affect suitable for routine activities would be interrupted in moments of crisis by “mysterious voices” giving instructions, which early people characterized as interventions from the gods. This theory was briefly controversial but continued work has not provided additional support.
Psychiatrist Tim Crow has argued that schizophrenia may be the evolutionary price we pay for a left brain hemisphere specialisation for language (Pfeiffer et al., 1988). Since psychosis is associated with greater levels of right brain hemisphere activation and a reduction in the usual left brain hemisphere dominance, our language abilities may have evolved at the cost of causing schizophrenia when this system breaks down.Researchers into shamanism have speculated that in some cultures schizophrenia or related conditions may predispose an individual to becoming a shaman (Polimeni & Reiss 2002). . Certainly the experience of having access to multiple realities is not uncommon in schizophrenia, and is a core experience in many shamanic traditions.
Alternative medicine tends to hold the view that schizophrenia is primarily caused by imbalances in the body’s reserves and absorption of dietary minerals, and/or the presence of heavy metals. The body’s adverse reactions to gluten are also strongly implicated in some alternative theories
1.13 Relationship between trace elements and psychiatric disorder particularly schizophrenia
Trace elements are required for numerous metabolic and physiological processes in the human body.( Mertz 1981). They play a part in the synthesis and structural stabilization of both proteins and nucleic acids. Therefore, imbalances in the optimum levels of trace elements may adversely affect biological processes, and are associated with many diseases (Muralidhar 2004).
Trace elements like selenium (Se), manganese (Mn), copper (Cu), zinc (Zn), lead (Pb) and iron (Fe), cadmium (Cd), calcium (Ca) have been studied in many diseases, including autoimmune, neurological, and psychiatric disorders. These elements are incorporated into the structures of proteins, enzymes, and complex carbohydrates. They take part in biochemical reactions together with enzymes. For example copper is an important component of several metalloenzymes, including tyrosinase and dopamine hydroxylase (Livesay 2003). It also plays a well-known role in neurological disorders. zinc plays essential roles in many aspects of metabolism including the activity of more than 300 enzymes, the structure of many proteins, and control of genetic expression (Vallee et al., 1991, Vallee and Falchuk, 1993). Zinc status affects basic processes of cell division, growth, differentiation, development, performance and aging through its requirement for synthesis and repair of DNA, RNA and protein and for many other aspects of metabolism indicated by the references (Chesters et al., 1990; Blanchard and Cousins 1996). Zinc is unevenly distributed within the brain with particularly high concentrations in the hippocampal mossy fiber system, where it acts as a neuromodulator (Xie and Smart 1991). Interactions with inhibitory (Smart and Constanti 1990) and excitatory amino acid neurotransmission (Yeh et a1., 1990) are well known. Although low to moderate concentrations of zinc attenuate N-methyl-o-aspartate (NMDA)- mediated and enhance quisqualate-mediated neurotoxicity (Koh and Choi 1988), high concentrations of zinc are neurotoxic (Yokoyama et al., 1986).
It is known that the trace elements are necessary for the continuous systematic functioning of the immune system; magnesium (Mg) is required for the synthesis of all proteins, nucleic acids, nucleotides, lipids, and carbohydrates, as also for the contraction of muscles. Iron (Fe), apart from its presence in all body cells, plays a role in the oxygenation of tissues as it is incorporated in the haeme structure of haemoglobin. Any sort of disorder (negative or positive) in the concentration level of these trace elements may help in developing psychiatric disorders. Study showed that the serum concentration of Mn and Cu increased significantly (p = 0.000; p = 0.022 respectively) in somatization disorder petients while the concentration of Zn ( p =0.954) remained unchanged ( Hossain et al., 1995) Calcium raises the threshold at which nerves cells fire, thus reducing the irritability or sensitivity of the nervous system. A person whose tissue calcium level is low is prone to nervous irritability (Abramson et al ., 1995) . For instance, it was found that serum Cu level was lower in schizophrenic patents than in controls and Zn and Mg concentrations were higher in schizophrenic patients than in controls (Gonzalez 1998). But other study showed that serum Cu concentrations were significantly higher and Zn and Mg concentrations were lower in schizophrenic patients than in controls (Maes et al., 1997 , Mcloughlin et al., 1990 and Kirov et al., 1990 ). On the other hand study showed that Plasma Cu concentrations were significantly higher (P<0.01) and Mn and Fe concentrations were lower (P 0.05) compared with the control groups. But the concentration of Fe in schizophrenic patients was significantly different from that of controls (p < 0.05) (Karim et al., 2005) .
These observations suggest that alterations in essential trace elements Mn, Ca and Zn may play a role in the pathogenesis of neurological and psychiatric diseases like schizophrenia. Therefore attempts were made to investigate the hair trace elements in patients with schizophrenic patients to find out the correlation between trace element levels with the degree of disorder, if any.
1.14 Role of trace elements in diseases
Since maximum evolution of life occurred in the seas and the rest of its span occurred on land. Around 7/8 of the 4 billion year long evolution of life occurred in the seas, and only 1/8 of its span occurred on land, we have inherited an absolute dependency upon the complete range of the 72 natural trace elements, as found in the seas, in all of our daily food for our physical and mental health. This massive trace element deficiency in our daily food is the direct cause of a great number of diseases such as, but not limited to, breast, colon, prostate and lung cancers, leukemia, lupus, Multiple Sclerosis (MS), Amyotrophic Lateral Sclerosis (ALS), Alzheimer’s disease, Attention Deficit Disorder (ADD), Attention Deficit / Hyperactivity Disorder (ADHAD), bi-polar, heart & cardiovascular diseases, arthritis, diabetes, edema, arteriosclerosis, osteoporosis, herpes, influenza, many allergies and birth defects (Schroeder 1978, Morowitz 1992, Emsley 1993, Rhodes et al., 1993).
There are currently nine trace minerals for which humans are considered to have a nutritional requirement: iron, zinc, copper, selenium, iodide, manganese, molybdenum, chromium and cobalt. Although it is recognized that a nutritional requirement for additional microminerals (e.g., boron) may be confirmed and that in one case (fluoride) it is partly a question of semantics, it is also true that the evidence for a nutritional requirement for some trace elements included in the “essential” list is still tenuous or limited. Cobalt, for example, is included only because an atom of this mineral is in the cyanocobalamin molecule. There is a wide range in apparent practical implications of these elements as nutrients in the likelihood and extent of clinical and/or public health importance of a nutrient deficiency or excess. There are also notable differences between the trace elements in the availability of biomarkers. Each of these factors influences the attention accorded to individual minerals (Krebs et al., 2003).
Trace elements play an important role in maintaining the three dimensional structure of proteins. Different types of enzymes and hormones are protein in nature, and trace elements play important role to maintain the integrity of protein structure. For example, superoxide dismutase, an oxidoreductase enzyme, is a metalloenzyme, i.e., it contains metal ions in its structure (Livesay, 2003). There are several forms of superoxide dismutase, including MnSOD, which contains a manganese ion and is located exclusively in the mitochondria, FeSOD which contains an iron ion and is generally found in some prokaryotes, and CuZnSOD, which is active in the cytoplasm of eukaryotic cells. Copper is another abundant trace metal in biological systems and is often found as a co-factor in proteins spanning over a wide range of function. Copper containing proteins can be found in electron transfer processes and in fibrinolytic pathways.
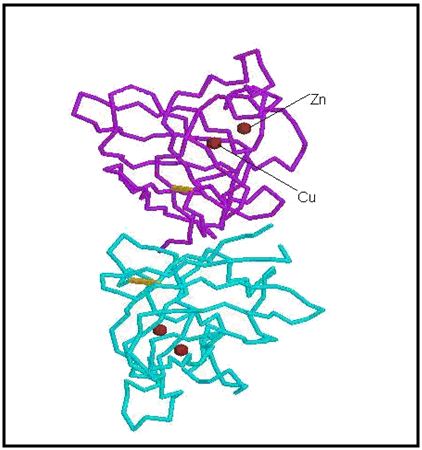
Figure: 1.1 Protein structure of CuZnSOD. The two metal ions are shown and labeled on the upper subunit.
1.15 Clinical deficiency syndromes of trace elements
It is however; now clear that as in an individual with progressively more severe depletion of trace elements status, he/she will pass through a series of stages with biochemical or physiological consequences. The metabolic or physiological penalty of such a sub – optimal nutritional status is usually not clear, but the assumption remains that this imparted metabolism is likely to result in detrimental effects. Similarly, specific and localized tissue deficiencies can occur which can lead to pathological changes. Such situations can be defined as sub – clinical deficiency. The time course for development of a sub – clinical deficiency state varies for each individual trace element, and depends upon the nature and amount of tissue or body stores.
1.16 Aim of the study
Schizophrenia is one of the most abundant psychiatric diseases prevalent in the population of Bangladesh and threatened, (0.80%) (Census Bureau, 2004). It is an abnormally elated mental state; typically characterized by feelings of euphoria, lack of inhibitions, racing thought, diminished need for sleep, talkativeness, risk talking and irritability. In extreme cases, schizophrenia can induce hallucinations and psychotic symptoms.
A number of factors may contribute to the development of this disease. There are lots of controversies to find out the possible reasons for the development of schizophrenia disorder as well as the the establishment for the diagnosis, which is considered to be very important for the treatment of this disease and also for the design of new drug molecules against this kind of disease. The Three-dimensional active conformation of many important proteins may play an essential role to prevent this disease. Conversion of active to inactive; or inactive to active conformation may contribute to the development of schizophrenia disorder. To maintain this three-dimensional structure of protein, some trace elements like Zn, Mn, Mg, Cu, Cs, Se, Li, Fe, Ca etc. may have a very important role. Any abnormalities in the concentration level of these trace elements cause schizophrenic disorder. There is very little information available on this type of work, particularly no such work has yet been done in Bangladesh.
2.1 Methodology
2.1.1 Study protocol
30 male patients were diagnosed as having schizophrenic disorder who were certified by psychiatrist and 30 sex, education and age matched eligible controls were enrolled in our study. Both groups were interviewed and asked to complete a questionnaire concerning their use of drugs, including use of any diabetes medication or steroids, smoking or other habits that could affect the outcome of the results. Patients and controls were categorized in terms of occupation such as service holder, housewife, laborer, and businessman or other. Two psychiatrists specialist gave all patients and controls a routine physical check up including their organ activity, weight, nutritional condition, blood pressure (high blood pressure considered having a systolic pressure of 140-190 mmHg for more than 10 years). The study subjects were briefed about the purpose of the study and written consent was obtained from each of them Hair samples were collected in metal-free Polybags from patients and control subjects. Zn, Ca, Mn, levels (microgram/gm in hair samples) in both cases were determined by using Flame Atomic Absorption Spectroscopy. Data are expressed as mean ± SD and analyzed by the statistical software SPSS/PC ( windows version 12). Comparison between patient and control groups were made by using independent sample T-test.
2.1.2 Flame Atomic Absorption Spectroscopy
2.1.2.1 Description
FAAS (Flame Atomic Absorption Spectroscopy) is a fast and easy technique with an extremely high sensitivity (especially for elements like Zn, Ca, and Mn), although problems can arise as a result of chemical (a much worse situation than with ICP-AES) and spectral interferences. The sample is atomized in the flame, through which radiation of a chosen wavelength (using a hollow cathode lamp) is sent. The amount of absorbed radiation is a quantitative measure for the concentration of the element to be analyzed. The most courant gas mixtures used are air/acetylene and nitrous-oxide/acetylene. The latter resulting in higher atomization efficiencies and thus better detection limits for elements like Si, Al, Sc, Ti, V and Zr. The air/acetylene flame can be used for easy atomizable elements (e.g. As and Se). Background correction can be achieved with a deuterium lamp although several disadvantages subsequently occur. A disadvantage of the AAS technique is the non-linearity of the calibration curves when absorbance becomes higher than 0.5 to 1. The relative standard deviations are between 0.3 and 1% for absorbances of 0.1 to 0.2. Detection limits for flame AAS vary enormously from 1 – 5 ppb (e.g. Ca, Cd, Cr, Cu) to more than 1000 ppb. Some elements (e.g. B, C, Br) cannot be measured at all. The SpectrAA-220 FS measures samples element by element, unlike conventional AA systems, which still determine all samples for one element, before repeating these samples again for subsequent elements.
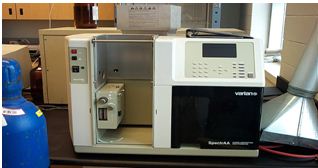
Figure: 1.3.: Flame Atomic Absorption Spectroscopy (Varian SpectrAA 220 Fast Sequential).
Table:1 Recommended instrument Parameters for determination of Zn,Mn and Ca
Lamp current | 5mA |
Fuel | Acetylene |
Support | Air |
Flame Stochiometry | Oxidizing |
2.1.3 Hair Sample Collection
2.1.3.1 Selection of patients
The study protocol was approved by Department of Psychiatry, Bangabandhu Sheikh Mujib Medical University Hospital, , Dhaka, Bangladesh. The study enrolled 30 patients. The patients were aged from 20-60 years & described as Schizophrenia psychiatric disorder by Dr. Shalahuddin Qusar (Biplob), MBBS (Dhaka), M.Phil (Psychiatry), Assistant Professor, Department of Psychiatry, Bangabandhu Sheikh Mujib, Medical University, (BSMMU). We have collected hair from the nape or occipital regions, as close to the scalp as possible. The volunteers participated with their own interest in this research work. We have strictly followed doctor’s instructions to select schizophrenic patients and collect their scalp hair. The detailed history of patient volunteers & control volunteers were noted in a prescribed format, shown in and table. These data have helped us to identify patient’s present status, family history of schizophrenic disorder, patient’s physical condition, age, sex, residence, body-weight height etc (Table 16 & 17). We have recorded and maintained all the consent forms and scalp hair sample collection data forms.
2.1.3.2. Hair collection apparatus:
• Scsissors (Galvanized)
• Comb
• Hand gloves
• HDPE (High density poly ethylene)
2.1.3.3 Reagents for analysis trace elements by AAS
• Concentrated Trace metal graded Nitric acid (HNO3 ) (65%)
• Perchloric acid (HClO4) ( 70%)
2.1.3.4 Sample preparation for analysis
Approximately 100 mg of hair samples were cut with scissor from the scalp in the nape or occipital regions, as close to the scalp as possible. The distal ends of the hair were cut from the sample, leaving the specimens 3-5 cm in length. Samples were washed five times with HPLC grade water and then kept at 800 C temperature temperature for 24 hrs. After that 10 mg hair samples were measured and then kept in volumetric flask which were kept in 1200c temperature for 24 hrs, after adding 5 ml Concentrated Nitric acid (65%).Then 2 ml Perchloric acid was added and kept at 1700c temperature until dryness. 1 (N) trace metal graded concentrated Nitric acid (65%) was added to make the final volume 30 ml.
2.1.4 Volunteer Consent Form
I, the undersigned, authorize the Research student to consider me as a volunteer for his/her Research work. I understand that I can change my mind at any time to withdraw my self as volunteer during this research work.
Volunteer consent to study treatment Please tick as appropriate
1.Have you complete idea about the type, ultimate goal
and methodology of the research?
yes/no
2. Are you aware that you don’t have to face any physical,
mental and social risk for this?
yes/no
3. There will be no chance to injury in any of your organs,
are you aware of this?
yes/no
4. Have you got any idea about the outcome of this experiment? yes/no
5. Have you decided intentionally to participate in this experiment?
yes/no
6. Do you think this experiment violate your human rights?
yes/no
7. Are you sure that all the information regarding you will be yes/no
kept confidentially?
8. No remuneration will be provided for this experiment, are you aware of this?
yes/no
After reading the above mentioned points, I am expressing my consent to participate in this experiment as a volunteer.
Volunteer signature: _______________________________
Date: __________________________________________
[Please return the signed copy to the Research student and keep an extra copy for yourself.]
Questionnaires
(Determination of trace element from scalp hair sample)
1.Identification
1.1 I.D Code:
1.2 Name:
1.3 Father’s/ Husband’s Name:
1.4 Sex: Male Female 1.5 Marital Status:
1.6 Date of Birth (dd/mm/yy): 1.7 Age (yr):
1.8 Mailing
address
Ph
1.9 Permanent
address
Ph
1.10 Religion
1.11 Nationality
2. Personal History
2.1 Area of residence Rural Urban S-Urban Others
Where have you spent your boyhood (1-15 y)?
Where have you spent at least ¾th or more of your life time?
2.2 Education Level 2.3 Occupation 2.4 Family expenses /month
Illiterate Professional/Managerial/
Business
Can read only Clerical 2.5 Impression about social class
Can write a letter Technical Rich
SSC or equivalent Skilled worker Upper Middle
HSC or equivalent Unemployed/ Pensioner Lower Middle
Graduate or higher Housewife Poor
Other Others Destitute
2.6 Smoking Habit 2.7a Current smoker
Never Sticks/ Day
Ex-smoker > 6 months 2.7b Ex-smoker
Current smoker Sticks /day
3. Biophysical Characteristics
3.1 Height (cm): 3.2 Weight (kg):
3.3 Pulses /min: 3.4 Temperature:
3.5 BP (Sys/Dias): 3.6: Food Habit:
4. Previous history of psychiatric disorder: yes/no
5. Family history of psychiatric disorder: yes/no
8. Case: i) New ii) Old
9. Symptom:
Investigated by
Name: Signature:
2.1.5 Determination of Zinc
2.1.5.1 Preparation of std. solution:
Recommended std. materials: Zinc metal granules 99.99%
(Source: ABCR, Germany)
Solution Preparation (Std. Solution): 1.000 g of zinc was dissolved in 40 ml 1:1 hydrochloric acid & diluted upto 1 litter to make 1000 g/ml of Zn solution.
Table 02: Working conditions. (Variable) for Zn analysis
Wavelength (nm.) | Slit width (nm) | Optimum working range (mg/ml) |
213.9 | 1.0 | 0.01-2 |
307.6 | 1.0 | 100-14000 |
Table 03: Flame emission for Zn analysis
Wave length | 213.9 nm |
Slit width | 0.1nm |
Fuel | Acetylene |
Support | Nitrous oxide |
2.1.5.2 Determination of absorbance
Different concentration of Zn solution was prepared (0, 0.2,0.4, 0.8,1.6 mg/L)These solutions were placed in Flame Atomic Absorption Spectroscopy (FAAS) machine and absorbance was measured.
2.1.5.3 Interferences
No chemical interferences have been found in Zn air acetylene flame. When working with biological samples, it is necessary to avoid the physical effects of proteins molecules on equalizer performance. At the 213.9 nm wavelength, non-atomic species in the flame absorb strongly.
2.1.6 Determination of Calcium
2.1.6.1 Preparation of std. solution
Recommended std. materials: Calcium metal strip or wire 99.99%
Solution Preparation (Std solution): Dissolve 1.000 g of calcium metal in a minimum volume of 1:1 nitric acid & dilute to 1 liter to give 1000 g/ml Ca
Table 04: Working conditions. (Variable) for Ca analysis
Wavelength (nm) | Slit width (nm) | Optimum working range (mg/ml) |
324.7 | 0.5 | 0.03-10 |
327.4 | 0.2 | 0.1-24 |
217.9 | 0.2 | 0.2-60 |
218.2 | 0.2 | 0.3-80 |
222.6 | 0.2 | 1-280 |
244.2 | 1.0 | 10-2000 |
Table 05: Flame emission for Ca analysis
Wave length | 324.7 nm |
Slit width | 0.1nm |
Fuel | Acetylene |
Support | Nitrous oxide |
2.1.6.2 Preparation of Standard Curve of Ca
Different concentration of Casolution was prepared (0, 0.25,0.5,2 mg/L Ca. These solutions were placed in FAAS machine and absorbance was measured.
2.1.6.3 Interferences
No interference has been repeated for copper in air-acetylene flame, but some depression has been noted at high Zn/Cu ratios. This can be minimized by the use of a lean air-acetylene flame.
2.1.7 Determination of Manganese
2.1.7.1 Preparation of std. solution:
Recommended std. materials: Manganese metal strip or wire 99.99%
(Source: ABCR, Germany)
Solution Preparation (Std. Solution): 1.000 g manganese was dissolved in a minimum volume of 1:1 nitric acid & diluted upto 1 litter to make 1000 g/ml Mn of solution.
Table 06: Working conditions. (Variable) for Mn analysis
Wavelength nm. | Slit width nm. | Optimum working range mg/ml |
279.5 | 0.2 | 0.02-5 |
403.1 | 0.2 | 0.5-60 |
321.7 | 0.2 | 100-14000 |
Table 07: Flame emission for Mn analysis
Wave length | 403.1 nm |
Slit width | 0.1nm |
Fuel | Acetylene |
Support | Nitrous oxide |
2.1.7.2 Preparation of Standard Curve of Mn
Different concentration of Mn solution was (0, 0.5, 1.0, 2.0, 4 mg/L Mn). These solutions were placed in FAAS machine absorbance was measured.
2.1.7.3 Interferences
In a reducing air, acetylene flame the absorbance is depressed in the presence of phosphate, perchlorate, iron, nickel, silicon & cobalt. In an oxidizing air acetylene flame or a nitrous oxide-acetylene flame these interferences do not arise. No releasing agent is usually necessary.
2.1.8 Preparation of standard curve
2.1.8.1 Standard curve of Zn
Absorbance of different concentration (table : 08) of standard Zn solutions were plotted and automatically a standard curve was found by using SpactrAA software supplied by the manufacturing company
Table 08: The different concentration of standard Zn solution and the absorbance
Concentration (mg/L) | Absorbance (nm) | |
0 | 0 | |
0.2 | 0.0388 | |
0.4 | 0.0774 | |
0.8 | 0.1699 | |
1.6 | 0.3076 |

Figure: 1.4 Standard curve of Zn
2.1.8.2 Standard curve of Ca
Absorbance of different concentration (table : 09) of standard Zn solutions were plotted and automatically a standard curve was found by using SpactrAA software supplied by the manufacturing company
Table 09: The different concentration of standard Ca solution and the absorbance
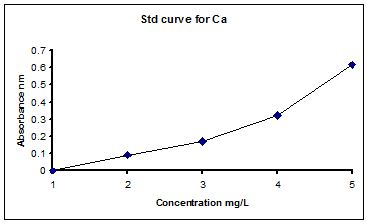
Figure: 1.5 Standard curve of Ca
2.1.8.3 Standard curve of Mn
Absorbance of different concentration (table : 10) of standard Zn solutions were plotted and automatically a standard curve was found by using SpactrAA software supplied by the manufacturing company.
Table 10: The different concentration of standard Mn solution and the absorbance
Concentration (mg/L) | Absorbance | |
0 | 0 | |
0.5 | 0.0893 | |
1 | 0.1699 | |
2 | 0.3216 | |
4 | 0.6158 |
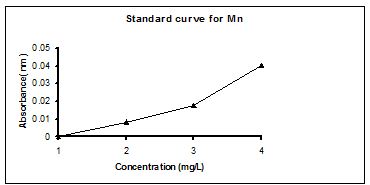
Figure: 1.6 Standard Curve of Manganese (Mn).
2.1.9 Statistical analysis:
The results were expressed as mean ± SD by using SPSS (Windows Version 12) software. Differences between groups were measured by independent sample T-tests. The significance level was set at
3.1. Results and Discussion:
3.1.1 Zn, Mn and Ca levels in scalp hair of schizophrenic patients and controls
Trace elements ( Zn, Mn and Ca) concentrations in scalp hair of schizophrenic patients (n = 30) and healthy volunteers ( n = 30) are arranged in table 11, to analyze the data.
Table 11: Scalp hair trace elements level of schizophrenic patients (n=30) and healthy volunteers (n=30)
Serial No | Zn Control mg/gm of hair sample | Zn Patient mg/gm of hair sample | Mn Control mg/g of hair sample | Mn Patient mg/g of hair sample | Ca Control mg/g of hair sample | Ca Patient mg/g of hair sample |
1 | 153 | 276 | 6 | 3 | 546 | 387 |
2 | 207 | 162 | 3 | 4 | 342 | 554 |
3 | 246 | 181 | 3 | 3 | 606 | 195 |
4 | 183 | 162 | 6 | 3 | 612 | 188 |
5 | 208 | 225 | 9 | 6 | 510 | 153 |
6 | 216 | 102 | 6 | 3 | 393 | 174 |
7 | 186 | 81 | 6 | 9 | 429 | 162 |
8 | 189 | 102 | 9 | 9 | 474 | 135 |
9 | 105 | 126 | 6 | 3 | 591 | 642 |
10 | 225 | 171 | 3 | 4 | 559 | 168 |
11 | 255 | 153 | 3 | 3 | 576 | 411 |
12 | 156 | 285 | B.D.L | 6 | 556 | 432 |
13 | 123 | 126 | 6 | B.D.L | 606 | 528 |
14 | 306 | 294 | 3 | B.D.L | 745 | 483 |
15 | 209 | 183 | 3 | 3 | 1321 | 432 |
16 | 201 | 145 | 6 | B.D.L | 696 | 495 |
17 | 195 | 156 | 6 | 4 | 549 | 432 |
18 | 192 | 95 | 6 | 6 | 645 | 414 |
19 | 234 | 195 | 3 | 6 | 666 | 471 |
20 | 210 | 102 | 3 | 6 | 693 | 372 |
21 | 246 | 144 | 3 | 6 | 654 | 421 |
22 | 171 | 162 | 3 | 3 | 865 | 762 |
23 | 183 | 285 | B.D.L | 3 | 693 | 412 |
24 | 186 | 225 | 3 | B.D.L | 690 | 204 |
25 | 208 | 177 | 9 | 3 | 267 | 465 |
26 | 477 | 141 | 3 | 6 | 682 | 406 |
27 | 189 | 153 | 6 | 3 | 641 | 444 |
28 | 456 | 134 | 3 | 3 | 723 | 489 |
29 | 209 | 162 | 3 | 3 | 682 | 561 |
30 | 189 | 243 | 3 | 3 | 615 | 495 |
| Total | 6513 | 5148 | 132 | 114 | 18627 | 11887 |
| Mean | 217.1 | 171.6 | 4.4 | 3.8 | 620.9 | 396.2333 |
| Maximum | 477 | 294 | 9 | 9 | 1321 | 762 |
| Minimum | 153 | 81 | 3 | 3 | 267 | 135 |
| S.D | 77.86 | 59.04 | 2.3282 | 2.3101 | 181.555 | 157.8292 |
| S.E.M | 14.21 | 10.7792 | 0.42507 | 0.421818 | 33.1472 | 28.8155 |
* B.D.L = Below detection limit. * S.D = Standard deviation.* S.E.M= Standard error mean
3.2 Data Interpretation for Zinc element
Different concentration of Zinc (Table:12) in the hair sample of schizophrenic patients & healthy volunteers are determined and then make a comparison study using independent samples T- test (Table :18).
Table :12 Scalp hair Zn level of Schizophrenic patients (n=30) and controls (n=30)
| Zn Concentration (µg/gm of scalp hair sample) | |
Code | Control | Patient |
1 | 153 | 276 |
2 | 207 | 162 |
3 | 246 | 181 |
4 | 183 | 162 |
5 | 208 | 225 |
6 | 216 | 102 |
7 | 186 | 81 |
8 | 189 | 102 |
9 | 105 | 126 |
10 | 225 | 171 |
11 | 255 | 153 |
12 | 156 | 285 |
13 | 123 | 126 |
14 | 306 | 294 |
15 | 209 | 183 |
16 | 201 | 145 |
17 | 195 | 156 |
18 | 192 | 95 |
19 | 234 | 195 |
20 | 210 | 102 |
21 | 246 | 144 |
22 | 171 | 162 |
23 | 183 | 285 |
24 | 186 | 225 |
25 | 208 | 177 |
26 | 477 | 141 |
27 | 189 | 153 |
28 | 456 | 134 |
29 | 209 | 162 |
30 | 189 | 243 |
Total | 6513 | 5148 |
Mean ± S.D | 217.1 ± 77.86 | 171.6 ± 59.04 |
*S.D = Standard Deviation
3.2.1 Comparison of Zn level in scalp hair between controls and schizophrenic patients.
Mean levels of Zn in scalp hair (Table 12), of schizophrenic patiens and controls are compared by graphical representation.
3.3 Data Interpretation for Manganese element
Different concentration of Mn (Table:13) in the scalp hair sample of schizophrenia patients
( n = 30) & healthy volunteers ( n = 30) are determined and then make a comparison using independent samples T- test (Table :19).
Table: 13 Scalp hair Mn level of Schizophrenic patients (n=30) and controls (n=30)
| Mn concentration (µg/gm of scalp hair sample ) | |
Sample code | Control | Patient |
1 | 6 | 3 |
2 | 3 | 4 |
3 | 3 | 3 |
4 | 6 | 3 |
5 | 9 | 6 |
6 | 6 | 3 |
7 | 6 | 9 |
8 | 9 | 9 |
9 | 6 | 3 |
10 | 3 | 4 |
11 | 3 | 3 |
12 | B.D.L | 6 |
13 | 6 | B.D.L |
14 | 3 | B.D.L |
15 | 3 | 3 |
16 | 6 | B.D.L |
17 | 6 | 4 |
18 | 6 | 6 |
19 | 3 | 6 |
20 | 3 | 6 |
21 | 3 | 6 |
22 | 3 | 3 |
23 | B.D.L | 3 |
24 | 3 | B.D.L |
25 | 9 | 3 |
26 | 3 | 6 |
27 | 6 | 3 |
28 | 3 | 3 |
29 | 3 | 3 |
30 | 3 | 3 |
Total | 132 | 114 |
Mean ± S.D | 4.4 ± 2.3282 | 3.8 ± 2.3101 |
* B.D.L = Below Detection Limit
*S.D = Standard Deviation
3.3.1 Comparison of hair Mn level in controls with the schizophrenic patients.
Hair mean levels of Mn (Table 13) in schizophrenic patiens and controls are compared by graphical representation.
3.4 Data Interpretation for Calcium element
Different concentration of Calcium (Table:14) in the hair of schizophrenia patients
( n = 30) & healthy volunteers (n = 30) are determined and then make a comparison using independent samples T- test (Table:20)
Table:14 Scalp hair Ca level of Schizophrenic patients (n=30) and controls (n=30)
| Ca concentration (µg/gm of scalp hair sample) | |
Sample code | Control | Patient |
1 | 546 | 387 |
2 | 342 | 554 |
3 | 606 | 195 |
4 | 612 | 188 |
5 | 510 | 153 |
6 | 393 | 174 |
7 | 429 | 162 |
8 | 474 | 135 |
9 | 591 | 642 |
10 | 559 | 168 |
11 | 576 | 411 |
12 | 556 | 432 |
13 | 606 | 528 |
14 | 745 | 483 |
15 | 1321 | 432 |
16 | 696 | 495 |
17 | 549 | 432 |
18 | 645 | 414 |
19 | 666 | 471 |
20 | 693 | 372 |
21 | 654 | 421 |
22 | 865 | 762 |
23 | 693 | 412 |
24 | 690 | 204 |
25 | 267 | 465 |
26 | 682 | 406 |
27 | 641 | 444 |
28 | 723 | 489 |
29 | 682 | 561 |
30 | 615 | 495 |
Total | 18627 | 11887 |
Mean ± S.D | 620.9 ± 181.55 | 396.23 ± 157.83 |
*S.D = Standard Deviation
3.4.1 Comparison of hair Ca level in controls with the schizophrenic patients.
Hair mean levels of Ca (Table 14), in schizophrenic patiens and controls are compared by graphical representation.
Table 15 : Comparison of mean hair concentrations of Zn, Mn and Ca level with the published value
Elements | Control (n=30) | Patient (n=30) | Published value |
Zinc | 217.1 | 171.6 | 174 ± 31.5 mg/g (Deantonlo et al., 1969) |
Manganese | 4.4 | 3.8 | 4.1 ±0.1 mg/g (Akyol et al., 1990) |
Calcium | 620.9 | 396.2333 | 522 ±160 mg/g (DeAntonlo et al., 1982) |
3.5 Hypothesis of the research work
In this experiment the sample size was 60 (30 for schizophrenic patients & 30 for control healthy volunteers). We tried to find out the co-relation between the levels of trace elements and schizophrenia. In this regard we determined the concentration of three different trace elements named zinc (Zn), Calcium (Ca) and manganese (Mn), present in hair sample.
Our null hypothesis (H0) is that the concentration of trace elements present in schizophrenic is equal to the trace elements concentration present in healthy volunteer hair. The alternative hypothesis (H1) is that the concentration of trace element present in schizophrenic disorder patients and the healthy volunteer would be significantly different. That is, at 5% level of significance, in independent sample T-test if P value is less than 0.05 then null hypotheses would be wrong or alternative hypothesis will be correct. On the other hand if P value is more than 0.05 then null hypothesis will be correct & alternative hypothesis will be wrong.
3.5.1 Hypothesis of Zinc (Zn)
H0 = the concentration of Zn in Schizophrenia patients & in Healthy volunteers is the same.
H1= the concentration of Zn in the Schizophrenia patients & in the Healthy volunteers is significantly different.
The null hypothesis states that there is no difference in the mean hair concentration of Zn between the two types of volunteers. The difference between means equals zero.
H0: µ1 – µ2 = 0
The alternative hypothesis states that there is a significant difference in the mean hair concentration of Zn between the two types of volunteers. It is a two-sided test.
H1:µ1 – µ2 ≠ 0
Significance level: We have used 0.05 as the significance level of confidence.
3.5.2 Hypothesis of Calcium (Ca)
H0 = the concentration of Ca in Schizophrenia patients & in Healthy volunteers is the same.
H1= the concentration of Ca in Schizophrenia patients & in Healthy volunteers is significantly different.
The null hypothesis states that there is no difference in the mean calcium concentration of Ca between the two types of volunteers. The difference between means equals zero..
H0:µ1 – µ2 = 0
The alternative hypothesis states that there is a significant difference in the mean hair concentration of Ca between the two types of volunteers. It is a two-sided test.
H1:µ1 – µ2 ≠ 0
Significance level: We have used 0.05 as the significance level of confidence.
3.5.3 Hypothesis of Manganese (Mn)
H0 = the concentration of Mn in Schizophrenia patients & in Healthy volunteers is the same.
H1= the concentration of Mn in Schizophrenia patients & in Healthy volunteers is significantly different.
The null hypothesis states that there is no difference in the mean hair concentration of Mn between the two types of volunteers. The difference between means equals zero.
H0:µ1 – µ2 = 0
The alternative hypothesis states that there is a significant difference in the mean hair concentration of Mn between the two types of volunteers. It is a two-sided test.
H1:µ1 – µ2 ≠ 0
Significance level: We have used 0.05 as the significance level of confidence.
To prove this hypothesis we performed independent samples T- test.
3.6 Sociodemographic data
30 male patients were diagnosed as having schizophrenic disorder who were certified by a psychiatrist and 30 eligible controls were interviewed and categorized in terms of education, monthly income, age, smoking habits and occupation such as service holder, laborer, and businessman or other (table: 16).
Table 16 : Socio-demographic data of schizophrenic patients (n = 30) and controls (n =30)
Patients | Control | |||||
Parameter | n | % | Mean+SD | n | % | Mean+SD |
| Education | ||||||
| Illiterate | 7 | 23.33 | 9 | 30 | ||
| Read only | 6 | 20 | 6 | 20 | ||
| Secondary | 4 | 13.33 | 2 | 6.67 | ||
| Higher secondary | 2 | 6.67 | 3 | 10 | ||
| Graduate and above | 11 | 36.67 | 10 | 33.33 | ||
| Occupation | ||||||
| Service | 12 | 40 | 7 | 23.33 | ||
| Business | 5 | 16.67 | 9 | 30 | ||
| Unemployed | 9 | 30 | 8 | 26.67 | ||
| Others | 4 | 13.33 | 6 | 20 | ||
| Monthly income in US $ | ||||||
| 0-60 (0-4000 tk) | 13 | 43.33 | 120±95 US $ (8083±6385 Tk) | 16 | 53.33 | 118±90 US $ (7950±6060 Tk) |
| 61-120 (4001-8000 tk) | 12 | 40 | 8 | 26.67 | ||
| 120-180 (8001-12000 tk) | 2 | 6.67 | 2 | 6.67 | ||
| 181-240 (12001-16000 tk) | 2 | 6.67 | 1 | 3.33 | ||
| 241-300 (16001-20000 tk) | 1 | 3.33 | 3 | 10 | ||
| Age in years | ||||||
| 20-27 | 6 | 20 | 32±7 | 8 | 26.67 | 31±7 |
| 28-35 | 17 | 56.67 | 15 | 50 | ||
| 36-43 | 4 | 13.33 | 4 | 13.33 | ||
| 44-51 | 2 | 6.67 | 2 | 6.67 | ||
| 52-59 | 1 | 3.33 | 1 | 3.33 | ||
Patients | Control | |||||
Parameter | n | % | Mean+SD | n | % | Mean+SD |
| Marital status | ||||||
| Married | 19 | 63.33 | 20 | 66.67 | ||
| Unmarried | 11 | 36.67 | 10 | 33.33 | ||
| Divorced | 14 | 65 | 1 | 5 | ||
| Area of Residence | ||||||
| Urban | 22 | 73 | 15 | 50 | ||
| Rural | 8 | 17 | 15 | 50 | ||
| Smoking Habit | ||||||
| Non smoker | 10 | 33.33 | 18 | 60 | ||
| Smoker | 20 | 66.67 | 12 | 40 | ||
| No of cigarette/ day | ||||||
1-5 | 4 | 20 | 11.95±5.08* | 7 | 58.33 | 4.24± 5.3* |
6-10 | 5 | 25 | 2 | 28.57 | ||
11-15 | 8 | 40 | 2 | 16.67 | ||
16-20 | 3 | 15 | 1 | 8.33 | ||
* p < 0.05 (Significant change in the frequency of smoking between schizophrenic patients with controls).
3.7 Biophysical characteristics (height and weight) and body mass index (BMI) :
To analyze the differences in biophysical characteristics (height and weight) and BMI between Schizophrenic patients and control, results are tabulated in table 17.
Table 17: Height, weight and BMI of Schizophrenic patients and control
Patients (n= 30) | Control (n= 30) | p- value | |||||
Parameter | n | % | Mean+SD | n | % | Mean+SD | |
Height (m) | |||||||
| 1.52-1.58 | 1 | 6.67 | 166.8± 5.8627 | 1 | 3.33 | 166.566± 5.1305 | 0.807 |
| 1.59-1.65 | 10 | 33.33 | 11 | 36.67 | |||
| 1.66-1.72 | 14 | 46.67 | 14 | 46.67 | |||
| 1.73-1.79 | 4 | 13.33 | 4 | 13.33 | |||
Weight (Kg) | |||||||
| 35-45 | 2 | 6.67 | 54.6± 6.673 | 0 | 0 | 67.433± 4.148 | 0.001 |
| 46-56 | 13 | 43.33 | 1 | 3.33 | |||
| 57-67 | 14 | 46.67 | 26 | 86.67 | |||
| 68-78 | 1 | 3.33 | 3 | 10 | |||
BMI (Kg/m2 ) | |||||||
Below 18.5 | 15 | 50 | 56.53 ± 10.39 | 2 | 6.67 | 61.63± 5.45 | 0.009 |
18.5 – 25 | 14 | 46.67 | 26 | 86.67 | |||
25 above | 1 | 3.33 | 2 | 6.67 | |||
3.8 Statistical analysis
To analyze the differences of Zn, Mn and Ca level in scalp hair between schizophrenic patients (n = 30) and controls (n = 30), independent samples T- test are performed (table 18, 19 & 20 respectively) and finally the results are tabulated in table.
3.9 T-test result for hair Zn, Mn and Ca
Table 18 : Independent Samples T-test hair Zn
| Levene’s Test for Equality of Variances | T-test for Equality of Means | |||||||||
| F | Sig. | t | df | Sig. (2-tailed) | Mean Difference | Std. Error Difference | 95% Confidence Interval of the Difference | |||
P- value | Lower | Upper | ||||||||
Zn | Equal variances assumed | .019 | .892 | 2.550 | 58 | .013 | 45.50000 | 17.84067 | 9.78802 | 81.21198 |
| Equal variances not assumed | 2.550 | 54.062 | .014 | 45.50000 | 17.84067 | 9.73255 | 81.26745 | |||
Table 19 : Independent Samples T- test hair Mn
| Levene’s Test for Equality of Variances | T-test for Equality of Means | |||||||||
| F | Sig. | t | df | Sig. (2-tailed) | Mean Difference | Std. Error Difference | 95% Confidence Interval of the Difference | |||
P – value | Lower | Upper | ||||||||
Mn | Equal variances assumed | .444 | .508 | 1.002 | 58 | .321 | .60000 | .59885 | -.59873 | 1.79873 |
| Equal variances not assumed | 1.002 | 57.997 | .321 | .60000 | .59885 | -.59873 | 1.79873 | |||
Table 20: Independent Samples T- test for hair Ca
Levene’s Test for Equality of Variances | T-test for Equality of Means | |||||||||
F | Sig. | t | df | Sig. (2-tailed) | Mean Difference | Std. Error Difference | 95% Confidence Interval of the Difference | |||
P- value | Lower | Upper | ||||||||
Ca | Equal variances assumed | .067 | .797 | 5.115 | 58 | .000 | 224.66667 | 43.92127 | 136.74869 | 312.5847 |
| Equal variances not assumed | 5.115 | 56.898 | .000 | 224.66667 | 43.92127 | 136.71243 | 312.6209 | |||
Table: 21 P – values for the independent sample T – test of Trace Metals.
Trace Elements | P – Values |
Zinc (Zn) | p = 0.013 |
Manganese (Mn) | p = 0.321 |
Calcium (Ca) | p = 0.000 |
3.10 Correlation of Body Mass Index (BMI) on Zn, Mn and Ca level of schizophrenic patients (n= 30)
To find out any correlation of BMI with the trace elements concentrations of the patients, firstly Independent Sample T-test (table 22) is performed and then Pearson’s correlation analysis was performed ( table 22). Finally a multiple regression analysis
( table 23) and one-way analysis of variance (ANOVA) were also performed( table 24) to determine the extent of involvement of BMI that affect the level of trace elements.
Table 22: Independent Sample T-test for BMI
| Levene’s Test for Equality of Variances | T-test for Equality of Means | |||||||||
| F | Sig. | t | df | Sig. (2-tailed) | Mean Difference | Std. Error Difference | 95% Confidence Interval of the Difference | |||
P – value | Lower | Upper | ||||||||
| BMI | Equal variances assumed | 1.783 | .187 | 2.724 | 58 | .009 | 1.84167 | .67615 | .48822 | 3.19512 |
| Equal variances not assumed | 2.724 | 47.761 | .009 | 1.84167 | .67615 | .48201 | 3.20132 | |||
Table 23: Correlative analysis of Zn, Mn and Ca level in scalp hair of Schizophrenic patients with their BMI.
| P_Zn | P_Mn | P_Ca | P_BMI | ||
P_Zn
| Pearson Correlation | 1 | -.339 | .091 | .179 |
| Sig. (2-tailed) | . | .067 | .632 | .344 | |
| N | 30 | 30 | 30 | 30 | |
P_Mn
| Pearson Correlation | -.339 | 1 | -.350 | -.299 |
| Sig. (2-tailed) | .067 | . | .058 | .109 | |
| N | 30 | 30 | 30 | 30 | |
P_Ca
| Pearson Correlation | .091 | -.350 | 1 | .597(**) |
| Sig. (2-tailed) | .632 | .058 | . | .000 | |
| N | 30 | 30 | 30 | 30 | |
P_BMI
| Pearson Correlation | .179 | -.299 | .597(**) | 1 |
| Sig. (2-tailed) | .344 | .109 | .000 | . | |
| N | 30 | 30 | 30 | 30 |
** Correlation is significant at the 0.01 level (2-tailed).
- P_Zn = Patient,s Zn level
- P_Mn = Patient,s Mn level
- P_Ca = Patient,s Ca level
- P_BMI = Patient,s body mass index.
Table 24: Regression analysis of Zn, Mn and Ca level in scalp hair of Schizophrenic patients with their BMI.
Model |
| Unstandardized Coefficients | Standardized Coefficients | t | Sig. | |
| B | Std. Error | Beta | ||||
| 1 | (Constant) | 15.307 | 2.637 | 5.806 | .000 | |
| P_Zn | .006 | .009 | .105 | .640 | .528 | |
| P_Mn | -.090 | .240 | -.066 | -.374 | .711 | |
| P_Ca | .011 | .003 | .565 | 3.411 | .002 | |
a Dependent Variable: P_BMI
R2 = 0.376
- P_Zn = Patient,s Zn level
- P_Mn = Patient,s Mn level
- P_Ca = Patient,s Zn level
Table 25: Analysis of Variance (ANOVA) of Zn, Mn and Ca level in scalp hair of Schizophrenic patients with their BMI.
| Model | Sum of Squares | df | Mean Square | F | Sig. | |
| 1 | Regression | 109.251 | 3 | 36.417 | 5.211 | .006(a) |
| Residual | 181.696 | 26 | 6.988 | |||
| Total | 290.947 | 29 |
a Predictors: (Constant), P_Ca, P_Zn, P_Mn
b Dependent Variable: P_BMI
3.11 Discussion
From socio-demographic data (Table: 16), it was found that out of 30 schizophrenia patients, 23.33% (n = 7) were illiterate, 20% (n = 6) can read only,13.33% (n = 4) were secondary educated, 6.67% (n = 2) were higher secondary educated and the rest were graduates and above (36.67%, n = 11) (Table: 16). Among the patients, 30% (n = 9) were unemployed, 16.67% (n=5) were business man and 13.33% (n = 4) were in miscellaneous. 43.33% (n = 13) of the patients had monthly income of US $ 0-60, 40% (n = 12) had US $ 61-100, 6.67% (n = 2) had US $ 120-180, 6.67% (n = 2) had US $ 181-240 and 3.33.% (n = 1) of the patients had monthly income of US $ 241-300 or above ( 1US $= 67 tk.). 20% ( n = 6) were in age between 20 – 27 yrs , 56.67% ( n = 16) were in between 28 – 35 yrs , 13.33% ( n =4) were in between 36 – 43 yrs, 6.67% (n = 2) were in between 44 – 51 yrs and 3.33% ( n = 1) were in between 52- 59 yrs. We had also found that, 36.67% (n = 11) were unmarried and 63.33% (n=19) of the patients were married and 65% (n = 14) of them were divorced. (Table: 16).
It was also observed that, among the patients , 66.67% (n = 20) were habituated with smoking. Among them 20% (n = 4) smoke 1-5sticks/day, 25% (n=5) smoke 6-10 sticks/day, 40% (n = 8) smokes 11-15 sticks/day and 15% (n = 3) smokes 16-20 sticks/day but 33.33% (n = 10) were found non smokers (Table: 16). A significant differences were found in smoking tendency as well as fequency (sticks/day) of smoking (P= 0.000) ( Table 16).
Analysis of socioeconomic information showed that schizophrenic disorder was prevalent in poor, middle aged , divorced people and people live in urban areas which is in good match with previous findings (Kohn 1972, Kebede et al., 2003., Sundquist et al., 2004 and Chien et al., 2004) .
After collecting all the data we have done independent samples t- test by SPSS software, (version 12). In this experiment first we have done the run test (by SPSS software, version 12) to justify that the collecting data were random or not. In case of run test we have found most of the P-values are smaller than 0.05 (Table: 21).
By performing the independent samples T- test analysis, (SPSS software, version 12) it was observed that the level of Zn in scalp hair samples of schizophrenic patients were found to be decreased (171.6 ± 59.04) significantly (P = 0.013) when compared with the controls level (217.1 ± 77.86) (Table 18).
On the other hand the concentration of Mn in scalp hair samples of schizophrenic patients was not be significantly different (Table:19). Finally, we compared the concentration of Ca in scalp hair samples healthy volunteers (620.9 ± 181.55) with that of schizophrenic patients (396.23 ± 157.83). After performing the independent samples T- test analysis, we have observed that the P- value for Ca is 0.000.(Table: 20). As p- value is less than 0.05, calcium concentration level in healthy volunteers & schizophrenia patients will be significantly different (Table: 20).
Moreover if F value is very high and the significance level is very low, usually lower than 0.05 or 0.01, then assumption of homogenecity of variance has been violated. No such situation have been found from our result. (Table 18,19 and 20). So we asume that homogenecity of variance has not been violated .
An independent sample T-test (Table :22) of Body Mass Index (BMI) of healthy controls and schizophrenic patients were also performed. The data depicted that BMI of schizophrenic patients’ was significantly lower than that of healthy volunteers (p = 0.009) .This change of BMI in patient group may be due to their socioeconomic classes or schizophrenic disorder. Correlative analysis was also performed using the data of trace elements concentration in scalp hair and BMI of schizophrenic disorder patients. It was found that only the Ca concentration of scalp hair was significantly correlated (positively ) with BMI of schizophrenic disorder patients (r = 0.597, p = 0.000) ( Table 23). Regression analysis was also carried out using hair Ca concentration of patients’ as independent variable and BMI as dependent variable. Regression analysis depicted that the concentration of Ca changed significantly with BMI (R2 =0.376; t = 3.411; p = 0.002) (Table: 24). Finally, an ANOVA was done with the same parameters that showed a significant relationship between BMI and hair Ca concentration of the patients (F = 5.211; p = 0.006) (Table: 25).
So, it may be concluded that the Zn and Ca concentration in scalp hair of control and schizophrenic patient is changed when compared with the controls and also a significant relationship between BMI and Ca level of schizophrenic patients have been observed .