Community Analysis of Escherichia coli and Shigella species in the Freshwater Environment of Bangladesh by PCR-DGGE
1.1 Introduction
Only about 6 years ago, the knowledge of bacteria that naturally occur in freshwater ecosystems was restricted to organisms that could be grown in culture. However, it was known that about 98% bacteria in the environment could not be cultured. Recently, several studies have examined bacterial community composition in the epilimnion of freshwater lakes and reservoirs. The major bacterial phyla represented in most or all freshwater sites are the Proteobacteria (alpha, beta and gamma subdivisions), the Cytophaga-Flavobacterium-Bacteroides (CFB) group, the Actinobacteria, the Cyanobacteria and the Verrucomicrobia (Zwart et al., 2002).
About 400 children below the age 5 die per hour in the developing world from waterborne diarrheal diseases (Gadgil, 1998). Pathogenic E. coli and Shigella species are two most important water-related pathogens (Egli et al., 2002). World Health Organization (WHO, 2001) has categorized the diseases caused by Shigella and Enterohemorrhagic E. coli (EHEC) as priority waterborne disease.
Shigellosis is endemic throughout the world, but 99% of the 150 million annual cases and almost all of the million deaths occur in the developing world (Kotloff et al., 1999). Pathogenic E. coli strains are a major cause of infant diarrhea in developing countries, particularly in the 0- to 6-month age group.
There is evidence that Escherichia coli will survive indefinitely in tropical waters and may even multiply (Carillo et al., 1985). However, identification of Shigella in environmental samples is limited mainly by the lack of a suitable enrichment technique (Faruque et al., 2002). Although contaminated water is a major causative agent for shigellosis, until now there is little or no credible report on isolation of Shigella from aquatic environment and its reproducibility. Probably, the shigellae are fragile or might remain in a state of dormancy or might be starved, injured or stressed. In water, there may be lack of appropriate nutrients or growth factors inculding the physiological factors that may not be favourable for cell resuscitation or repair and hence recovery. The recovery and detection of these Shigella spp. becomes difficult employing conventional cultural techniques followed by molecular analysis.
This has implied the importance of the community structure analysis of E. coli and Shigella species. This type of analysis helps to determine the interactive members in the habitat which are always present with these bacteria. Identification of such stable community may be helpful to detect the presence of such bacteria that resist cultivation, which is an essential prerequisite for characterization in the laboratory. Community structure analysis of E. coli and Shigella species may be also helpful to observe the recovery capacity of pre-enrichment and enrichment techniques used to recover specially these bacteria.
The nucleic acid sequence comparisons are fundamental and straightforward way to classify and relate organisms now a day. A number of methods have been developed that exploit the sequence divergence among taxa to examine microbial community structure. These culture-independent methods for microbial community analysis most often utilize polymerase chain reactions (PCR) to amplify phylogenetic markers such as highly variable V3 region of the bacterial 16S rDNA gene in DNA extracted from the microbial community (Wilson et al., 1997).
Denaturing gradient gel electrophoresis (DGGE) is one of such methods that are commonly used. With DGGE many samples can be analyzed and it has the ability to tailor the analysis to examine particular organisms or taxa of interest through the use of universal or group-specific primers. PCR can also be used to identify the presence of pathogens by detecting specific virulent genes.
1.2 Literature Review
1.2.1 Microbial communities
The community is the highest biological unit in an ecological hierarchy made up of individuals and populations (Figure 1.1). Populations within a community interact with each other in an integrated manner. They do so at a physical location called a habitat. Some microorganisms are autochthonous or indigenous within a given habitat, which are capable of survival, growth, and metabolic activity in that habitat. In contrast, allochthonous microorganisms are transient members of their habitat (Atlas and Bartha, 1998).
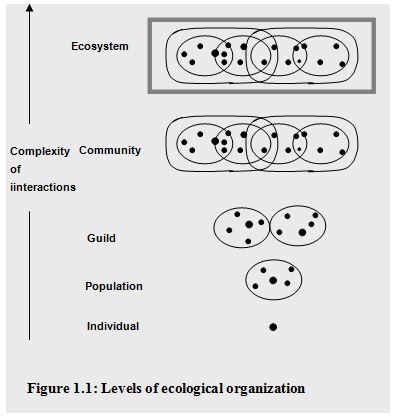
The habitat is one component of a broader concept known as the ecological niche, which includes not only where an organism lives but also what it does there; the niche is the functional role of an organism within an ecosystem. The niches within a community are filled by the indigenous populations of that community. Microbial populations exhibit various adaptations for success in diverse communities. These adaptations as well as population interactions contribute to the stability of communities. Stable microbial communities tend to have high diversities. Populations within a community that use the same resources (the guild structure of the community) often exhibit intense competition. In some cases the first organisms to arrive and colonize an area having a selective advantage and can retain a niche in the community against competitors. In other cases there is a succession of populations, with better adapted populations displacing those originally occupying a niche.
The species assemblage that successfully inhabits a delineated volume of resources is called a unit community. Populations in a unit community tend to interact with each other and not with populations in other unit communities (Swift, 1984).
1.2.2 Diversity and stability of microbial communities
Traditionally, the unit of diversity is the species, and a variety of definitions for the concept are used for these organisms. First, the “phylophenetic” definition circumscribes the species as a “monophyletic and genomically coherent cluster of individual organisms that show a high degree of overall similarity in many independent characteristics, and is diagnosable by a discriminative phenotypic property”. Second, a species can be defined as an assemblage of strains sharing 70% or more DNA homology. Third, in an ecological definition the species and niche concept are linked, and thus a species consists of the organisms occupying the same niche. Thus, diversity can be defined as the number of prokaryotic species and their relative abundance in a community, or as the amount and distribution of information in a community (Torsvik et al., 2002).
1.2.2.1 Dynamics and Control of Prokaryotic Diversity
Trophic interactions: Among prokaryotes, competitors can coexist if some mechanism of selective loss is operating to prevent the most successful competitors from sequestering all the resources. For example, parasitism by host-specific viruses will allow coexistence of different bacterial taxa within the bacterial community.
Evolutionary perspective: The ecological factors and the intrinsic evolutionary mechanisms working at molecular and population levels interact to control prokaryote diversity. Microbial diversity in soil ecosystems exceeds, by far, that of eukaryotic organisms. One gram of soil may harbor up to 10 billion microorganisms of possibly thousands of different species (Torsvik and Øvreås, 2002). One reason for the high genomic diversity observed in prokaryotic communities in soil and sediments is the large populations of organisms and the capacity to accumulate large numbers of mutations.
Temporal heterogeneity: Most terrestrial communities intermittently suffer disturbances, such as starvation, desiccation, freezing/thawing, or human activity. Altered environmental conditions and resource availability create opportunities for new species to become established, and disturbances will ensure that communities include a mixture of different stages of succession.
Spatial heterogeneity: The structural complexity of habitats is important for population-level diversification because it allows resources to be partitioned and creates new niches, thereby enhancing prokaryote specialization and division into distinct ecological species (Torsvik et al., 2002).
1.2.3 Freshwater microbial communities
Freshwater habitats
Freshwater habitats are classified based on their chemical and physical properties. Those with standing water, such as lakes and ponds, are called lentic habitats; those with running water are lotic habitats (Wetzel 1975).
Lakes: Lakes are divided into three zones based on the penetration of light (Figure 1.2). The combined littoral and limnetic zones are known as the euphotic zone; here photosynthetic activity can occur. The profundal zone is the area of deeper water beyond the depth of effective light penetration; it does not exist in shallow ponds. In deep lakes the profundal zone extends from the light compensation level to the bottom (Atlas and Bartha, 1998).
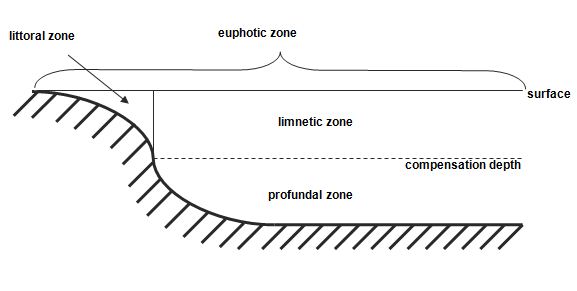
Figure 1.2: Zonation of lake habitat based on light penetration
On the basis of temperature lakes can be divided into three zones (Figure 1.3). The epilimnion is the upper warm zone of water which is separated from the cold deep hypolimnion by the thermocline. The thermocline is a zone characterized by rapid decrease in temperature, across which there is little mixing of water.
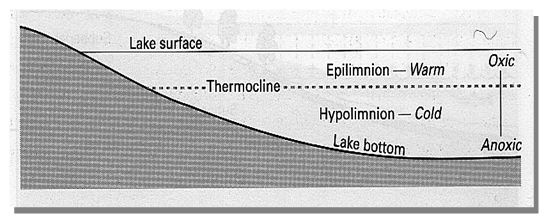
Figure 1.3: Zonation of lake habitat based on temperature
An ecologically useful classification of lake habitats as oligotrophic or eutrophic is based on productivity and nutrient concentrations. Oligotrophic lakes have low concentrations of nutrients. Typically, they are deep, have a large hypolimnion than epilimnion, and have relatively low primary productivity. In contrast, eutrophic lakes have high nutrient concentrations, are usually shallower and warmer than oligotrophic lakes, and have higher rates of primary production (Atlas and Bartha, 1998)
1.2.4 Composition and activity of freshwater microbial communities
Bacterioplankton communities are integrally involved in the biogeochemical processes underpinning freshwater ecosystems (Newton et al., 2006). The principal ecological functions of microorganisms in freshwater environments can be summarized as follows: (1) they decompose dead organic matter; liberating mineral nutrients for primary production (2) they assimilate and reintroduce into the food web dissolved organic matter (3) they perform mineral cycling activities (4) they contribute to primary production (5) they serve as a food source for grazers (Atlas and Bartha, 1998).
1.2.4.1 Community composition determined by cultural techniques
The microbial populations of lakes have been much more extensively studied than those of rivers. Members of the genera Achromobacter, Flavobacterium, Brevibacterium, Micrococcus, Bacillus, Pseudomonas, Nocardia, Streptomyces, Micromonospora, Cytophaga, Spirillum, and Vibrio are reported as occurring widely in lake water. Stalked bacteria, such as Caulobacter, Hyphomicrobium, and other genera, are associated many with submerged surfaces (Rheinheimer, 1991).
Autotrophic bacteria are autochthonous member of the microbiota of lakes and play an important role in nutrient cycling. Photoautotrophic bacteria normally found in lakes include cyanobacteria and in anoxic zones the purple and green anaerobic photosynthetic bacteria. The cyanobacteria Microcystis, Anabaena, and Aphanizomenon can be dominant plankton in freshwater habitats. Chemolithotrophic bacteria have important roles in nitrogen, sulfur and iron cycling within lakes; members of the genera Nitrosomonas, Nitrobacter, and Thiobacillus are essential members of freshwater microbial communities.
In addition to autochthonous microbial populations, many allochthonous terrestrial microorganisms are carried by erosion and runoff from soils into freshwater aquatic ecosystems. Allochthonous microorganisms also enter when leaves from adjacent plants fall into these water bodies and when municipal sewage enters freshwater environments together with high amounts of organic matter. Heterotrophic microbial populations in areas that receive high amounts of organic matter are generally elevated, but as the amounts of imported organic matter decrease, populations of heterotrophic microorganisms also decline (Atlas and Bartha, 1998).
1.2.4.2 Community Composition determined by molecular techniques
Only about 6 years ago, our knowledge of bacteria that naturally occur in freshwater ecosystems was restricted to organisms that could be grown in culture. However, it was known that most bacteria in the environment could not be cultivated. In fact, on the basis of cultural techniques Rheinheimer (1991) concluded that bacteria found in groundwater, spring water and streams also occur in soils, and that there was no clear separation between soil bacteria and aquatic bacteria. These observations call into question the existence of a unique freshwater bacterial flora.
Recently, several studies have examined bacterial community composition in the epilimnion of freshwater lakes and reservoirs. As a result of these studies, a core group of bacterial phylotypes common to freshwater has emerged. The major bacterial divisions represented most or all freshwater sites are the Proteobacteria (alpha, beta and gamma subdivisions), the Cytophaga-Flavobacterium-Bacteroides (CFB) group, the Actinobacteria, the Cyanobacteria and the Verrucomicrobia (Zwart et al., 2002).
Another study identified representatives of six bacterial phyla e.g. Actinobacteria, Bacteroidetes, Firmicutes, Proteobacteria, TM7 and Verrucomicrobia, including members of the classes Alpha-, Beta-, Delta and Gammaproteobacteria, as well as phylotypes with unknown affiliation in a freshwater site (Newton et al., 2006).
1.2.5 Sources of variation in bacterial community composition
There is tremendous variability in the composition of communities of bacterioplankton among lakes. A number of important parameters make lakes more or less suitable habitats for microorganisms. Examination of these factors that regulating not only the microbial community dynamics, but the dynamics of individual members of that community will lead to an increased understanding of potential freshwater microbial-mediated processes linked to specific organisms (Newton et al., 2006).
Geographic sources of variation: Regionalization has important influence on bacterial community composition (Lindström and Leskinen, 2002). There are several factors that could account for these regionalized effects including geology, climate and vegetation, land use and land cover, and anthropogenic impacts on lakes.
Environmental sources of variation: Two principal ecological forces, one related to lake primary productivity and one related to dissolved organic carbon (DOC) (Yannarell and Triplett, 2004) were significantly related to variation in bacterial community composition. Additionally, concentrations of inorganic nutrients, pH, salt concentrations, water clarity and concentrations of oxygen also have important impact on bacterial community composition.
Temporal variation: Lake bacterial communities show considerable variation in time and exhibit seasonal patterns. The temporal variation of bacterial community composition is controlled by a tight set of constraints. These constraints may include lower water temperatures; the presence or absence of large populations of grazers (i.e., the clear-water phase); the activity of primary producers; and the concentrations of limiting nutrients (Yannarell and Triplett, 2005).
1.2.6 Important waterborne pathogens: Escherichia coli and Shigella spp.
Diarrheal diseases are one of the major waterborne diseases in the developing countries. About 400 children below the age 5 die per hour in the developing world from waterborne diarrheal diseases. Waterborne infectious diseases are transmitted primarily through contamination of the water sources with excreta of humans and animals who are either active cases or carriers of the disease. Use of such water for drinking or cooking, contact with it during washing or bathing, or even inhalation of its fine droplets as aerosols, may then result in infection (Gadgil, 1998).
Pathogenic E. coli and Shigella species are two most important waterborne pathogens (Egli et al., 2002). World Health Organization (WHO, 2001) has categorized the diseases caused by Shigella and Enterohemorrhagic E. coli (EHEC) as priority waterborne disease.
1.2.7 Shigella species
Bacillary dysentery is an acute inflammatory bowel disease caused by an infectious agent, the enteroinvasive genus Shigella, hence the name shigellosis. Shigellosis is endemic throughout the world, but 99% of the 150 million annual cases and almost all of the million deaths occur in the developing world, particularly in areas where personal and general hygiene are inadequate and poor. Shigellosis is a disease of impoverished people which in about 70% of the cases affects children between the ages of 1 and 5 years (Kotloff et al., 1999).
Shigellosis occurs as an endemic disease in Bangladesh, and at least three large epidemics caused by Shigella dysenteriae type 1 have occurred between 1972 and 1994, causing high morbidity and mortality, particularly in children (Chen et al., 1980, Ronsmans et al., 1988 and Katz, 1986). There are four species of Shigella: S. dysenteriae, S. flexneri, S. sonnei and S. boydii (Hale, 1991).
1.2.7.1 Pathogenesis of bacillary dysentery
Shigella is a highly contagious microorganism since as few as 10-100 bacteria can cause the disease in adult volunteers. After oral contamination, bacteria pass through the stomach and the small intestine before reaching the colon where they invade the mucosa, initiating the acute destructive recto-colitis that causes the dysenteric symptoms: fever, intestinal cramps and emission of mucopurulent and bloody stools. The basis for organ specificity of shigellosis to the rectal and colonic mucosae is not understood. Shigella may express a colon-specific adhesive system, or the colonic and rectal mucosae may be more susceptible to developing acute inflammation in the presence of invasive shigellae. The disease remains essentially limited to the intestinal mucosa and septicemic dissemination is a rare event, except in malnourished children. The molecular and cellular effectors of innate immunity that eradicate the bacteria during the phase of primary infection and prevent systemic dissemination at the price of intestinal tissue destruction have yet to be fully identified and their mode of action characterized. Shigellosis can be seen as a loss of balance in the host mechanisms that regulate inflammation in the presence of an invading microorganism. A series of discoveries have recently allowed progress in the understanding of the molecular mechanisms by which Shigella disrupts, invades and destroys the intestinal barrier (Hale, 1998).
1.2.7.2 Determinants of pathogenesis expressed by Shigella
Plasmid genes: All virulent strains of Shigella carry a 220-kb plasmid which encodes the `invasive phenotype’ of this species. The coding sequences are scattered on the entire plasmid with one block of 30 kb showing a particularly dense pattern of genes, the ipa/mxi-spa locus that can be considered the central S. flexneri pathogenicity island (PAI). This PAI (Figure 1.4) is necessary and sufficient to cause entry of Shigella into epithelial cells and macrophage apoptotic death. Based on available data, one can consider that this PAI primarily encodes a type III secreton, in other words a flagella-like structure able to deliver Shigella proteins straight from the bacterial cytoplasm into the cytoplasmic membrane of epithelial cells, or into their cytoplasm.
At least five proteins encoded by the mxi operon assemble to form the secretory apparatus. There are about 20 candidate target proteins secreted through this secreton, upon contact of the bacterium with the epithelial cell surface. Five of them, IpaA-D and IpgD, are encoded by the 30-kb PAI. Others are encoded by genes scattered on the virulence plasmid (Sansonetti, 2001).
There are two categories of proteins secreted through the type III secreton:
1. IpaB, IpaC and IpaD are essential to the initial events of secretion. IpaB and IpaD form a complex which controls the flux of proteins through the type III secreton. IpaA and IpgD, like IpaB, C and D, are constitutively expressed at 37oC, regardless of the activity of the type III secreton. Deletion of their respective genes does not eliminate the entry capacity of the mutants, but induces significant attenuation, indicating that these genes have an effect on the maturation of the entry focus.
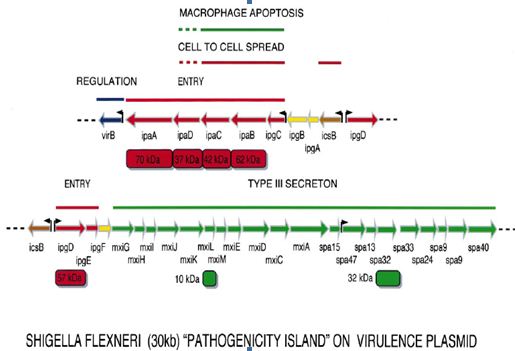
Figure 1.4: Map of the plasmid-located Shigella `pathogenicity island’ of 30 kb that is required for entry into epithelial cells and killing of macrophages
2. The second category of proteins encompasses two subgroups. These proteins, of still unidentified function, correspond to putative additional targets for the type III secreton, such as members of the IpaH family, SopB and VirA. Their genes are transcriptionally induced upon activation of the secreton. In any event, the type III secreton and its target proteins can now be regarded as the major weapon that Shigella uses to enter into epithelial cells and also to alter the function of others such as phagocytes.
Beside the type III secreton and its cognate target proteins, other important proteins are encoded by the virulence plasmid. Among these, SepA is a secreted serine protease whose function has not yet been established. The most important, however, is IcsA (VirG), which achieves the actin-based motility of Shigella and permits its passage from one cell to another. IcsA (VirG) is a 120-kDa surface protein which localizes at one pole of the bacterial body and is able to cause actin-dependent motility. IcsA mutants are severely impaired in pathogenicity, including in monkeys and even in human volunteers as recently tested (Sansonetti, 2001).
Chromosomal genes associated with virulence: Shigella is an interesting paradigm of co-evolution and mutual adaptation between plasmid and chromosomal virulence genes. Beside the core of virulence plasmid genes that dictate the direct interaction of bacteria with the various cell populations that make up the epithelial barrier, chromosomal genes also participate in the pathogenic process.
These chromosomal genes can be classified into two categories: (i) genes that regulate the expression of the virulence genes on the plasmid. This category is exemplified by virR, a gene encoding a histone-like molecule which controls the temperature-dependent expression of Ipa and Mxi-Spa proteins; (ii) genes that are important for bacterial survival in the intestinal tract and in infected tissues such as those encoding the LPS and siderophores, several of them being located on increasingly identified PAIs. In addition, in S. dysenteriae 1, shiga toxin (stx) is encoded by a chromosomal locus (Sansonetti, 2001).
1.2.8 Escherichia coli
Most strains of E. coli are harmless commensal members of intestinal flora of mammals and, to undetermined extent, birds in which some strains adhere to the intestinal mucosa while others are only temporary residents in the lumen of colon. Secondary habitats are soil, sediment and water (Savageau, 1983), where its density is proportional to the amount of fecal contamination. E. coli is an indicator organism used worldwide, thus the presence of E. coli in water is regarded as a warning signal: the water is subjected to potentially dangerous pollution. Three general clinical syndromes result from infection with inherently pathogenic E. coli strains: (i) urinary tract infection, (ii) sepsis/meningitis, and (iii) enteric/ diarrheal disease (Nataro and Kaper, 1998).
1.2.8.1 Common themes in E. coli virulence:
On the basis of virulence factors currently, at least six virotypes of E. coli have been identified: enterotoxigenic E. coli (ETEC), enteropathogenic E. coli (EPEC), enterohemorrhagic E. coli (EHEC), enteroaggregative E. coli (EAEC), enteroinvasive E. coli (EIEC), diffusely adherent E. coli (DAEC) (Salyers and Whitt, 2002). The characteristics that form the basis for the ‘virotyping’ system include patterns of bacterial attachment to host cells, effects of attachment on host cells, production of toxins and invasiveness. Like most mucosal pathogens, E. coli can be said to follow a requisite strategy of infection: (i) colonization of a mucosal site, (ii) evasion of host defenses, (iii) multiplication, and (iv)host damage(Nataro and Kaper, 1998). However, the interaction of the organisms with the intestinal mucosa is specific for each category. Schematized paradigms are illustrated in Figure 1.5.
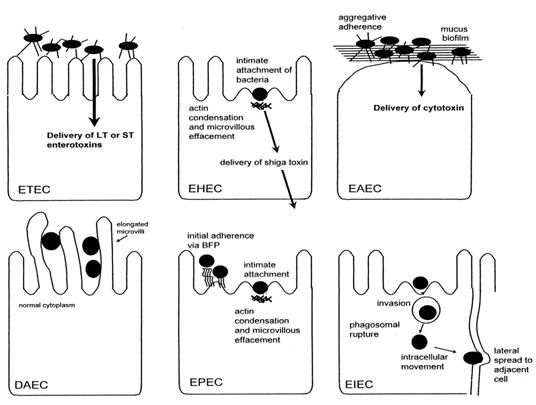
Figure 1.5: Pathogenic schemes of diarrheagenic E. coli. The six recognized categories of diarrheagenic E. coli each have unique features in their interaction with eukaryotic cells. Here, the interaction of each category with a typical target cell is schematically represented. It should be noted that these descriptions are largely the result of in vitro studies and may not completely reflect the phenomena occurring in infected humans.
1.2.8.2 The E. coli virotypes
Enterotoxigenic E. coli (ETEC) is catagorised as containing the E. coli strains that show at least one member of two defined groups of enterotoxins: ST and LT (Johnson et al., 1990). ETEC strains are associated with two major clinical syndromes: weanling diarrhea among children in the developing world, and travelers’ diarrhea. Epidemiologic investigations have implicated contaminated food and water as the most common vehicles for ETEC infection (Nataro and Kaper, 1998).
In contrast to the limited importance of enteropathogenic E. coli (EPEC) in developed countries, EPEC is a major cause of infant diarrhea in developing countries. Particularly in the 0- to 6-month age group, EPEC strains are often the most frequently isolated bacterial diarrheal pathogens. In 1992, Donnenberg and Kaper (Donnenberg and Kaper, 1992) proposed a threestage model of EPEC pathogenesis consisting of (i) localized adherence, (ii) signal transduction, and (iii) intimate adherence.
Enterohemorrhagic E. coli (EHEC) strains have only recently been recognized as a cause of serious disease. In the EHEC group of strains, there is one predominant serogroup and serotype (0157:H7) (Salyers and Whitt, 2002). Although EHEC strains cause dysentery similar to that caused by Shigella spp., they probably do not invade mucosal cells as readily as Shigella strains. A toxin produced by EHEC strains is virtually identical to shiga toxin, the major virulence factor, and a defining characteristic of EHEC, is Stx (Nataro and Kaper, 1998).
Enteroaggregative E. coli (EAggEC) strains, the newest virotype, cause a persistent form of diarrhea in children. EAggEC strains produce an ST-like toxin and a hemolysin-like toxin. EAEC has been implicated as a cause of sporadic diarrhea in Mexico, Chile, Bangladesh, and Iran (Brenner et al., 1973). Enteroinvasive E. coli (EIEC) strains are biochemically, genetically, and pathogenetically closely related to Shigella spp. EIEC strains are generally lysine decarboxylase negative, nonmotile, and lactose negative (Brenner et al., 1973). Endemic sporadic disease occurs in some areas, generally where Shigella spp. is also prevalent, but the epidemiologic features may be different from those of Shigella spp. (Nataro and Kaper, 1998).
Little is known about the pathogenetic features of diffusely adherent E. coli (DAEC) induced diarrhea. Bilge et al. (1989) have described the cloning and characterization of a surface fimbria in this strain, which mediates the DA phenotype. The genes encoding the fimbria can be found on either the bacterial chromosome or a plasmid. The association of DAEC with diarrhea is found only in children older than infants (Nataro and Kaper, 1998).
1.2.9 Community analysis by 16S ribosomal RNA genes
Nucleic acid sequencing technology is bringing a much-needed phylogenetic perspective into microbiology. There is no more fundamental and straightforward way to classify and relate organisms than by appropriate nucleic acid sequence comparisons. The simple morphology of most microbes provides few clues for their identification; physiological traits are often ambiguous. The microbial ecologist is particularly impeded by these constraints, since only 0.001 to 15% of the total cell counts in environmental samples can be cultivated (Amann et al., 1995).
The use of macromolecular comparisons to infer phylogenetic relationships is now well established. Comparisons may be based either on experimental measurements of “molecular similarity” (e.g. antibody cross reactivity, DNA-DNA hybridization, and ribosomal RNA-DNA hybridization) or on mathematical analyses of molecular sequence data. The former methods require the pairwise experimental comparison of most, or preferably all, organisms considered. In contrast, sequence data are readily accumulated, creating a “data base” that can be referred to for phylogenetic analysis of new sequence data as they become available (Olsen et al., 1986).
The rRNA molecules have long been recognized for their utility as molecular chronometers (Kent and Triplett, 2002). Characterization of unknown organisms by rRNA sequences requires a reference collection of sequences from known organisms. For the analysis of natural microbial populations, in which unknown diversity must be anticipated, there are several reasons to focus on the rRNAs as mentioned below
• The rRNAs, as key elements of the protein-synthesizing machinery, are functionally and evolutionarily homologous in all organisms.
• The rRNAs are ancient molecules and are extremely conserved in overall structure. Thus, the homologous rRNAs are readily identifiable, by their sizes.
• Nucleotide sequences are also conserved. Some sequence stretches are invariant across the primary kingdoms, while others vary. The conserved sequences and secondary structure elements allow the alignment of variable sequences so that only homologous nucleotides are employed in any phylogenetic analysis. The highly conserved regions also provide convenient hybridization targets for cloning the rRNA genes and for primer directed sequencing techniques.
• The rRNAs constitute a significant component of the cellular mass, and they are readily recovered from all types of organisms for accumulation of a data base of reference sequences.
• The rRNAs provide sufficient sequence information to permit statistically significant comparisons.
• The rRNA genes seem to lack artifacts of lateral transfer between contemporaneous organisms. Thus, relationships between rRNAs reflect evolutionary relationships of the organisms (Olsen et al., 1986).
There are three rRNAs in bacteria, 5S (~120 nucleotides), 16S (~1600 nucleotides), and 23S (~3000 nucleotides). The 16S rRNA is appropriate size for broad phylogenetic analysis, but it was too large for complete sequence determinations until the development of DNA cloning and sequencing protocols. Instead, the 16S rRNA was subjected to partial sequence analysis, so-called “oligonucleotide cataloging,” which characterizes ~25% of the sequence as unique RNase T1 oligonucleotides (Olsen et al., 1986).
1.2.10 Culture-independent methods of assessing microbial diversity
1.2.10.1 PCR-based methods
A number of methods have been developed that exploit the sequence divergence among taxa to examine microbial community structure. These culture-independent methods for microbial community analysis most often utilize polymerase chain reactions (PCR) to amplify phylogenetic markers in DNA extracted from the microbial community.
Community analyses based on PCR have a number of steps that may introduce biases, starting with DNA extraction. Bacterial cell structure varies among taxonomic groups, with some bacteria being more easily disrupted than others. In addition, environmental factors require special consideration for both sample collection and DNA extraction. PCR may be inhibited by the presence environmental compounds such as soil (Wilson et al., 1997).
Despite these problems, PCR-based community analysis methods are commonly used because of the ease with which many samples can be analyzed and the ability to tailor the analysis to examine particular organisms or taxa of interest through the use of universal or group-specific primers. A number of community “fingerprint” methods are commonly used to assess differences in community composition between samples or treatments or to assess changes in microbial communities over time. Such techniques as ribosomal intergenic spacer analysis (RISA), denaturing gradient gel electrophoresis (DGGE), temperature gradient gel electrophoresis (TGGE), single-strand-conformation polymorphism (SSCP), ITS-restriction fragment length polymorphism (ITS-RFLP), random amplified polymorphic DNA (RAPD), or amplified ribosomal DNA restriction analysis (ARDRA) yield complex community profiles that do not directly offer phylogenetic information but do allow analysis and comparisons of community composition. Differences in electrophoretic profiles between samples reflect differences in community composition and abundance of individual microbial populations in a community. Although the fingerprint obtained from an environmental sample cannot reveal the taxonomic composition of a microbial community, phylogenetic information about particular community members may be obtained by isolation and sequence analysis of bands of interest.
While correlations between the distribution of PCR-amplified phylogenetic markers and species distribution have limitations owing to the presence of multiple rRNA operons in bacteria and PCR and cloning biases, molecular methods for community analysis can reveal the presence of microorganisms that remain intractable to traditional cultivation techniques (Kent and Triplett, 2002).
1.2.10.2 Denaturing Gradient Gel Electrophoresis (DGGE)
Originally DGGE was introduced into microbial ecology to determine the genetic diversity of complex mixtures of bacterial populations. DGGE of PCR-amplified DNA fragments can be used to: (i) study community complexity (ii) monitor population shifts (iii) analyze enrichment cultures and the isolation of bacteria (iv) detect sequence heterogeneities of 16S rRNA genes in single genomes (v) compare DNA extraction methods (vi) screen clone libraries (vii) determine PCR and cloning biases.
In DGGE DNA fragments of the same length but with different base-pair sequences can be separated. Separation in DGGE is based on the decreased electrophoretic mobility of a partially melted DNA molecule in polyacrylamide gels containing a linearly increasing gradient of DNA denaturants (a mixture of urea and formamide). Melting of the DNA fragments proceeds in discrete so-called melting domains: stretches of base pairs with an identical melting temperature. Once a melting domain reaches its melting temperature at a particular position in the denaturant gradient gel, a transition of helical to partially melted molecules occurs, and migration of the molecule will practically halt. Sequence variation within such domains causes their melting temperature to differ. Sequence variants of particular fragments will therefore stop migrating at different positions in the denaturing gradient and hence can be separated by DGGE.
Using this approach, 50% of the sequence variants can be detected in DNA fragments up to 500 bp. This percentage can be increased to nearly 100% by the attachment of a GC-rich sequence to the DNA fragment, which will then act as a high temperature melting domain. Attachment of the GC-clamp can be done by cloning or, if the polymerase chain reaction (PCR) is used to create DNA fragments, by the addition of a 40 bp or 50 bp GC-rich sequence to the 5′ end of one of the PCR primers (Muyzer et al., 2004).
1.3 Objectives of the study
1.3.1 General objective
Pathogenic E. coli and Shigella spp. are two most important water-related pathogens (Egli et al., 2002). There is evidence that Escherichia coli will survive indefinitely in tropical waters and may even multiply (Carillo et al., 1985) whereas data relating to Shigella isolation and survival is almost nil. The objectives of this investigation encompass the identification of the community structure of E. coli and Shigella species which may be helpful to detect the presence of such bacteria that resist cultivation particularly Shigella spp. from the aquatic environment.
1.3.2 Specific objectives
• Recovery of the environmentally stressed, injured and starved Shigella spp. and E. coli from freshwater environment. Extraction of total community DNA from raw water samples and also from enriched samples.
• PCR amplification of the highly variable V3 region of the bacterial 16S rRNA gene.
• DGGE analysis of the PCR products and sequence analysis of DGGE fragments to identify the bands.
• PCR assay for the amplification of lt1, st1, bfp, stx1, ipaH, ipaBCD, virA and ial genes specific for Shigella spp. and E. coli.
• Statistical analysis to correlate the occurrence of different phyla, genes and bacterial genera with one another.
• Identification of the community of E. coli and Shigella spp. by assessing the sequencing results of the DGGE bands, results of PCR assay for specific virulent genes and the outputs of statistical analysis.
2.0 Materials and Methods
This Chapter focuses on the novel methodology used to characterize the community structure of E. coli and Shigella species in freshwater environments on the basis of DGGE profiles, sequencing data and presence of different toxigenic and pathogenic genes.
2.1 Handling of laboratory apparatus and glassware
All glassware were washed in concentrated sulfuric acid (1M) containing potassium dichromate, rinsed 5-6 times in tap water and finally rinsed twice in distilled water. Glassware like petri plates were heat sterilized at 180˚C for 1h in hot air oven before use. Micropipette tips and filtration units were sterilized by autoclaving at 121˚C for 15 minutes.
2.2 Culture media
Pre-enrichment media: To recover the environmentally stressed, injured and starved Shigella species and E. coli from the environment, Alkaline Peptone Water (APW) was used in two strengths, 1.0× and 0.1× (Appendix-I). As Shigella species can tolerate high pH of up to 9.3 and high salt concentration of 5-6% (Smith et al, 1987) 1.0× APW with 5% NaCl and pH 9.0 was used specially for Shigella spp. and E. coli.
Enrichment Media: Enrichment was done with the addition of 600 µg of streptomycin antibiotic (Sigma, USA) solution within the above mentioned pre-enrichment media (50 mL) since Shigella species and E. coli are resistant to this antibiotic (Clesceri et al., 1998)
2.3 Sampling
2.3.1 Collection of water samples
Water samples were collected from various lakes, rivers and ponds of different places of Dhaka, Narayanganj, and Gafargaon. Seventy five samples were collected from these sites during the period between June, 2006 and February, 2007.
2.3.2 Sampling methodology and transportation
Water samples were collected in sterile sampling bottles and then carried to the laboratory in an insulated icebox. Microbiological analyses were carried out as soon as possible after collection to avoid unpredictable changes. In case of inadvertent delay samples were stored at 4ºC until use.
2.4 Total community DNA extraction from freshwater
2.4.1 Collection of bacterial cells from enriched samples
For each sample 100 mL water sample were filtered through a 0.45 µm filter and the filter was incubated in 50 mL of pre-enrichment media (0.1× and 1.0×). Then the flasks were incubated in a rotary shaker (Thermo Forma, USA) at 120 rpm at 37˚C for 3-4 h. After that enrichment was done for another 3-4 h, in the rotary shaker at the same temperature and time. Finally, bacterial cells were collected from the incubated enrichment media by centrifugation at 5000 rpm for 10 minutes and the supernatant was drained off.
2.4.2 Collection of bacterial cells from fresh samples
100 mL water sample were also filtered through a 0.45 µm filter and the filter was soaked in TE buffer (Appendix-II) for 3-4 h. Again bacterial cells were collected from the TE buffer by centrifugation at 5000 rpm for 10 minutes and the supernatant was drained off.
2.4.3 Extraction and purification of total community DNA
Three varieties of total community DNA were extracted for each of the seventy five samples. One kind was from the fresh sample and the other two from the two strengths (0.1× and 1.0×) of the enrichment media. In this study in total two hundred and twenty five DNA samples were collected.
2.4.3.1 Harvesting and lysis of bacterial cells
Total community DNA was extracted and purified by the method described by Sambrook, et al., (2001). Following this method the previously collected cell pellet was resuspended in 567 L of 10mM Tris-EDTA (TE) buffer. Then 30 L of 10% SDS and 5 L of proteinase K (20 mg /mL) were added and the samples were incubated at 50ºC for 60 minutes or until the solution became clear when placed in a water bath. Later 100 L of 5 M NaCl and 80 L of CTAB/NaCl solution was added, and it was then incubated at 65ºC for 10 min.
2.4.3.2 Phenol extraction of DNA
After proteinase K treatment, DNA was extracted with equal volume of TE-saturated phenol; for the second time extraction was done by using Phenol: Chloroform: Isoamylalcohol (25:24:1). In both the cases, after addition of phenol, tubes were mixed well until a milky white appearance was observed. The tubes were then centrifuged for 8-10 min at 14,000 rpm in a centrifuge (Sigma, USA). It created three phases, the top phase was DNA solution, middle was a solid phase consisted of cellular proteins and debris, and the lower phase was phenol. Using a 200 L pipette, the top phase was recovered very carefully and transferred into the fresh eppendorf tubes.
2.4.3.3 Ethanol precipitation
After phenol extraction, 1/10th volume of the 3M sodium acetate (pH 5.2) was added to the DNA solution and mixed well by flicking the tube several times. Double volume of ice cold 100% ethanol was added and mixed well by inverting the tubes, and placed in –70ºC freezer for 20 minutes. The fibres of the chromosomal DNA was then collected with a glass rod and washed with cold ethanol by inverting the tubes several times. DNA precipitate was collected by centrifugation and then dried in a desiccator under vacuum.
2.4.3.4 RNase treatment
Dried DNA was dissolved in 50 L of TE buffer followed by addition of 1 L of RNase (10 mg/mL) and incubated at 37ºC for 1 2 h. After incubation, purified DNA was obtained by phenol: chloroform: isoamylalcohol (25:24:1) extraction followed by ethanol precipitation. Finally purified DNA was dissolved in 40 L of TE buffer and stored in –20ºC until use.
2.4.3.5 Measurement of DNA concentration
Concentration of DNA was measured according to the procedure described by Maniatis et al. (1989). 10 L of purified DNA solution was mixed with 990 L of deionized water to make the final volume 1 mL. Optical density reading was taken at wavelength of 260 and 280 nm in a UV-Visible Spectrophotometer (HACH Model No. DR/4000U), using deionized water as blank. Concentration of double stranded DNA was calculated according to the following formula:
Concentration of dsDNA (g/mL) = OD reading (260 nm) dilution factor50 (an OD value 1 corresponds to approximately 50 g/mL of purified dsDNA (Maniatis et al., 1989).
The ratio between the readings at 260 nm and 280 nm (OD260 /0D280) provides an estimate of the purity of the DNA. Pure DNA preparations have OD260/OD280 values of 1.8 (Maniatis et al., 1989).
2.5 PCR amplification of 16S rDNA
From the two hundred and twenty five DNA samples, thirty five samples (Table 1) were chosen randomly to cover all the sampling sites and media designs for further analysis. PCR amplification of the highly variable V3 region of the bacterial 16S rDNA was carried out as described by Øvreås et al. (1997).
Table 2.1: The representative samples analyzed by PCR-DGGE
| Sampling site | Sampling Date | Sample code | DNA collected from |
| Mirpur | 05.06.06
| M1 | 0.1× Enrichment media |
| M2 | 1.0× Enrichment media | ||
| M3 | Fresh sample | ||
| 21.06.06 | M4 | 0.1× Enrichment media | |
| Narayangang | 07.08.06 | P1 | 0.1× Enrichment media |
| P2 | Fresh sample | ||
| 02.09.06
| P3 | 0.1× Enrichment media | |
| P4 | Fresh sample | ||
| Gulshan | 03.10.06 | G1 | 0.1× Enrichment media |
| 03.10.06 | G2 | Fresh sample | |
| 18.02.07 | G3 | 0.1× Enrichment media | |
| G4 | 0.1× Enrichment media | ||
| Ramna | 04.10.06 | R1 | 0.1× Enrichment media |
| R2 | 1.0× Enrichment media | ||
| 09.12.06 | R3 | 1.0× Enrichment media | |
| R5 | 1.0× Enrichment media | ||
| 28.01.07 | R6 | 0.1× Enrichment media | |
| R7 | 0.1× Enrichment media | ||
| R8 | Fresh sample | ||
| 05.02.07 | R9 | 1.0× Enrichment media | |
| R11 | 0.1× Enrichment media | ||
| Dhanmondi | 09.10.06 | D1 | 0.1× Enrichment media |
| D2 | 1.0× Enrichment media | ||
| D3 | 0.1× Enrichment media | ||
| D4 | 1.0× Enrichment media | ||
| D5 | Fresh sample | ||
| D6 | Fresh sample | ||
| 26.11.06 | D7 | 1.0× Enrichment media | |
| D9 | 0.1× Enrichment media | ||
| D10 | 0.1× Enrichment media | ||
| D11 | 0.1× Enrichment media | ||
| D12 | Fresh sample | ||
| Gafargaon | 19.12.06 | F1 | 1.0× Enrichment media |
| F2 | 0.1× Enrichment media | ||
| F3 | 1.0× Enrichment media |
PCR amplification was performed in a thermal cycler (MJ Research Inc. Watertown, USA) using universal bacterial primers L340GCF and K517R. The sequence of the L340GCF primer, which included a 40 base pair GC-clamp attached to the 5’ end, was 5’-CGCCCGCCGCGCGCGGCGGGCGGGGCGGGGGCACGGGGGGACT CCTACGGGAGGCAGCAG-3′, and the sequence of the K517R primer was 5′- ATTACCGCGGCTGCTGG -3′.
Amplification was done on a total volume of 50µL containing 1 µL of the undiluted template DNA, 25 mol of each of the primers, 200 µM of the deoxynucleoside triphosphate (dNTP) mix, 2.5 mM Mg2+, 1 unit of DNA polymerase and sterile water to make up for the balance in volume. The PCR program initiates with initial denaturation of template DNA at 94°C for 3 minutes, followed by 30 cycles of the following steps: denaturation at 94°C for 1 minute, annealing at 55°C for 30 seconds, and extension at 72°C for 1 minute. A single final extension was done at 72°C for 10 minutes. The PCR product was subjected to 2% agarose gel electrophoresis, stained with ethidium bromide and visualized on a UV transilluminator for the presence of about 200 bp PCR products.
2.6 Denaturing Gradient Gel Electrophoresis (DGGE)
To analyze the community structure of E. coli and Shigella species and to observe the recovery of these bacteria after pre-enrichment and enrichment, DGGE (Bio-Rad, USA) analysis of the PCR products was done followed by SYBR gold staining.
2.6.1 Preparation of gel solutions
Bacterial DGGE was done as described by Muyzer et al. (1993). For this analysis denaturant gradient of 30% to 55% was used for gel preparation.
Preparation of stock solutions
The following ingredients (Table 2.2) were mixed in a beaker and dissolved to prepare 0% and 100% denaturant solutions.
Table 2.2: Composition of stock solutions for DGGE
Ingredients | 0% denaturant | 100% denaturant |
40% Acrylamide/Bis (mL) | 15 | 15 |
50× TAE (mL) | 2 | 2 |
Formamide (mL) | 0 | 40 |
Urea (g) | 0 | 42 |
The volume was adjusted to 100 mL with Milli-Q water. The solutions were filtered with 0.22 µm filter units with vacuum pump. The filtrates were transferred to bottles and were degassed for 5 minutes. The bottles were then wrapped with aluminum foil and stored in a refrigerator.
2.6.2 Casting of the gel
The gel casting was done according to the instructions provided by Bio-Rad Company for its product D-code system. The following items were used for gel casting:
• High (55%) denaturant mix
100% denaturant 7.7 mL
0% denaturant 6.3 mL
• Low (30%) denaturant mix
100% denaturant 4.2 mL
0% denaturant 9.8 mL
• Gel loading dye
• 10% ammonium persulfate (APS)
• TEMED
• Gradient former set (30mL syringe, needle, tube, gradient former)
• Gel plate set (glass plates, spacers, sandwich clamps, plate assembler)
Procedure
The gel solutions were degassed for 5 minutes. The glass plates were cleaned with alcohol and one plate was wiped with Repel Saline so that the gel remains attached to one plate during staining. The gel sandwich was then assembled and the spacer was inserted between the plates to keep appropriate width. A gasket was placed in the gel stand and the sandwich was put on it. A needle with a Y fitting tube was inserted between the plates. The two syringes were connected to the tubes. Two Falcon tubes were prepared, one with high (55%) and one with low (30%) denaturant gel solution, and were then placed in ice. 120 µL of 10% APS and 16 µL of TEMED were added to both the high and low denaturant gel mix followed by gentle mixing. The gels were sucked by syringes and installed to the gradient former. Subsequently the tubes of the syringes were connected to the Y fitting tube attached to the needle. The wheel of the gradient former was rotated to pour the gel within the glass plates and a comb was then inserted. The tubes, needle and syringes were washed as soon as possible before the gel solidifies. Wet tissue were then put on the top of the gel plate and wrapped with polyethylene film to prevent drying. Finally, for complete polymerization, the gel was left for overnight.
2.6.3 Running of the gel
The buffer chamber was filled with 7L of 0.5× TAE. After placing the control module in the chamber, the switch was turned on. The temperature was set to 65oC. When the temperature reached the set temperature the power was turned off and the control module was removed. The gel sandwich was fixed to the inner core. In case of only one gel, plate sandwich without spacers was fixed on the other side. Warm buffer was poured on the upper buffer chamber to ensure no leakage of buffer. The inner core was then put back into the buffer tank. The wells were then washed with micropipette to blow off any gel particles and evaporated urea. Later 20 µL of samples was mixed with 4 µL 6× loading dye and was loaded into the wells. The control module was then placed back and the pump was turned on. Subsequently the electrodes were connected to power supply and the voltage was set at 60V. After the samples got in the gel the pump was turned on. Lastly, electrophoresis was continued for 14-16 h.
2.6.4 Staining and destaining of the gel
When the gel front reached the end of the gel, the pump and power was switched off. The gel chamber was removed from the buffer tank. The gel sandwich was freed from the clamps and one glass plate was removed leaving the gel on the other. SYBR Gold (1 µL) stock solution was added to 10 mL of 1× TAE and the staining solution was spread evenly on the gel. Incubation was done for 30 min in the dark. The stained DNA bands were observed on a UV transilluminator (Gel Doc, BioRad, USA). Photographs were taken using Gel Doc (BioRad, USA) machine attached to a computer and bands were analyzed with ‘Quantity One’ software (BioRad, USA).
2.7 Sequence analysis of DGGE fragments
2.7.1 Extraction of DNA from DGGE gels
To identify DGGE bands, a small piece of gel from the middle of the target band was excised from the gel using a sterile scalpel and was incubated in 50 µL sterile milli-Q purifed water for 24 h at 4oC. After this period the DNA was diffused out of the gel and the solution then used as template in a re-amplification PCR. Only pure bands were used for sequencing by amplifying with universal bacterial primers L340GCF and K517R.
2.7.2 DNA sequencing
There are three basic steps in DNA sequencing:
Purification of PCR products
Cycle sequencing
Purification of the cycle sequence product and detection of nucleotide sequence by ABI-prism 310 genetic analyzer, USA.
2.7.2.1 Purification of PCR products
For the purification of PCR product of probe DNA StrataPrep® PCR purification kit was used. The purification procedures were as follows: an equal volume of DNA binding solution was added to the PCR product of 16S rDNA and the components were mixed properly. The PCR product-DNA-binding-solution mixture was then transferred to a microspin cup that was seated in a 2-mL receptacle tube. The tube was then spun in a microcentrifuge for 30 seconds. The DNA-binding solution was discarded and 750 µL of 1 wash buffer was added to the microspin cup. The tube in a microcentrifuge was spun for 30 seconds and the buffer was discarded. After that the microspin cup was placed in the 2- mL receptacle tube and was spun for 30 seconds. The microspin cup was then placed in fresh 1.5-mL microcentrifuge tube and the 2-mL receptacle was discarded. 50 µL of elution buffer was added directly onto the fiber matrix at the bottom of the microspin cup. The tube was then incubated for 5 minutes at room temperature. Finally, the purified PCR product was collected by spinning the tube in a microcentrifuge for 30 seconds and microspin cup was then discarded.
2.7.2.2 Cycle sequencing
In cycle sequencing the ABI-prism Big dye terminator cycle sequencing ready reaction kit was used in which following reagents were premixed into a single tube of ready reaction mix:
Big dye terminators (dye terminators)
Deoxynucleotide triphosphates
AmpliTaq
DNA polymerase
MgCl2
Buffer
In this step only one strand of the desired DNA was amplified and the DNA fragments, of different length that had been terminated with different ddNTPs, were produced. The reaction mixture composition for cycle sequencing is shown in Table 2.3.
Table 2.3: Reaction mixture composition for cycle sequencing
Reagent
| Quantity (µL)
|
Terminator ready reaction mixes (Big dye) | 4.0 |
Template | 1.0 |
Primer (forward or reverse 3.2 pmol) | 1.0 |
Deionized water | 14.0 |
Total volume | 20 |
The PCR program initiated with initial denaturation of template DNA at 96°C for 1 minute, followed by 25 cycles of the following steps: denaturation at 96°C for 10 sec, annealing at 50°C for 30 sec, and extension at 60°C for 4 minute. A single final extension was done at 60°C for 1 minute.
2.7.2.3 Ethanol Precipitation of cycle sequenced product
Cycle sequenced products were purified by the ethanol precipitation method to remove the unincorporated dye. The purification procedures were as follows: 2.0 µL 3M Na-acetate (pH 4.6) and 50 µL 96% ethanol were added to each of the tubes containing cycle sequenced product. All the tubes were vortexed and left at room temperature for 30 mins to precipitate the extension products. Centrifugation was done at 13000 rpm for 20 mins. The supernatant was carefully aspirated with a pipette tips and discarded. 200 µL 70% ethanol was added to each of the tubes and vortexed briefly. Centrifugation was done at 14000 rpm for 10 minutes. The supernatant was carefully aspirated with a pipette tips and discarded. The tubes, with their caps opened, were wrapped with a piece of parafilm and left at room temperature for 1 hour for drying the pelletes. 16 µL (12-18 µL) template suppressor reagent (hi-diformamide) was added to each of the tubes containing the pellete. The whole content of each tube was transferred to sequencing tube which was placed in a thermal cycler at 95oC for 3 minutes for denaturation.
2.7.3 Detection of the nucleotide sequence
The purified cycle sequenced product was analyzed by electrophoresis in the ABI-prism 310 genetic analyzer (ABI Prism, USA). DNA was separated through the POP6 contained in a capillary and detected by laser beam. When the nucleotides reached a detector window in capillary electrophoresis, the laser beam excited the fluorescent-labeled fragments. The laser excites the fluorescent dye labels and emitted fluorescence was detected by CCD camera. The fluorescence intensity data was interpreted into sequence data by specific bioinformatics software.
2.7.4 Sequence Analysis
The chromatogram sequencing files were edited using Chromas 2.32 (Technelysium, Queensland, Australia). The homology of the 16S rDNA sequences was checked with the 16S rDNA sequences of other organisms that had already submitted to GenBank database using the BLASTN (Altschul et al., 1990; http://www.ncbi.nih.gov/BLAST/) algorithm. Sequences were assigned preliminary bacterial phylum associations based on the BLASTN and RDP-II Classifier programs (Cole et al., 2003; http://rdp.cme.msu.edu/classifier/classifier.jsp).
2.8 Detection of E. coli and Shigella species by Polymerase Chain Reaction (PCR)
DNA samples stored at -20oC were subjected to PCR assay for the amplification of lt1 and st1, bfp and stx1 genes specific for virulence properties of enterotoxigenic E. coli (ETEC), enteropathogenic E. coli (EPEC), and enterohemorrhagic E. coli (EHEC) respectively.
PCR was also carried out for ipaH, ipaBCD, virA and ial genes specific for Shigella and enteroinvasive E. coli (EIEC).
2.8.1 Primers used for each of the genes
Primers used for each of the genes are given as follow-
virA
Forward: 5’-CTG CAT TCT TGG CAA TCT CTT CAC ATC-3’
Reverse: 5’-TGA TGA GCT AAC TTC GTA AGC CCT CC-3’
ipaH
Forward: 5’-GCT GGA AAA ACT CAG TGC CT-3’;
Reverse: 5’-CCA GTC CGT AAA TTC ATT CT-3’
ipaBCD
Forward: 5’-GCT ATA GCA GTG ACA TGG-3’
Reverse: 5’-ACG AGT TCG AAG CAC TC-3’
ial
Forward: 5’-GGA GGC CAA CAA TTA TTT CC-3’
Reverse: 5’-CTG GAT GGT ATG GTG AGG-3’
lt1 Forward: 5’-CCG AAT TCT GTT ATA TAT GCT-3’
Reverse: 5’-GGC GAC AGA TTA TAC CGT GC-3’
st1 Forward: 5’-TTA ATA GCA CCC GGT ACA AGC AGG-3’
Reverse: 5’-CTT GAC TCT TCA AAA GAG AAA ATT AC-3’
bfp Forward: 5’-GCC GCT TTA TCC AAC CTG GTA-3’
Reverse: 5’-AAT GGT GCT TGC GCT TGC GCT TGC TGC-3’
stx1 Forward: 5’-CAA CAC TGG ATG ATC TCA G-3’
Reverse: 5’-CCC CCT CAA CTG CTA ATA-3’
2.8.2 PCR amplification
Amplification was performed in 30 µL reaction volumes for each specimen containing 2 µL (100ng/µL) of template DNA. The reaction volume was prepared by mixing the following reagents (master mix) with the template DNA (Table 2.4). The master mix was prepared in a micro-centrifuge tube. Low temperature was maintained throughout the whole procedure. After preparation, the master mix was mixed well by pipeting. A volume of 28 L from master mix was transferred to each of 0.2 L PCR tube and then corresponding DNA samples (2 µL) were added to each tube. The reaction mixture was mixed well and subjected to a short pulse to spin down the mixture. All of these tasks were done inside a PCR work station. The PCR tubes were then transferred to a DNA thermal cycler for amplification of DNA.
Table 2.4: Composition of PCR master mix
Reagents | Volume (mL) |
Sterile deionized water | 22.2 |
10× PCR buffer with Mg | 3.0 |
10 mM dNTP mixture (10 mM each of dATP, dCTP, dGTP, dTTP) | 0.6 |
Primer forward (10 mM each) | 1.00 |
Primer reverse (10 mM each) | 1.00 |
Taq DNA polymerase (5 U/mL) | 0.2 |
2.8.3 PCR Protocols for each of the genes
The PCR program was run for 35 cycles for each of the genes (Table 2.5).
Table 2.5: PCR programs for each of the genes
Gene | Step | Temperature (oC) | Time (min) |
virA | Denaturation Annealing Extension | 94 65 72 | 1.0 1.5 1.75 |
ipaH, ipaBCD and stx1 | Denaturation Annealing Extension | 94 55 72 | 1.5 1.5 1.5 |
ial | Denaturation Annealing Extension | 94 55 72 | 1.5 1.5 2.0 |
lt1 and st1 | Denaturation Annealing Extension | 94 55 72 | 1.0 2.0 1.5 |
bfp | Denaturation Annealing Extension | 94 56 72 | 1.0 1.5 1.5 |
2.8.4 Agarose gel electrophoresis of the PCR products
Electrophoresis (BioRad, USA) of the PCR products was done in 1.5% agarose gel to examine the amplified products. Agarose (SeaKem® LE Agarose, Norway) was dissolved in 1Tris acetate-EDTA (TAE) buffer and was heated to dissolve in a microwave oven for about 2.5-3 min. When the temperature came down to 50ºC, the gel was poured onto the gel tray (BioRad, USA) already fixed with appropriate combs. Following solidification of the gel, it was submerged in 1 TAE buffer in a gel running tank. 10 l PCR product was mixed with 3 l of 1 gel loading dye and loaded into the slots of the gel with the aid of a micropipette. Electrophoresis was continued with 60 volts until DNA fragments were separated. The gel was then stained in staining solution (10l EtBr in 100 mL TAE) for 15-30 min and destained in distilled water for 15 minutes. The EtBr stained DNA bands were observed on a UV transilluminator (Gel Doc, BioRad, USA). Photographs were taken using Gel Doc (BioRad, USA) machine attached to a computer and bands were analyzed with ‘Quantity One’ software (BioRad, USA).
2.9 Statistical analysis
SPSS was used to correlate the presence of different phyla, different genes and different bacterial genera with one another. Significant correlation was determined using significance value ‘p’. The ability of the enrichment media (1.0×) and diluted enrichment media (0.1×) to recover E. coli and Shigella spp. was also analyzed with SPSS. Presence of different phyla with respect to specific virulent genes was also analyzed.
3.0 Results
Microbial populations exhibit various adaptations for survival and activity in diverse communities. These adaptations as well as population interactions contribute to the stability of communities. Diarrheal diseases are one of the major waterborne diseases in the developing countries. Pathogenic E. coli and Shigella spp. are two most important waterborne pathogens (Egli et al., 2002). There is evidence that Escherichia coli will survive indefinitely in tropical waters and may even multiply (Carillo et al., 1985). However, identification of Shigella in environmental samples is limited mainly by the lack of a suitable enrichment technique (Faruque et al., 2002). Detection of a stable community of E. coli and Shigella spp. may be helpful to detect the presence of such bacteria that resist recovery by cultural means e.g. Shigella spp. In the present study PCR-DGGE approach combined with statistical analysis was used to identify the community of E. coli and Shigella spp. in the freshwater environment in Bangladesh.
3.1 Analysis of DGGE profiles
To profile community complexity PCR amplified 16S rDNA fragments were separated by DGGE. From the DGGE profiles (Figures 3.1 and 3.2), it is clear that there was a high variability between the bacterial assemblages although some bands are common to several water bodies (e.g. band 4, Figure 3.1).
The major DGGE bands were excised, sequenced and matched with the GenBank database (http://www.ncbi.nih.gov/BLAST). DGGE has some limitations (Muyzer and Smalla, 1998) such as the possible comigration of bands with different sequences. Thus, in order to confirm that matching bands corresponded to identical phylotypes, more than one band with equal position in the gel was excised and sequenced. The same nucleotide sequence was obtained for each band position (e.g. band 4, Figure 3.1). The alignments of the 16S rDNA sequences representing each of the identified genera are given in Appendix-IV.
Figure 3.1: DGGE gel containing the bacterial 16S rRNA gene fragments obtained after enzymatic amplification of DNA extracted from freshwater samples to assess the bacterial community. The code above each lane refers to each water sample (Table 2.1).
Figure 3.2: DGGE gel containing the bacterial 16S rRNA gene fragments obtained after enzymatic amplification of DNA extracted from freshwater samples to assess the bacterial community. The code above each lane refers to each water sample (Table 2.1).
3.2 Community composition of different lakes
3.2.1 Community composition of Mirpur lake
The DGGE profiles (Figure 3.1) of the four samples collected from different sites of Mirpur lake shows the relative composition of the bacterial communities were different. The phylogenetic affiliation (Table 3.1) of each sequenced DGGE band shows that they belong to members of five bacterial phyla: Gammaproteobacteria, Betaproteobacteria, Bacteroidetes, Actinobacteria, Firmicutes and Cyanobacteria. The Gammaproteobacteria was the dominant phylum in this site present in all the four samples more than once. In these samples prominent bands according to band intensity in the DGGE gel (Figure 3.1) were most closely related to known organisms in the database included Acinetobacter sp. (band 1M1), Bacillus sp. (2M1), the Escherichia-Shigella group (4M2), Acidovorax sp. (5M4), Streptococcus sp. (18M1), Synechococcus sp. (34M1), Arthrobacter sp. (6M3), Flavobacterium sp. (8M3) and Verminephrobacter sp. (9M3). One prominent band (24M4) was most closely related to unidentified bacteria at an identity level of 88%. Percent identities ranged between good (99%) and poor (88%).
3.2.2 Community composition of Narayanganj lake
In case of Narayanganj lake four samples were analyzed through DGGE. The bacterial phyla that were found to be present in different sites of this lake are Bacteroidetes, Gammaproteobacteria, Betaproteobacteria and Firmicutes (Table 3.2). The Gammaproteobacteria was the dominant phylum in this site. In these samples prominent bands according to band intensity in the DGGE gel (Figure 3.1) were most closely related to known organisms in the database included Acidovorax sp. (5P1), Acinetobacter sp. (band 11P1), Bacillus sp. (13P3), the Escherichia-Shigella group (4P1), Oceanobacillus sp.(12P3), Verminephrobacter sp. (9P3). One prominent band (band 10P1) was most closely related to unidentified bacteria at identity level of 88%. Percent identities ranged between good (98%) and poor (84%).
Table 3.1: Identity of phylotypes in DGGE profiles of freshwater samples in Mirpur lake (Figure 3.1)
| DGGE band | Accession no.
| Phylogenetic affiliation | Closest relative | Maximum identity (%) |
| 1M1 | NC_009085.1 | Gammaproteobacteria | Acinetobacter sp. | 98 |
| 2M1 | NC_008600.1 | Firmicutes | Bacillus sp. | 97 |
| 4M1 | NC_008563.1 NC_008258.1 | Gammaproteobacteria | Escherichia sp. Shigella sp. | 98 |
| 18M1 | NC_009009.1 | Firmicutes | Streptococcus sp. | 96 |
| 21M1 | NC_008800.1 | Gammaproteobacteria | Yersinia sp. | 91 |
| 34M1 | NC_009482.1 | Cyanobacteria | Synechococcus sp. | 99 |
| 16M1 | NC_009348.1 | Gammaproteobacteria | Aeromonas sp. | 94 |
| 3M2 | NC_009085.1 | Gammaproteobacteria | Acinetobacter sp. | 96 |
| 4M2 | NC_008563.1 NC_008258.1 | Gammaproteobacteria | Escherichia sp. Shigella sp. | 98
|
| 5M2 | NC_008782 | Betaproteobacteria | Acidovorax sp | 93 |
| 27M2 | NC_009434.1 | Gammaproteobacteria | Pseudomonas sp. | 99 |
| 6M3 | NC_008711.1 | Actinobacteria | Arthrobacter sp. | 91 |
| 8M3 | NC_009441.1 | Bacteroidetes | Flavobacterium sp. | 95 |
| 9M3 | NC_008786.1 | Betaproteobacteria | Verminephrobacter sp. | 94 |
| 27M3 | NC_009434.1 | Gammaproteobacteria | Pseudomonas sp. | 99 |
| 3M3 | NC_009085.1 | Gammaproteobacteria | Acinetobacter sp. | 96 |
| 31M3 | NC_008577.1 | Gammaproteobacteria | Shewanella sp. | 95 |
| 13M3 | NC_002570.2 | Firmicutes | Bacillus sp. | 90 |
| 23M4 | NC_009085.1 | Gammaproteobacteria | Acinetobacter sp. | 96 |
| 24M4 | NC_008571.1 | Bacteroidetes | Unidentified bacteria | 88 |
| 4M4 | NC_008563.1 NC_008258.1 | Gammaproteobacteria | Escherichia sp. Shigella sp. | 98 |
| 8M4 | NC_009441.1 | Bacteroidetes | Flavobacterium sp. | 95 |
| 5M4 | NC_008782 | Betaproteobacteria | Acidovorax sp. | 93 |
3.2.3 Community composition of Gulshan lake
The bacterial phyla that were found in Gulshan lake were Bacteroidetes, Gammaproteobacteria, Betaproteobacteria, Actinobacteria and Firmicutes (Table 3.3). The Gammaproteobacteria was the dominant phylum in this site also. In these samples prominent bands according to band intensity in the DGGE gel (Figures 3.1 and 3.2) were most closely related to known organisms in the database included the Escherichia-Shigella group (4G1), Acinetobacter sp. (band 14G1), Aeromonas sp. (16G1) Bacteroides sp. (17G2), Streptococcus sp. (18G2), Polaromonas sp. (19G2), Vibrio sp. (47G3), Staphylococcus sp. (40G4). Two prominent bands (bands 43G3 and 43G4) were most closely related to unidentified bacteria. Percent identities ranged between good (99%) and poor (84%).
Table 3.2: Identity of phylotypes in DGGE profiles of freshwater samples in Narayanganj lake (Figure 3.1)
| DGGE band | Accession no.
| Phylogenetic affiliation | Closest relative | Maximum identity (%) |
| 10P1 | NC_008571.1 | Bacteroidetes | Unidentified bacteria | 88 |
| 11P1 | NC_009085.1 | Gammaproteobacteria | Acinetobacter sp. | 96 |
| 4P1 | NC_008563.1 NC_008258.1 | Gammaproteobacteria | Escherichia sp. Shigella sp. | 96 |
| 8P1 | NC_009441.1 | Bacteroidetes | Flavobacterium sp. | 95 |
| 5P1 | NC_008782 | Betaproteobacteria | Acidovorax sp. | 93 |
| 15P2 | NC_005966.1 | Gammaproteobacteria | Acinetobacter sp. | 93 |
| 20P2 | NC_008563.1 NC_008258.1 | Gammaproteobacteria | Escherichia sp. Shigella sp. | 96 |
| 35P3 | NC_009085.1 | Gammaproteobacteria | Acinetobacter sp. | 94 |
| 12P3 | NC_004193.1 | Firmicutes | Oceanobacillus sp. | 90 |
| 13P3 | NC_002570.2 | Firmicutes | Bacillus sp. | 90 |
| 9P3 | NC_008786.1 | Betaproteobacteria | Verminephrobacter sp. | 94 |
| 20P3 | NC_008563.1 NC_008258.1 | Gammaproteobacteria | Escherichia sp. Shigella sp. | 96 |
| 4P4 | NC_008563.1 NC_008258.1 | Gammaproteobacteria | Escherichia sp. Shigella sp. | 98 |
| 2P4 | NC_008600.1 | Firmicutes | Bacillus sp. | 97 |
| 7P4 | NC_009441.1 | Bacteroidetes | Unidentified bacteria | 84 |
Table 3.3: Identity of phylotypes in DGGE profiles of freshwater samples in Gulshan lake (Figures 3.1 and 3.2)
| DGGE band
| Accession no.
| Phylogenetic affiliation | Closest relative | Maximum identity (%) |
| 14G1 | NC_009085.1 | Gammaproteobacteria | Acinetobacter sp. | 93 |
| 4G1 | NC_008253.1 NC_007384.1 | Gammaproteobacteria | Escherichia sp. Shigella sp. | 98 |
| 16G1 | NC_009348.1 | Gammaproteobacteria | Aeromonas sp. | 94 |
| 7G1 | NC_009441.1 | Bacteroidetes | Unidentified bacteria | 84 |
| 27G1 | NC_009434.1 | Gammaproteobacteria | Pseudomonas sp. | 99 |
| 17G2 | NC_004663.1 | Bacteroidetes | Bacteroides sp. | 94 |
| 18G2 | NC_009009.1 | Firmicutes | Streptococcus sp. | 96 |
| 19G2 | NC_007948.1 | Betaproteobacteria | Polaromonas sp. | 93 |
| 4G2 | NC_008253.1 NC_007384.1 | Gammaproteobacteria | Escherichia sp. Shigella sp. | 98 |
| 6G2 | NC_008711.1 | Actinobacteria | Arthrobacter sp. | 91 |
| 47G3 | NC_004459.2 | Gammaproteobacteria | Vibrio sp. | 92 |
| 40G3 | NC_002976.3 | Firmicutes | Staphylococcus sp. | 95 |
| 43G3 | NC_006370.1 | Gammaproteobacteria | Unidentified bacteria | 85 |
| 47G4 | NC_004459.2 | Gammaproteobacteria | Vibrio sp. | 92 |
| 40G4 | NC_002976.3 | Firmicutes | Staphylococcus sp. | 95 |
| 43G4 | NC_006370.1 | Gammaproteobacteria | Unidentified bacteria | 85 |
Table 3.4 Continued
| DGGE band | Accession no. | Phylogenetic affiliation | Closest relative | Maximum identity (%) |
| 42 R8 | NC_005139.1 | Gammaproteobacteria | Vibrio sp. | 90 |
| 40 R8 | NC_002976.3 | Firmicutes | Staphylococcus sp. | 95 |
| 46 R9 | NC_008258.1 | Gammaproteobacteria | Shigella sp. | 96 |
| 44 R9 | NC_004193.1 | Firmicutes | Oceanobacillus sp. | 91 |
| 43 R11 | NC_006370.1 | Gammaproteobacteria | Unidentified bacteria | 85 |
| 44 R11 | NC_004193.1 | Firmicutes | Oceanobacillus sp. | 91 |
| 45 R11 | NC_008340.1 | Gammaproteobacteria | Alkalilimnicola sp. | 90 |
| 40 R11 | NC_002976.3 | Firmicutes | Staphylococcus sp. | 95 |
| 37 R11 | NC_008258.1 | Gammaproteobacteria | Shigella sp. | 98 |
3.2.4 Community composition of Ramna lake
In total nine samples were examined using DGGE. The bacterial phyla (Table 3.4) present were Gammaproteobacteria, Bacteroidetes, Deltaproteobacteria and Firmicutes. The dominant phylum was the Gammaproteobacteria in this site. In these samples prominent bands according to band intensity in the DGGE gel (Figures 3.1 and 3.2) were most closely related to known organisms in the database included the Escherichia-Shigella group (band 4R1), Yersinia sp. (21R1), Acinetobacter sp. (15R1), Pelobacter sp. (22R2), Vibrio sp. (42R8), Oceanobacillus sp. (44R9), Staphylococcus sp. (40R5) and Alkalilimnicola sp. (45R11). Four prominent bands (7R1, 49R3, 49R5 and 43R11) were most closely related to either uncultured or unidentified bacteria. Percent identities ranged between good (99%) and poor (84%). Four bands of sample R3, R5, R8 and R11 were most closely related to only Shigella species (96-98% identity) of the E. coli- Shigella group.
Table 3.4: Identity of phylotypes in DGGE profiles of freshwater samples in Ramna lake (Figures 3.1 and 3.2)
| DGGE band
| Accession no.
| Phylogenetic affiliation | Closest relative | Maximum identity (%) |
| 4 R1 | NC_008563.1 NC_008258.1 | Gammaproteobacteria | Escherichia sp. Shigella sp. | 98 |
| 21 R1 | NC_008800.1 | Gammaproteobacteria | Yersinia sp. | 91 |
| 7 R1 | NC_009441.1 | Bacteroidetes | Unidentified bacteria | 84 |
| 15 R1 | NC_005966.1 | Gammaproteobacteria | Acinetobacter sp. | 93 |
| 22 R2 | NC_008609.1 | Deltaproteobacteria | Pelobacter sp. | 93 |
| 4 R2 | NC_008563.1 NC_008258.1 | Gammaproteobacteria | Escherichia sp. Shigella sp. | 98 |
| 49 R3 | NC_002655.2 | Gammaproteobacteria | Unidentified bacteria | 88 |
| 37 R3 | NC_008258.1 | Gammaproteobacteria | Shigella sp. | 98 |
| 40 R5 | NC_002976.3 | Firmicutes | Staphylococcus sp. | 95 |
| 49 R5 | NC_002655.2 | Gammaproteobacteria | Unidentified bacteria | 88 |
| 37 R5 | NC_008258.1 | Gammaproteobacteria | Shigella sp. | 98 |
| 42 R6 | NC_005139.1 | Gammaproteobacteria | Vibrio sp. | 90 |
| 36 R6 | NC_008563.1 NC_008258.1 | Gammaproteobacteria | Escherichia sp. Shigella sp. | 93 |
| 40 R6 | NC_002976.3 | Firmicutes | Staphylococcus sp. | 95 |
| 42 R7 | NC_005139.1 | Gammaproteobacteria | Vibrio sp. | 90 |
| 36 R7 | NC_008563.1 NC_008258.1 | Gammaproteobacteria | Escherichia sp. Shigella sp. | 93 |
| 40 R7 | NC_002976.3 | Firmicutes | Staphylococcus sp. | 95 |
3.2.5 Community composition of Dhanmondi lake
Eleven samples collected from different sites of Dhanmondi lake were examined. The bacterial phyla (Table 3.5) those were present: Gammaproteobacteria, Actinobacteria, Cyanobacteria, Betaproteobacteria, Bacteroidetes and Firmicutes. The dominant phylum was the Gammaproteobacteria in this site. In these samples prominent bands according to band intensity in the DGGE gel (Figures 3.1 and 3.2) was most closely related to known organisms in the database included the Escherichia-Shigella group (band 29D1), Oceanobacillus sp. (26D1), Pseudomonas sp. (27D1), Shewanella sp. (28D1), Synechococcus sp. (34D1), Streptococcus sp. (18D1), Yersinia sp. (32D3), Flavobacterium sp. (8D3), Acinetobacter sp. (25D4), Verminephrobacter sp. (9D3), Bacillus sp. (2D5), and Arthrobacter sp. (6D5). Percent identities ranged between good (99%) and poor (82%). Eight prominent bands (sample D1, D3, D7, D9, D10 and D11) were most closely related to unidentified bacteria. Five bands of sample D7, D9, D10, D11 and D12 were most closely related to only Shigella species (98% identity) of the E. coli- Shigella group. Among all the samples of all the sites D1 showed the highest number or bacteria with nine prominent bands representing nine bacteria.
Table 3.5: Identity of phylotypes in DGGE profiles of freshwater samples in Dhanmondi lake (Figures 3.1 and 3.2)
| DGGE band | Accession no. | Phylogenetic affiliation | Closest relative | Maximum identity (%) |
| 26 D1 | NC_004193.1 | Firmicutes | Oceanobacillus sp. | 90 |
| 27 D1 | NC_009434.1 | Gammaproteobacteria | Pseudomonas sp. | 99 |
| 28 D1 | NC_008577.1 | Gammaproteobacteria | Shewanella sp. | 94 |
| 29 D1 | NC_008563.1 NC_008258.1 | Gammaproteobacteria | Escherichia sp. Shigella sp. | 98 |
| 34 D1 | NC_009482.1 | Cyanobacteria | Synechococcus sp. | 99 |
| 18 D1 | NC_009009.1 | Firmicutes | Streptococcus sp. | 96 |
| 33 D1 | NC_002570.2 | Firmicutes | Unidentified bacteria | 89 |
| 15 D1 | NC_005966.1 | Gammaproteobacteria | Acinetobacter sp. | 93 |
| 9 D1 | NC_008786.1 | Betaproteobacteria | Verminephrobacter sp. | 94 |
| 4 D2 | NC_008563.1 NC_008258.1 | Gammaproteobacteria | Escherichia sp. Shigella sp. | 98 |
| 25 D2 | NC_009085.1 | Gammaproteobacteria | Acinetobacter sp. | 92 |
| 30 D3 | NC_009434.1 | Gammaproteobacteria | Pseudomonas sp. | 98 |
| 31 D3 | NC_008577.1 | Gammaproteobacteria | Shewanella sp. | 95 |
| 32 D3 | NC_008800.1 | Gammaproteobacteria | Yersinia sp. | 91 |
| 33 D3 | NC_002570.2 | Firmicutes | Unidentified bacteria | 89 |
| 8 D3 | NC_009441.1 | Bacteroidetes | Flavobacterium sp. | 95 |
| 29 D3 | NC_008563.1 NC_008258.1 | Gammaproteobacteria | Escherichia sp. Shigella sp. | 98 |
| 25 D3 | NC_009085.1 | Gammaproteobacteria | Acinetobacter sp. | 92 |
| 9 D3 | NC_008786.1 | Betaproteobacteria | Verminephrobacter sp. | 94 |
| 31 D4 | NC_008577.1 | Gammaproteobacteria | Shewanella sp. | 95 |
| 8 D4 | NC_009441.1 | Bacteroidetes | Flavobacterium sp. | 95 |
| 29 D4 | NC_008563.1 NC_008258.1 | Gammaproteobacteria | Escherichia sp. Shigella sp. | 98 |
| 25 D4 | NC_009085.1 | Gammaproteobacteria | Acinetobacter sp. | 92 |
| 2 D5 | NC_008600.1 | Firmicutes | Bacillus sp. | 97 |
| 8 D5 | NC_009441.1 | Bacteroidetes | Flavobacterium sp. | 95 |
| 29 D5 | NC_008563.1 NC_008258.1 | Gammaproteobacteria | Escherichia sp. Shigella sp. | 98 |
| 25 D5 | NC_009085.1 | Gammaproteobacteria | Acinetobacter sp. | 92 |
| 6 D5 | NC_008711.1 | Actinobacteria | Arthrobacter sp. | 91 |
| 34 D6 | NC_009482.1 | Cyanobacteria | Synechococcus sp. | 99 |
| 8 D6 | NC_009441.1 | Bacteroidetes | Flavobacterium sp. | 95 |
| 29 D6 | NC_008563.1 NC_008258.1 | Gammaproteobacteria | Escherichia sp. Shigella sp. | 98 |
| 33 D6 | NC_002570.2 | Firmicutes | Unidentified bacteria | 89 |
| 10 D6 | NC_008571.1 | Bacteroidetes | Unidentified bacteria | 88 |
| 48D7 | NC_002655.2 | Gammaproteobacteria | Unidentified bacteria | 83 |
| 37D7 | NC_008258.1 | Gammaproteobacteria | Shigella sp. | 98 |
| 38 D9 | NC_002570.2 | Firmicutes | Unidentified bacteria | 82 |
| 48 D9 | NC_002655.2 | Gammaproteobacteria | Unidentified bacteria | 83 |
| 37 D9 | NC_008258.1 | Gammaproteobacteria | Shigella sp. | 98 |
| 43 D9 | NC_006370.1 | Gammaproteobacteria | Unidentified bacteria | 85 |
| 48 D10 | NC_002655.2 | Gammaproteobacteria | Unidentified bacteria | 83 |
| 37 D10 | NC_008258.1 | Gammaproteobacteria | Shigella sp. | 98 |
| 48 D11 | NC_002655.2 | Gammaproteobacteria | Unidentified bacteria | 83 |
| 37 D11 | NC_008258.1 | Gammaproteobacteria | Shigella sp. | 98 |
| 37 D12 | NC_008258.1 | Gammaproteobacteria | Shigella sp. | 98 |
3.2.6 Community composition of Gafargaon lake
Three samples collected from different sites of Gafargaon lake were examined using DGGE. The bacterial phyla (Table 3.6) present were Gammaproteobacteria and Firmicutes. The Gammaproteobacteria was dominant phylum in this site. In these samples prominent bands according to band intensity in the DGGE gel (Figure 3.2) were most closely related to known organisms in the database included the Escherichia-Shigella group (band 36F2), Vibrio sp. (42F3), Bacillus sp. (41F3), Staphylococcus sp. (40F1) and Alkalilimnicola sp. (45F3). Three prominent bands (39F1, 43F2 and 45F3) were most closely related to either uncultured or unidentified bacteria. Percent identities ranged between good (99%) and poor (85%).Another band, 37F3, was most closely related to only Shigella species (98% identity) of the E. coli- Shigella group.
Table 3.6: Identity of phylotypes in DGGE profiles of freshwater samples in Gafargaon lake (Figure 3.2)
| DGGE band | Accession no.
| Phylogenetic affiliation | Closest relative | Maximum identity (%) |
| 40 F1 | NC_002976.3 | Firmicutes | Staphylococcus sp. | 95 |
| 39 F1 | NC_002655.2 | Gammaproteobacteria | Unidentified bacteria | 88 |
| 36 F2 | NC_008563.1 NC_008258.1 | Gammaproteobacteria | Escherichia sp. Shigella sp. | 93 |
| 43 F2 | NC_006370.1 | Gammaproteobacteria | Unidentified bacteria | 85 |
| 41 F3 | NC_006270.2 | Firmicutes | Bacillus sp. | 98 |
| 42 F3 | NC_005139.1 | Gammaproteobacteria | Vibrio sp. | 90 |
| 39 F3 | NC_002655.2 | Gammaproteobacteria | Unidentified bacteria | 88 |
| 37 F3 | NC_008258.1 | Gammaproteobacteria | Shigella sp. | 98 |
| 45 F3 | NC_008340.1 | Gammaproteobacteria | Alkalilimnicola sp. | 90 |
3.3 Detection of E. coli and Shigella species in the water samples by PCR
3.3.1 Detection of enterotoxigenic E. coli
The lt1 and st1 gene was amplified by PCR to detect the presence of enterotoxigenic E. coli in the thirty five representative samples analyzed by DGGE followed by sequencing. PCR analysis showed that one sample was positive for lt1 gene (Figure 3.3) but none was positive for st1 gene.
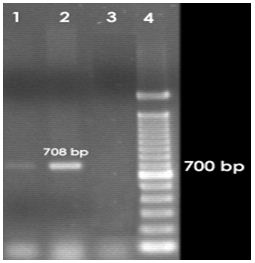
Figure 3.3: Agarose gel electrophoresis showing PCR amplification products of lt1 gene (708 bp). Lanes 1, 2, 3 and 4 represent sample R9 (Table 2.1), positive control, negative control and DNA molecular size marker (100-bp DNA ladder) respectively.
3.3.2 Detection of enteropathogenic E. coli
The bfp gene was amplified by PCR to detect the presence of enteropathogenic E. coli in the representative samples. PCR analysis showed that only one of the samples was positive for bfp gene (Figure 3.4).
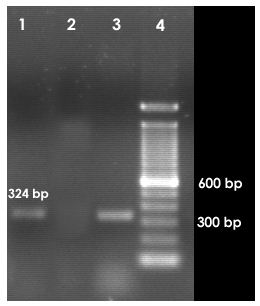
Figure 3.4: Agarose gel electrophoresis showing PCR amplification products of bfp gene (324 bp). Lanes 1, 2, 3 and 4 represent sample F2 (Table 2.1), negative control, positive control and DNA molecular size marker (100-bp DNA ladder) respectively.
3.3.3 Detection of enterohemorrhagic E. coli
The stx1 gene was amplified by PCR to detect the presence of enterohemorrhagic E. coli. PCR analysis showed that two samples were positive for stx1 (Figure 3.5).
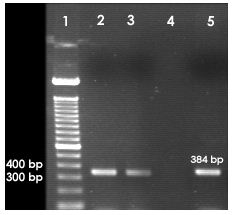
Figure 3.5: Agarose gel electrophoresis showing PCR amplification products of stx1 gene (384 bp). Lanes 1, 2, 3, 4 and 5 represent DNA molecular size marker (100-bp DNA ladder), sample F1, R9 (Table 2.1), negative control and positive control respectively.
3.3.4 Detection of enteroinvasive E. coli and Shigella spp.
The ipaH, ipaBCD, virA and ial gene were amplified by PCR to detect the presence of enteroinvasive E. coli (EIEC) and/or Shigella in the thirty five representative samples. PCR analysis showed that three samples were positive for ial gene (Figure 3.6), nine were positive for ipaH gene (Figure 3.7), four were positive for ipaBCD gene (Figure 3.8) and seventeen were positive for virA gene (Figure 3.9).
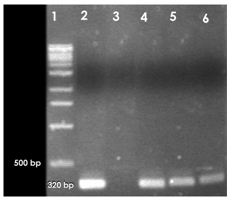
Figure 3.6: Agarose gel electrophoresis showing PCR amplification products of ial gene (320 bp). Lanes 1, 2, 3, 4, 5 and 6 represent DNA molecular size marker (100-bp DNA ladder), positive control, negative control, sample G4, M4, F3 (Table 2.1) respectively.
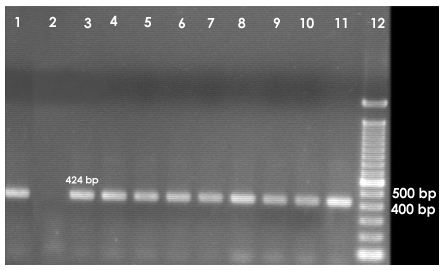
Figure 3.7: Agarose gel electrophoresis showing PCR amplification products of ipaH gene (424 bp). Lanes 1, 2, 3, 4, 5, 6, 7, 8, 9, 10, 11 and 12 represent positive control, negative control, sample M4, P1, G4, D1, D2, D6, F1, F2, F3 (Table 2.1) and DNA molecular size marker (100-bp DNA ladder) respectively.
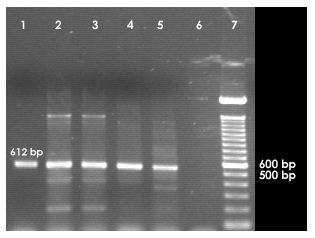
Figure 3.8: Agarose gel electrophoresis showing PCR amplification products of ipaBCD gene (612 bp). Lanes 1, 2, 3, 4, 5, 6 and 7 represent positive control, sample P3, G1, G4, R11 (Table 2.1), negative control and DNA molecular size marker (100-bp DNA ladder) respectively.
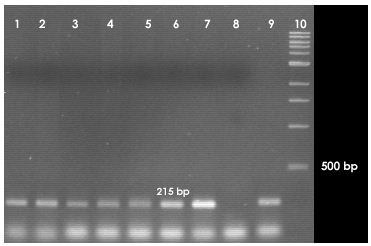
Figure 3.9: Agarose gel electrophoresis showing PCR amplification products (representative) of virA gene (215 bp). Lanes 1, 2, 3, 4, 5, 6, 7, 8, 9 and 10 represent sample M1, P3, G1, R2, D4, D5, F1 (Table 2.1), negative control, positive control and DNA molecular size marker (100-bp DNA ladder) respectively.
3.4 Statistical analysis
3.4.1 NPar Tests
The NPar test was performed to test normal parameters, extreme differences and Kolmogorov-Smirnov Z. The Kolmogorov-Smirnov test compares an observed cumulative distribution function with a theoretical cumulative distribution. The output indicate that the test distribution is normal and uniform.
3.4.2 Analysis of the occurrence of the phyla with respect to the enrichment procedures
A graph (Figure 3.10) was prepared through SPSS to compare the presence of the seven phyla e.g. Gammaproteobacteria, Betaproteobacteria, Deltaproteobacteria, Actinobacteria, Cyanobacteria, Bacteroidetes and Firmicutes in different enrichment media, 1.0× enrichment, 0.1× enrichment (diluted) and the direct sample.

Figure 3.10: Effects of enrichment procedures on growth of different phyla. Enrichment diluted: 0.1× enrichment; enrichment: 1.0× enrichment.
The bar graph shows that the diluted enrichment was more effective to recover Gammaproteobacteria compare to the concentrated enrichment media. The occurance of Gammaproteobacteria increased in the two enrichment media as compared to the direct sample. Actinobacteria was present only in direct sample and the number of Bacteroidetes decreases significantly in the two enrichment media.
3.4.3 Bivariate correlations between the genes examined by PCR
To find out the presence of any correlation between the specific virulent genes of E. coli and Shigella, the bivariate correlation was done. The correlation Table (Appendix-IV) displays Pearson correlation coefficients, significance values, and the number of cases with non-missing values. The Table shows that correlation is significant between ipaH and ial genes (p = 0.001), ipaH and bfp genes (p = 0.089) and also between ipaBCD and virA genes (p = 0.029). Correlation is significant at 0.1 level. The significant correlation has also been presented graphically (Figures 3.11 and 3.12).
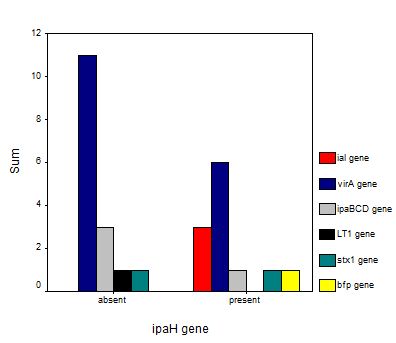
Figure 3.11: Occurrence of specific virulent genes of E. coli and Shigella spp. with respect to ipaH gene
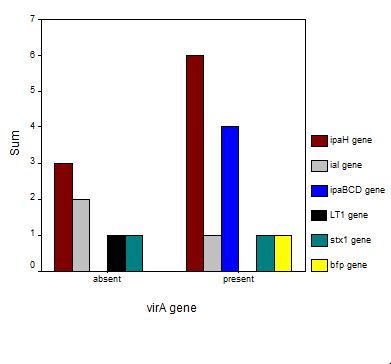
Figure 3.12: Occurrence of specific virulent genes of E. coli and Shigella with respect to virA gene
3.4.4 Bivariate correlations between the seven phyla
The bivariate correlation was done to find out correlation between the seven phyla present in the samples e.g., Gammaproteobacteria, Betaproteobacteria, Deltaproteobacteria, Actinobacteria, Cyanobacteria, Bacteroidetes and Firmicutes. The correlation Table (Appendix-IV) shows that there is no significant correlation between the presence of Gammaproteobacteria and other six phyla.
3.4.5 Bivariate correlations between the bacterial genera
The bivariate correlation was done to find out correlation between the twenty one different bacterial genera. Significant correlation was absent between the E. coli-Shigella group and other bacterial genera identified in the samples.
3.4.6 Occurrence of different phyla with respect to specific virulent genes
There is an important association between the presence of different phyla and the presence of the ipaH, ipaBCD, ial and virA genes.
These graphs show that Gammaproteobacteria, Firmicutes, Betaproteobacteria and Bacteroidetes were always present with these four genes. There was no such relationship between the E. coli specific genes bfp, stx1 and lt1 and the presence of the phyla. These genes were present in samples where only Gammaproteobacteria and Firmicutes were present.
In the studied samples Gammaproteobacteria was the dominant phylum and the other six phyla found to be present in the samples are Betaproteobacteria, Deltaproteobacteria, Actinobacteria, Cyanobacteria, Bacteroidetes and Firmicutes. The number of Actinobacteria, Deltaproteobacteria and Cyanobacteria was very low. The phyla Firmicutes, Betaproteobacteria and Bacteroidetes were present with Gammaproteobacteria in maximum cases.
4.0 Discussion
Waterborne pathogens still cause disease outbreaks in both developing and developed countries (Craun et al., 2002). Thus, monitoring strategies and in particular those directed to determining the composition of microbial assemblages are becoming more and more necessary for the management of these water systems. World Health Organization (WHO, 2001) has categorized the diseases caused by Shigella and Enterohemorrhagic E. coli (EHEC) as priority waterborne disease. There is evidence that Escherichia coli will survive indefinitely in tropical waters and may even multiply (Carillo et al., 1985). However, identification of Shigella in environmental samples is limited mainly by the lack of a suitable enrichment technique (Faruque et al., 2002). The present study has focused on the identification of the community structure of E. coli and Shigella species.
The PCR-DGGE approach combined with statistical analysis was used to study the community of E. coli and Shigella in the freshwater environment in Bangladesh where PCR amplified V3 region of 16S rDNA fragments were separated by DGGE. The method is not limited to species that are amenable to laboratory cultivation because molecules rather than organisms are isolated. Bacterial analysis by 16S rRNA has become popular because these sections of RNA are conserved and easy to sequence. However, the classification of closely related species of bacteria, for example, Shigella spp. and E. coli, is difficult to achieve through 16S rRNA analysis (Christense et al., 1998). PCR of specific virulent genes was also carried out to see the presence of the specific bacteria in the freshwater samples.
Recently, several studies have examined bacterial community composition in the epilimnion of freshwater lakes and reservoirs. The major bacterial divisions represented in most or all freshwater sites are the Proteobacteria (alpha and beta subdivisions), the Cytophaga-Flavobacterium-Bacteroides (CFB) group, the Actinobacteria, the Cyanobacteria and the Verrucomicrobia (Zwart et al., 2002). Another study identified representatives of six bacterial phyla-Actinobacteria, Bacteroidetes, Firmicutes, Proteobacteria, TM7 and Verrucomicrobia, including members of the classes Alpha-, Beta-, Delta and Gammaproteobacteria, as well as phylotypes with unknown affiliation in a freshwater site (Newton et al., 2006). In these studies Alphaproteobacteria, Betaproteobacteria, Actinobacteria and Bacteroidetes were identified as dominant bacterial groups of freshwater communities. In this study Gammaproteobacteria, Betaproteobacteria, Deltaproteobacteria, Bacteroidetes, Cyanobacteria, Actinobacteria and Firmicutes were found as the representatives of freshwater bacterial groups. This confirms findings from previous studies of freshwater bacterial communities. Gammaproteobacteria found as the domimnant bacterial group in almost all the samples studied. This incongruity may be due to the specific pre-enrichment and enrichment used for E. coli and particularly for Shigella species. Some other factors such as regionalization, seasonal patterns, and environmental parameters have important influence on bacterial community composition (Lindström and Leskinen, 2002; Yannarell and Triplett, 2004).
In this study freshwater samples were collected from different sites of the lakes of Mirpur, Narayangang, Ramna, Gafargaon, Dhanmondi and Gulshan area. The DNA samples collected from the same site showed, to some extent, similar DGGE profiles whereas differences were found among enriched and fresh water samples (Figures 3.1 and 3.2). In all the samples prominent bands according to band intensity in the DGGE gel showed ≥90% identity and were most closely related to known organisms in the database included the Escherichia-Shigella group, Acinetobacter sp., Bacillus sp., Acidovorax sp., Streptococcus sp., Synechococcus sp., Arthrobacter sp., Flavobacterium sp., Verminephrobacter sp., Oceanobacillus sp., Aeromonas sp., Bacteroides sp., Polaromonas sp., Vibrio sp., Staphylococcus sp., Yersinia sp., Pelobacter sp., Alkalilimnicola sp., Pseudomonas sp. and Shewanella sp. Some prominent bands were most closely related to unidentified bacteria at identity level of 82-89%.
16S rRNA and other genome-level similarities suggest that Escherichia and Shigella are sufficiently similar for placement in a single genus (Brenner et al., 1973; Pupo et al., 1997). Nevertheless, for clinical, epidemiological, and historical reasons they are regarded as different genera. The 16S rRNA gene of E. coli differs from that of Shigella flexneri, S. sonnei, S. boydii, and S. dysenteriae by 4, 5, 8, and 17 bases, respectively (Cilia et al., 1996; Wang et al., 1997). When the E. coli and Shigella 16S rRNA genes are aligned, only two areas (both within hypervariable regions) have more than two mismatches over 20 contiguous nucleotides. The universal bacterial primers L340GCF and K517R used in this study could not discriminate between E. coli and Shigella species with the exception of some bands (37,46 in Figure 3.2) that were most closely related to only Shigella species (96-98% identity) of the E. coli- Shigella group. To solve this problem Sabat et al., (2000) designed a set of PCR primers targeting 16S rRNA gene sequences and optimized PCR parameters to develop a robust and reliable protocol for selective amplification of Escherichia coli 16S rRNA genes. The method was capable of discriminating E. coli from other enteric bacteria, including its closest relative, Shigella.
Diarrheal disease continues to be a leading cause of morbidity and mortality worldwide, and is ranked fourth as a cause of death (Murray and Lopez, 1997). In the world’s largest diarrheal disease centre in Dhaka, Bangladesh, E. coli accounted for 29% of the pediatric diarrheal cases (Albert et al., 1999 and Black et al., 1980). Shigellosis is endemic in Bangladesh, and it is estimated that dysentery accounts for 20% of deaths related to diarrhea among children (Victoria et al., 1993). In this study water samples collected from different lakes which are used by people for several purposes like bathing, washing etc. The Escherichia-Shigella group, the two most important waterborne pathogens, was present in all the samples except sample M3 and R8. Use of such water for drinking, cooking, contact with it during washing or bathing, or even inhalation of its fine droplets as aerosols, may result in infection and disease manifestation. The presence of these two bacteria proves the fact that diarrheal diseases are endemic in Bangladesh.
PCR is a major advance in molecular diagnostics of pathogenic microorganisms, including E. coli. PCR primers have been developed successfully for several of the categories of diarrheagenic E. coli and Shigella spp. Advantages of PCR include great sensitivity with in situ detection of target templates. In this study PCR was performed with different virulent genes in attempt to detect the presence of E. coli and Shigella spp. in the water samples along with the PCR of the V3 region of 16S rDNA. PCR of specific virulent genes helps to identify the community of E. coli and Shigella spp.
Detection of enterotoxigenic E. coli has long relied upon detection of the enterotoxins LT and/or ST (Nataro and Kaper 1998). PCR analysis showed that sample R9 (from Ramna) was positive for lt1 gene but none was positive for st1 gene. The identity of the factor mediating localized adherence of enteropathogenic E. coli was reported by Girón et al. (1991), who described 7-nm diameter fimbriae produced by EPEC strains which tended to aggregate and form bundles, thereby suggesting the name “bundle-forming pilus” (BFP). In this study sample F2 (Gafargaon) was positive for bfp gene. Most DNA probes and PCR techniques for enterohemorrhagic E. coli are directed toward the detection of genes encoding Stx (Nataro and Kaper, 1998). PCR analysis showed that two samples F1 (Gafargaon) and R9 (Ramna) were positive for stx1.
Enteroinvasive E. coli (EIEC) strains are biochemically, genetically, and pathogenetically related closely to Shigella species. Shigella spp. are difficult to distinguish from EIEC strains with PCR analysis. In this study, the ipaH, ipaBCD, virA and ial genes were amplified by PCR to detect the presence of enteroinvasive E. coli (EIEC) and/or Shigella in the thirty five representative samples. The gene ipaH is present in both the Shigella chromosome and on a large plasmid and hence, it is a more stable gene to detect. However, the sole presence of ipaH is not an absolute indicator of virulence as loss or deletion of the plasmid renders the bacterium noninvasive and, therefore, avirulent (Thong, 2005). On the other hand ial is found on large plasmids which are prone to loss or deletions; this gene-based detection may give false negative results. The virulent gene ipaBCD encode factors involved in epithelial cell invasion by Shigella. It is reported that the infectious phenotypes of Shigella result from coordinate expression of virulence (vir) genes encoded on chromosomal as well as on the large invasion plasmid, 120-140 kbp (Smith, 1987). PCR analysis showed that three samples were positive for ial gene, nine were positive for ipaH gene, four were positive for ipaBCD gene, and seventeen were positive for virA gene. The positive samples represent different sampling site and enrichment techniques
The occurrence of the seven phyla e.g. Gammaproteobacteria, Betaproteobacteria, Deltaproteobacteria, Actinobacteria, Cyanobacteria, Bacteroidetes and Firmicutes in different enrichment media, 1.0× enrichment, 0.1× enrichment (diluted) and the direct samples was compared using SPSS. The diluted enrichment was more capable to recover Gammaproteobacteria than the concentrated enrichment media. This may be due to low amount of nutrient present in the diluted media and environmentally starved, injured or stressed bacteria may not tolerate or use high concentration of nutrient. The occurance of Gammaproteobacteria increased in the two enrichment media compared to the direct sample. It was also noticed that Actinobacteria was present only in direct sample and the number of Bacteroidetes decreases significantly in the two enrichment media. This may be due to the specific enrichment of the water samples for E. coli and Shigella spp. that represent Gammaproteobacteria.
To find out the presence of any correlation between the specific virulent genes of E. coli and Shigella spp. the bivariate correlation was done. Correlation was significant between ipaH and ial genes (p = 0.001), ipaH and bfp genes (p = 0.089) and also between ipaBCD and virA genes (p = 0.029). The gene ial was only present when ipaH was present and similarly ipaBCD was associated with virA. This confirms the fact that these four genes are specific for Shigella spp. and enteroinvasive E. coli (EIEC). As the target organisms are E. coli and Shigella spp. and as they are members of the phyla Gammaproteobacteria correlation between this phylum and other phyla has been examined. There was no significant correlation between the presence of Gammaproteobacteria and other six phyla detected in the water samples. This is because Gammaproteobacteria was always present in all the samples and to find out a significant correlation, absence of a variable in some cases is necessary. For the same reason there is no significant correlation between the E. coli-Shigella group and other bacterial genera identified in the samples.
There is an important association between the presence of different phyla and the presence of the enteroinvasive E. coli and Shigella specific genes ipaH, ipaBCD, ial and virA. Results showed that Gammaproteobacteria, Firmicutes, Betaproteobacteria and Bacteroidetes are always present with these four genes. There was no such relationship between the E. coli specific genes bfp, stx1 and lt1 and the presence of the phyla. These genes were present in samples where only Gammaproteobacteria and Firmicutes were present.
It can be concluded that due to specific enrichment used in this study the total community of E. coli and Shigella spp. can not be detected. The identified community is a reflection of the partial community. In the examined samples Gammaproteobacteria was the most dominant phylum and the other six phyla found to be present in the samples are Betaproteobacteria, Deltaproteobacteria, Actinobacteria, Cyanobacteria, Bacteroidetes and Firmicutes. The number of Actinobacteria, Deltaproteobacteria and Cyanobacteria was very low. This may be due to the enrichment procedure or these phyla may not have strong association with Gammaproteobacteria. It is highly probable that other phyla that are established as freshwater bacteria are in the samples but in low numbers that they are not prominent in the DGGE profile. The phyla Firmicutes, Betaproteobacteria and Bacteroidetes were present with Gammaproteobacteria in maximum cases. Further studies are needed to determine which bacteria or phyla have strong association with E. coli and Shigella spp. in the freshwater community. Determination of this type of association may lead to successful isolation and identification of those bacteria that are difficult to recover by cultural means e. g. Shigella spp. from environmental samples particularly water samples.