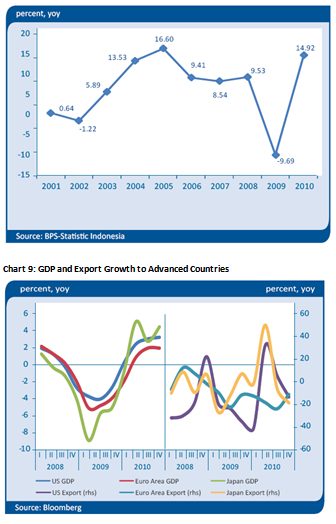
Export growth during 2010 was quite high amid the prospect of rupiah appreciation. Real exports growth during 2010 reached 14.9%, second highest in the last decade after 2005’s growth which reached 16.6%. The exports increased in 2005 were, among others, supported by the rupiah depreciation (Chart 8), while on the contrary, in 2010 rupiah strengthened significantly. The high export growth was mainly supported by stronger global demand, less dependent to certain destination countries, and the rise in global commodity prices.
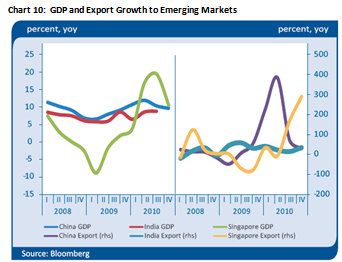
The increase in exports was underpinned by the rises in global demand, in line with global economic recovery which was mainly stemmed from emerging market countries. Growth in export volume during 2010 was mainly contributed by exports to China, Singapore and India, while the exports volume to traditional major destination countries such as the United States (U.S.) and Japan grew far lower and even exports to Europe has been declined when compared with previous years. This condition was in line with uneven economic recovery of these countries following the economic crisis in 2008/2009 as indicated by huge difference in terms of economic growth in developing countries which reached around 8% -15%. On the other hand, the economic growth of USA, Europe and Japan only reached around 2% -4% during 2010 (Chart 9-10).
The increase in exports as steered by the rise in international commodity prices coupled with the rise in demand from trading partners has pushed the exports higher. This condition was supported by some studies indicated that international commodity prices has provided quite an impact on several main exporting commodities, such as primary exporting commodities and some manufacture products with low import content.
(Export commodities with high elasticity (> 1) to changes in international prices are aluminum, wood products and metal products. Commodities with medium elasticity (about 0.5) are shrimp, palm oil (CPO), rubber and its products. Changes in international prices do not impact significantly on paper, textiles, machinery, coal and copper.) [2]
Chart : Export Growth
During 2010, export commodity prices have increased quite sharply in three groups of non-oil exports, mainly agricultural and industrial commodities. In line with the demand and price developments, volume of non-oil commodity exports has also increased. The highest non-oil export volume increase was in mining commodities with around 30%, while industrial and agricultural commodities had grown lower with 2% and 13.6% respectively (Chart 11). In exporting commodities, growth mainly occurred in the mining such as nickel, aluminum and coal. Exports in agricultural commodities were tobacco, wood and rubber, and industrial exports in chemical products, electrical equipment, machinery and textiles. With these developments, natural resource-based exports share has increased from 50.3% in 2009 to 52.7% in 2010.
Diversification of export commodities has also contributed to the higher export growth. Based on concentration indicator of Herfindahl-Hirschman Index (HHI), Indonesia’s export commodities were quite diversified. Based on this index, Indonesian export products have a low dependence on a particular exporting commodity as indicated by a low of index at 0.16. This condition made exports more resilient to external shock.[3] Diversification of Indonesian export products was also reflected in relatively new export products such as pepper, cassava, copra and other commodities which posted a remarkable value in the last five years. The performance of non-major exporting commodities increased considerably in 2010 which then helped supporting the rises in exports.
Over-reliance to particular export destination countries had also decreased. In the past ten years, market share of main export markets namely USA, Japan and Europe continued to decrease, while the market share of emerging market countries continued to increase. Thus, a moderate economic recovery in developed countries posed less significant impact on Indonesia’s export performance. Improved exports to emerging market countries mainly China, India and ASEAN subsequently compensate the decelerating exports to developed countries thus contributing a higher grow in the overall export performance in 2010 (Table 1). A more balanced
Chart 11: Export Growth by Sectors:
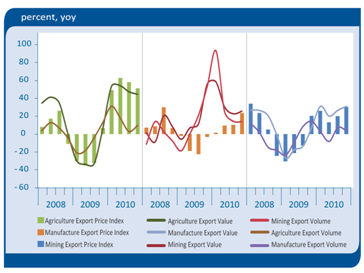
Table 1: The Share of Non-Oil and Gas Export by Country Destinations
export destination was also supported by a broad-based export destination as indicated by broadening of export destination countries such as to Luxembourg, Estonia, Latvia, Lithuania, Slovakia, Slovenia, Bulgaria and Romania. Exports to these countries grew high enough to support the export increase during 2010.
The increased of exports also came from natural resource-based commodities with quite substantial contribution as indicated by the Revealed Comparative Advantage (RCA) indicator. Based on this indicator, the main export commodities include crude palm oil, tin, rubber and coal (Table 2). Increase in demand and better prices in the international market have pushed the performance of exporting coal, rubber and copper. In addition, the exports of manufactured commodities with medium contribution like textiles and related products and paper products have also increased. However, natural resource-based commodities such as palm oil and tin have decreased albeit a favorable international market prices. This is due to a slow down production following some adverse weather conditions. Meanwhile, manufactured-based export commodities like electrical appliances, chemicals and machinery, while provided a small contribution, grew a quite high following the strong demand from China and Singapore, those with economic growth of over 10%.
Some manufactured commodities with small contributions like electrical appliances, however, had a quite significant spillover impact on the economy (Table 3) hence the growth of those commodities promoted the increase of GDP per capita.
Table 2: Competitiveness of Non-Oil and Gas Export Main Commodities
The presence of import content in export commodities has compensated the negative impact of rupiah appreciation. The appreciating trend of exchange rate tends to generate a higher commodity prices in overseas which eventually lead to weakening demand. Research conducted by Bank Indonesia indicated that rupiah appreciation can lower agricultural, food industry and metal industry exports by around 0.4% -0.5% with two month delay effect, but did not have a significant impact on the lower exports of textiles, processed wood, rubber and paper with high import content (around 20%). This showed that import content of export commodities was an important factor which determines the exchange rates effect on exports. Based on data from manufactured products exports in 2010, the share of industrial export commodity groups with high import content reached 42.6%. Meanwhile, commodity groups’ share with medium import content has reached 29.3%, while the share of the same group with low import content reached 28,1%. The high import content in manufactured commodities exports has made the prices higher in some commodities. This was caused by exchange rate appreciation which could be compensated by a decline in input prices.
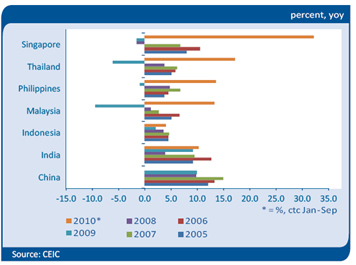
The role of Indonesian manufactured commodities export considered to be the lowest if compared with some countries in the region. Indonesia’s export growth during 2010 was quite high, but the growth and export share of manufacture products’ export in Indonesia was the lowest among other countries in the region (Table 4). Besides the technical factor namely a more contractive decline of exports in some countries in 2009, other factors to be considered were the development of industrial sector and Indonesian manufacture products export which not as advanced as those from other countries in the region (Chart 12).
Chart 12: Industrial Growth in Asian Countries:
The Government, however, continued to strengthen export competitiveness by strengthening the national industry. [4] In order to improve the competitiveness of national industries, as per Presidential Decree No. 1/ 2010 on the Acceleration of the Implementation of National Development Priorities in 2010, the government will revitalize fertilizer and sugar industries, develop oleo chemical and agricultural industrial clusters and develop oil and gas condensate-based industrial cluster.
Table 3: Productivity and Share of Indonesia’s Main Export Commodities
Table 4 Comparison of Export in Asian Countries
The government will also revitalize textile and cement industries. This policy is expected to have a positive impact on the development of manufactured product exports. Of significance achievement in 2010 was the establishment of National Business Plan for CPO Downstream Industry and Environmental Impact Analysis, Feasibility Study and Business for CPO Downstream Industry in Sei Mangke (North Sumatra), Kuala Enok and Dumai (Riau), and Maloy (East Kalimantan). In addition, the government also implemented several policies for supporting the development of national industries, including the issuance of raw materials import permit via a One Stop Service System, Implementation of National Single Window (NSW), and the improvement of investment supporting regulations. The improvement includes proposed changes on income tax exemption facility criteria (company income tax) for some industries, discussion on tax holiday incentives for certain companies investing in certain areas and regions, and the implementation of import tax for raw materials in certain industries to increase domestic raw materials for boosting local industrial capacity. Besides, the proposed restructuring export tax for CPO and its derivatives are also being formulated to support CPO downstream industries (oleo chemicals, biodiesel, and specialty fat).
Investment Acceleration
In general, increased investment in machineries will increase economic capacity. Investment activities in 2010 showed a growth in machineries investment which continued to increase (Chart 13). In line with the increased, capital stock data also continued to show some improvements. Based on the Survey of Business Activity (SKDU), investment activities in 2010 was mainly for new investments, and thus increasing production capacity.
This condition was quite different from that of in 2007[5] in which the increased in imports of capital goods was dominated by machineries and equipments and thus provide less improvement for the production capacity. This was because of new investments in some industrial sectors mainly intended to replace the old machineries with low production capacity due to depreciation. Besides investment in machineries, other investment which grew quite high in 2010 was transportation equipment.
Increased investment in this field was supported by favorable economic prospect of Indonesia which encouraged more activities in the transportation sector, both for goods and passengers. In terms of imported goods, increased investment during 2010 was concentrated on several sectors notably in telecommunication, transportation and manufacturing. However, in terms of disbursement of private foreign borrowing, electricity and industrial sectors had become the main investment sectors financed by foreign borrowing. This was due to multiplier effects of investment in these sectors in economic growth which was relatively higher than other sectors. Based on research conducted by Bank Indonesia using Cobb Douglas models and Panel Data method, it was found that the growth of Gross Domestic Fixed Capital Formation (GFCF) of 1% in the industrial sector and electricity sector has an impact on increasing the economic growth of each sector with around 0.7%. A study using Input-Output analysis 2005 also indicated a consistent finding as it is indicated that in general, electricity, construction and industry sectors have the largest multiplier effect on the economic growth. The high multiplier effect in the three sectors was in line with the linkage of these sectors with other sectors (backward and forward linkage). In industrial sector, subsectors with the largest multiplier effect on the economic growth are basic metal industry, food and textiles subsectors. [6]
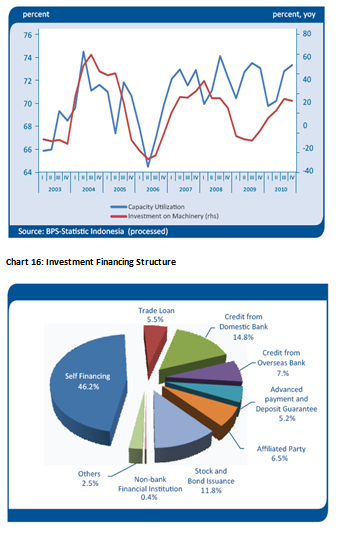
Surveys and researches had shown that infrastructure is an important factor in determining investment besides macroeconomic conditions. Survey by Bappenas (2008) showed that companies consider the easiness of import-export procedures, macroeconomic conditions and infrastructure development as the important factors that affect investment (Chart 14). One of infrastructure components currently considered to be quite important for development of future investment is electricity. A research conducted by Bank Indonesia showed that an investment increased in the electricity sector by 1% would increase total economic growth of 0.02%.[7] The development of electricity sector is deemed critical to the economy since it relates closely with the production activities of other sectors in the economy, especially mining and industrial sectors. Electricity sector is also deemed as a major sector for investment because investment in this sector will generate additional output in the economy. Development in electricity plays important role for the development of investment for non-residential group which utilizes a lot of machineries and hence are heavily dependent on the availability of electricity.
In general, investment growth is also influenced by the development of export and domestic consumption. [8] In 2010 exports reached a remarkable growth of 14.9%, which was the highest achievement in the last five years.
The robust export growth, coupled with strong domestic consumption, were factors underlying the increase of utilization capacity of industrial sector. As capacity utilization rise, accompanied by steady improvement of economic conditions, investment activities will also grow. In other words, the notable growth of investment was underpinned by the significance rise of utilization capacity following the robust exports and strong domestic consumption. Increased investment in the industrial sector has reduced utilization capacity in industrial sector to an average of 71% in 2010, slightly lower than it was 2009 which was around 72% (Chart 13).
Substantial rupiah appreciation in 2010 made the price of imported goods cheaper and led to the declining of imports of capital goods price index which hence prompting the increasing number of imported capital goods. During 2010, capital goods imports posted a substantial rise than that of in 2009, which then increase production capacity.
Increased investment was also supported by accommodative financing conditions. This was indicated by an increased of domestic financing in terms of realization of Initial Public Offering (IPO), corporate bonds issuance, investment loans, leasing and internal financing.
Realization of IPO in 2010 reached Rp 78 trillion, much higher than it was in 2009 at Rp 12.4 trillion which were mostly channeled into investment. As for corporate bond issuance, the realization in 2010 reached around Rp 34.7 trillion, also higher than realization in 2009 at Rp 25.8 trillion which some of the fund was allocated for investment as well. [9] On the banking front, investment loans and leasing also showed some improvements. In 2010, growth in investment loans and leasing reached 17% and 14% respectively. This is also consistent with the declining trend in real interest rates. The overall picture, however, indicated that the source of internal funds expected to still dominate the structure of corporate investment financing.
Based on a survey by Bank Indonesia on 413 companies representing 26 provinces in 2009, sources of financing investment using internal funds reached 46.2% of the total financing requirement (Chart 16). Domestically, increased investment was driven by improved business confidence for investment. This can be seen from the improved business sentiment during 2010 based on various surveys taken. Business Tendency Survey conducted by National Bureau of Statistics showed that Business Tendency Index indicated the upward trend since early 2010. Improved business conditions are driven mainly by increased demand from domestic and overseas, escalating selling price and demand for input goods. Meanwhile, according to the Survey of Business Activity of Bank Indonesia, the company’s investment plan has shown the same trend. Increased investment is also in line with positive perceptions of Indonesia’s economic prospects as indicated by positive perceptions on 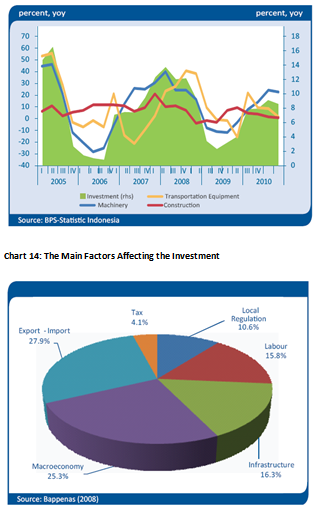
Indonesia’s macroeconomic conditions reflected in positive trend of government debt ratings.
This positive development is also in line with consumer confidence in future economic expectations and business community optimism to invest in Indonesia. Economic Expectations Index for all income groups taken from the Consumer Survey by Bank Indonesia also showed some improved expectations.
The endeavor to enhance investment climate also continued during the course of 2010 by relaxing regulations and simplifying investment procedures. Of significance was the implementation of National Single Window which served as a single point services for customs and ports services. NSW has been implemented at Tanjung Priok, Tanjung Perak, Tanjung Emas and Belawan harbors and Soekarno Hatta Airport. The
Implementation of NSW aimed at speeding up the process of import and export and thus encourages greater international trade. Furthermore, an adjustment on Negative Investment List has been undertaken to enhance simplicity, certainty, investment attraction, and investment climate of the country. Revision of policies on procurement of government goods/services also been published. Coordination between the Ministries of
Finance, Bappenas and Investment Coordinating Board has also been done to secure a smooth implementation of infrastructure projects as well as to provide an income tax exemption as stipulated under Article 22 for goods imported for upstream oil and gas activities under Joint Operating Contract.
Realization of electrical infrastructure projects showed a positive development with the completion of several new power plants. Following Indonesia’s target to achieve 10,000 MW of power plant project in Phase I, several projects on Java were completed in 2010, i.e. Suralaya and Labuan Indramayu power plants. Apart from those government projects, a positive development also manifested in the completion of verification process by State Financial and Development Auditor (BPKP) on several privately-owned power plants (Independent Power Producer/IPP) which previously experienced a temporary suspension. All of those IPP, which located outside Java, are expected to operate commercially within the next two to three years. Albeit those positive developments, electricity infrastructure project still have some obstacles which lead to the slow completion of electrical projects. Those hindering factors include difficulties in handling land acquisition, overlapping with the use of other sectors, relocation due to unfavorable soil conditions and weather factors which not supportive for the construction of physical buildings.
Toll road projects in 2010 have also shown some progress in line with the operation of several new road segments. Up to now, from a number of road projects of trans Java and non-trans Java, three toll roads which already in operation in 2010 are Pejagan Kanci toll road, Jakarta
Chart 17: Foreign and Domestic Investment: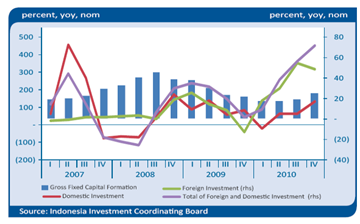
Outer Ring Road W21 and Bogor Ring Road. Meanwhile, other projects that are still in the process of acquiring concession yet have shown positive developments. Some projects can continue the construction because already get business partner and provide a commitment to raise working capital. To accelerate completion of highway projects, the government also has provided funds through the General Services Agency, Toll Road Regulatory Body (BLU-BPJT) for land acquisition. Moreover, the draft of Land Acquisition Act is expected to be completed by 2011 so as to support on-time completion of road and electricity projects.
Chart 18: Realization of FDI:
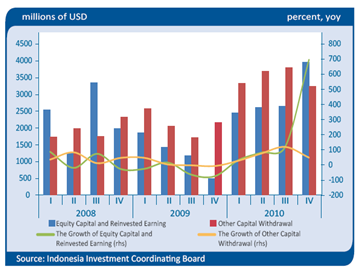
Foreign investment continued to play a crucial role in supporting the firm performance of investment following the improved perception of investment climate in Indonesia. Based on data from the Investment Coordinating Board (BKPM), the increasing realization of new investment and Investment Company that has obtained a business license in 2010 mainly from the realization of investment Foreign Direct Investment/FDI (Chart 17). Investment realization, both for FDI and Domestic Investment (PMDN), during 2010 reached Rp 208.5 trillion or soared by 42.6% compared to 2009, far exceeding the target for 2010 set at Rp 160 trillion. Investment data from other foreign investors particularly in Equity Capital, Reinvested Earning, and other capital grew at the same direction during the course 2010 (Chart 18). Besides in FDI, the increase in investment financing from overseas also reflected by the increase of Private Overseas Loans. Actual Private Overseas Loans in 2010 has shown an increase compared to 2009, especially for non tradable sectors. Other important sectors, such as industry and gas, electricity and water, also experienced some improvements in financing (Table 5). Meanwhile, the realization of the issuance corporate bonds abroad from January to October 2010 has reached about USD 2.7 billion,
around 87% of the plan during 2010. [10] Some of corporate bonds issuance was aimed for financing the investment, while others were for refinancing. The increase in foreign investment realization is in line with many positive reports about Indonesia as an investment destination. OECD, for instance, in its report on Investment Rules G-20 (July 2010) stated that Indonesia along with seven others in G20 countries (Australia, Brazil, Canada, China, India, Saudi Arabia and South Africa) have implemented investment regulation with the trend toward liberalization of overseas capital flows or a better regulatory practices. Other positive perception is the increase in Indonesia’s competitiveness ranking from 54th position (2009) to 44th (2010) according to the Global Competitiveness Index (September 2010) and increase Indonesia’s ranking as an investment destination country other than the BRIC countries from 6th to 2nd, according to UK Trade and Investment (2010). Before the global crisis of 2008, investment activities in Indonesia was quite comparable with neighboring countries in Asia although still lower than China, India and Vietnam. The share of investment activities in Indonesia to GDP is relatively similar to the conditions in ASEAN countries, between 20% -30% of GDP (Chart 19).
Likewise, investment growth is relatively equivalent with other countries in Asia. But when global crisis struck in 2008, investment growth in Indonesia was among the highest in Asia, although in 2009 was lower than India, China, and Vietnam. In 2010, investment in Indonesia grew by 14.9% with a share to GDP by 32%. The investment performance in Indonesia is affected by some factors such as interest rates, exchange rates, inflation, macroeconomic conditions and government capital expenditure. In 2010, Indonesia interest rates was relatively high if compared to other countries, resulting in interest rate differential which is notably high and eventually serves as the main attraction for foreign capital inflows (Chart 20). Massive foreign capital inflows pushed rupiah to become significantly appreciated which causes the import price becomes cheaper and provide ample opportunity for economic actors to increase its investment in imported capital goods needed in the production process.
Chart 19: Investment in Asia Countries:
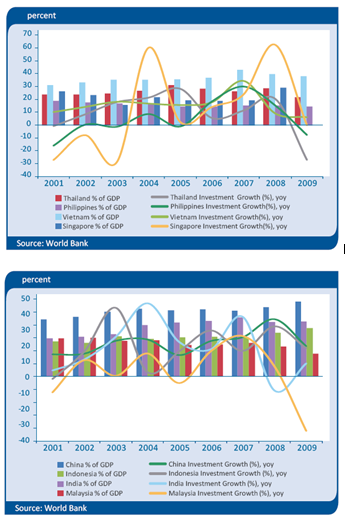
Table 5: The Growth of Private External Debt by Sectors
In addition, recent developments and good prospects of the Indonesian economy also attract foreign investment in the form of FDI to come to Indonesia. However, with inflation rate relatively higher than other countries in the region, FDI into Indonesia was relatively lower than it was in other countries of the region (Chart 21 and 22). Meanwhile, the government’s role as an accelerator in the economy reflected in government investment expenditure by capital expenditure. In 2010 the Indonesian Government capital expenditure was only about 1.2% of total GDP, lower than in other regional countries, especially Vietnam and Malaysia (Chart 23). In line with the development of these investments, since 2008 Indonesia’s GDP growth was quite high if compared with countries in the region; although still lower than China, India and Vietnam (Chart 14).
Some obstacles to economic growth and investment remain to be observed. Country Diagnostics Studies by ADB (2010) revealed some problems which could hamper Indonesia’s economy to grow higher. Some key issues including inefficiency in financial intermediation, especially for small and medium enterprises, inadequate human resources in certain industries, infrastructure problems like roads and electricity, macro and micro economy risks, low quality technology and low export growth, especially industrial export. In line with ADB’s diagnosis, some indicators related to the above problems remained at low level in the Global Competitiveness Index 2010.
Chart 20: Lending Rate in Asia Countries: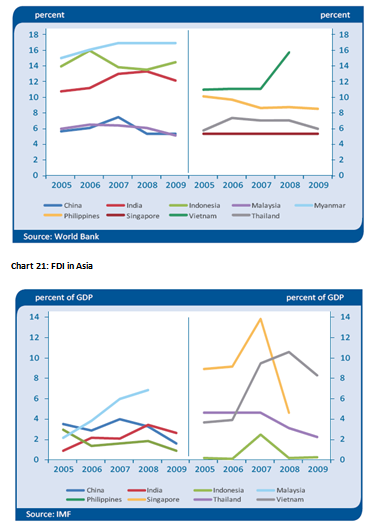
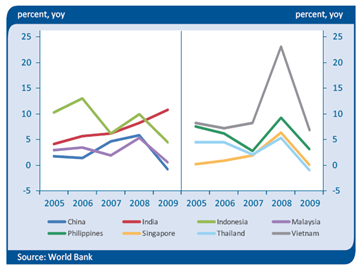
Based on their assessment, infrastructure’s quality is slightly improved from 2009 but still below the neighboring countries like Malaysia, Thailand, China and Singapore. Some types of infrastructure even have received a considerably low ranking such as for Ports, roads and electricity which ranked respectively 96, 84 and 97 out of 139 countries surveyed. Indonesia’s institutional quality was also posed challenging problems and has a declined from 58 in 2009 to 61 in 2010. The above conditions certainly present profound quandaries for the Government to further increase the rate of investment and economic growth.