Approaches to Cost-Volume-Profit (CVP) Analysis
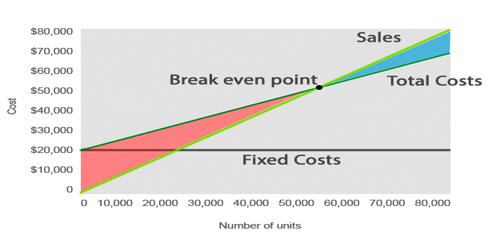
Cost-volume-profit (CVP) analysis is used to determine how changes in costs and volume affect a company’s operating income and net income. CVP analysis requires that all the company’s costs, including manufacturing, selling, and administrative costs, be identified as variable or fixed. CVP analysis is only reliable if costs are fixed within a specified production level.
(1) Contribution Margin Statement Approach
Break-even point (BEP) and other required cost volume profit relationships can be explained through contribution margin by following the variable costing income statement approach under which all fixed costs of the period are deducted out of the contribution margin of the same period. The contribution margin is equal to total revenue less total variable costs. Alternatively, the unit contribution margin (UCM) is the unit selling price (USP) less than the unit variable cost (UVC). Only the variable costs vary proportionally to the level of outputs or sales. The contribution margin per unit is the amount each unit sold contributes to (1) covering fixed costs and (2) increasing profit.
(2) Equation or Formula Approach
The most often practiced approach of cost volume profit analysis is the equation or formula approach. In fact, we use the equation approach to the solution of CVP analysis instead of the graph or the income statement. We know that total revenues are found by multiplying unit selling price (USP) by quantity sold (Q). Also, total costs are made up firstly of total fixed costs (FC) and secondly by variable costs (VC). Total variable costs are found by multiplying unit variable cost (UVC) by total quantity (Q). The contribution margin ratio is the contribution margin per unit divided by the selling price per unit.
As we know,
Sales= Variable expenses + Fixed expenses + Net profit
If sales volume= Q units, variable cost per unit = V, total fixed cost= FC and selling price per unit = S, then the equation can be simplified as;
QS = QV+FC+Profit
or, QS-QV= FC+Profit
or, Q(S-V)= FC+ Profit
Simplifying the equation, we get:
Q = FC+Profit/S-V
Sales unit = FC+Profit/CMPU
Where,
S-V= CMPU
Above equation or formula can be applied to find out anyone the unknown value of the variable either fixed costs or variable costs.
In order to compute the sales revenue instead of the sales units the following formula is used:
Sales Revenue = Sales Units x Selling price per unit (SPPU)
Note: total fixed costs are used rather than unit fixed costs since unit fixed costs will vary depending on the level of output. It shows how operating profit is affected by changes in variable costs, fixed costs, the selling price per unit, and the sales mix of two or more products.