Mutual Fund Performance: An analysis of Mutual Funds’ return
compare to the Market Return
Mutual Fund is a Capital Market Investment Vehicle. In Bangladesh there are 48 Mutual Funds under 17 Asset Management Companies. This paper focused on evaluating the performance of 48 growth oriented mutual funds on the basis of weekly returns compared to market returns. Risk adjusted performance measures suggested by Jenson, Treynor, Sharpe and statistical models are employed. It is found that, most of the mutual funds have performed better according to Jenson and Treynor measures but not up to the benchmark on the basis of Sharpe ratio. However, most of the mutual funds are diversified and have reduced its unique risk. The growth oriented funds have performed better in terms of total risk and the funds are offering advantages of diversification and professionalism to the investors. So, mutual funds perform better with their expertise.
Introduction
A mutual fund is a type of professionally managed investment fund that pools money from many investors to purchase securities. While there is no legal definition of the term mutual fund, it is most commonly applied only to those collective investment vehicles that are regulated and sold to the general public. They are sometimes referred to as Unit Fund, Collective Fund. Most mutual funds of Bangladesh are close-ended; meaning a collective investment scheme that has a fixed number of shares which are not redeemable from the fund and the shares can be purchased and sold only in the market.
According to basic financial theory an investor can reduce his risk by holding a portfolio of assets instead of only one asset. This is because by holding all your money in just one asset, the entire fortunes of your portfolio depends on this one asset. By creating a portfolio of a variety of assets, this risk is substantially reduced. No Mutual fund investments are totally risk free. In fact, investing in mutual funds bears the same risk as investing in the equities, the only difference is that due to professional management of funds the controllable risks are substantially reduced. Currently there are two types of mutual fund in Bangladesh;
a) Open-Ended Mutual Fund: Open-end mutual funds must be willing to buy back their shares from their investors at the end of every business day at the net asset value computed that day. Most open-end funds also sell shares to the public every business day; these shares are also priced at net asset value. A professional investment manager oversees the portfolio, buying and selling securities as appropriate. The total investment in the fund will vary based on share purchases, share redemptions and fluctuation in market valuation. There is no legal limit on the number of shares that can be issued in Bangladesh.
b) Close-Ended Mutual Fund: A closed-end fund has a stipulated maturity period which generally ranging from 5 to 10 years. Closed-end funds generally issue shares to the public only once, when they are created through an Initial Public Offering (IPO). Their shares are then listed for trading on Dhaka stock exchange. Investors who no longer wish to invest in the fund cannot sell their shares back to the fund (as they can with an openend fund). Instead, they must sell their shares to another investor in the market; the price they receive may be significantly different from net asset value. It may be at a “premium” to net asset value (meaning that it is higher than net asset value) or, more commonly, at a “discount” to net asset value (meaning that it is lower than net asset value). A professional investment manager oversees the portfolio, buying and selling securities as appropriate.
Regulatory framework of a mutual fund
Formation of mutual fund
As per the wmwKDwiwUR I G·‡PÄ Kwgkb (wgDPz¨qvj dvÛ) wewagvjv, 2001 a mutual fund is formed as a Trust under Trust Act, 1882 and the Trust Deed is to be registered under Registration Act, 1908. Before registration of the Trust Deed it has to be approved by the Securities and Exchange Commission.
Key players involved in mutual fund operation
There are four parties involved in floatation of a mutual fund namely:
Sponsor – Any bank or financial institution or any other limited company who initiates the fund by subscribing minimum 10% of total fund size.
Key role – The Sponsor constitutes the fund by virtue of Trust Deed.
Trustee – Any bank or financial institution or any other limited company registered by the SEC to act as Trustee.
Key role – The Trustee is the guardian of the fund and holds all capital assets of schemes of the Fund in trust on behalf of the unit holders.
Asset Management Company – any bank or financial institution or any other limited company registered by the SEC to act as an Asset Management Company.
Key role – The Asset Management Company structures, operates and manages the schemes of the Fund approved by the Trustee and the Commission and in accordance with the provisions of the Trust Deed and the Rules.
Custodian – any bank or financial institution or depository or any other limited company registered by the SEC to act as Custodian; with special permission by the SEC the Trustee and the Custodian can be the same institution.
Key role – The Custodian keeps the securities of the Fund in safe custody.
Minimum size of mutual fund
The minimum size of any mutual fund – for open-end mutual fund is Tk 60 million while for close end mutual fund is Tk 30 million. In both cases the Sponsor has to subscribe minimum 10% of the total fund.
However, the SEC published an amendment to the said wewagvjv for public opinion mentioning minimum size of a mutual fund is Tk 500 million.
Fees and expenditures
Limitation of expenses:
- Expenses relating to formation of the Scheme shall not exceed 5% of the proposed Fund.
- Total expenses (other than formation expenses) of the Scheme shall not exceed 4% of the net asset value based on weekly averages.
The fees and expenditure related to a mutual fund to be incurred are given below:
- Expenses relating to formation – Includes formation fee @ 1.0%, banker to issue fee @ 0.10% of amount collected by the banks, post-issue expenditure (negotiable), expenses relating to conduct lottery (at actual)
- Scheme registration and annual fee – Registration fee payable to SEC @ 0.20% of the fund size and annual fee is @ 0.10% of the fund size or Tk 50,000 whichever is higher.
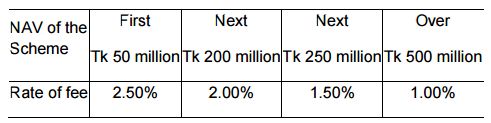
- Management fee – The Scheme will pay annual management fee to Prime Finance Asset Management Company Limited on the basis of weekly average NAV of the Scheme as follows:
- Trustee fee – Presently market practice is between Tk. 5-10 Lac per year.
- Custodial fee – Presently market practice is @ 0.10% of the value of security.
- CDBL fee – Security deposit ranging from Tk 100,000 to Tk 500,000; IPO fee @ 0.025% on issue amount; annual fee ranging from Tk 25,000 to Tk 100,000.
- Listing fee – initial listing fee upto Tk 100 million is @ 0.25% and above Tk 100 million is @ 0.15%; annual listing fee ranging from Tk 10,000 to Tk 100,000.
- Audit fee – Negotiable.
Investment policy (subject to approval of Shariah Board)
- The Fund can invest in both listed and non-listed securities.
- The Fund can invest in the shares of the companies whose basic businesses are in consistence with the Shariah Law. Although no universal consensus exists among contemporary Shariah scholars on the prohibition of companies, most Shariah boards have advised against investment in companies involved in the activities of:
- Conventional banks, insurance and leasing companies,
- Alcohol,
- Pork related products,
- Tobacco,
- Weapons and defense, and
- Entertainment (Hotels, casinos/gambling, cinema, pornography, music etc.).
(3) After screening out companies with unacceptable primary business activities as mentioned above the Fund may invest in shares of other companies if
- the total debt of the investee company is equal to or less than 33% of the trailing 12 month average market capitalization of the company;
- the sum of cash or interest bearing securities of the investee companies is less than or equal to 33% of the trailing 12 month average market capitalization of the company;
- the account receivable is less than or equal to 45% of the total assets of the company.
(4) The Fund may also invest in other Shariah compliant instruments as and when they are available for investment, specifically:
- in participation term certificates, mudaraba certificates, musharika, murabaha, term finance certificates and all other asset backed securities;
- in contracts, securities or instruments of companies, organizations, and establishments issued on the principles of Bai’ Mu’ajjal, Bai’ Salam, Istisna’a, Mudaraba, Murabaha and Musharika;
- in the form of Riba-free cash deposits with Islamic banks or financial institutions with the object of maintaining sufficient liquidity to meet the day to day requirement and to take advantage of suitable investment opportunities as and when they arise;
- in other instruments that may be allowed by the wewagvjv and the Shariah Law.
Investment restriction
- Money to be collected under the Fund will be invested in encashable/transferable securities whether in capital market or money market, privately placed debentures, preferential shares or securitized debts and assets.
- Not less that 75% of the total assets of the fund will be invested in capital market.
- Not more than 25% of the total assets of the fund will be invested in Fixed Income Securities (FIS).
- Not more than 15% of the total assets of the Fund will be invested in Pre-IPOs at one time.
- All investment will be made in the name of the Fund.
- The Fund will not buy its own unit.
- The Fund will not invest more than 10% of its total assets in any one particular company’s shares/debentures.
- The Fund will not invest more than 15% of any company’s paid-up capital.
- The Fund will not invest more than 20% of the fund in shares, debentures or other securities of a single company or group.
- The Fund will not invest more than 25% of its total assets in shares, debentures or other securities in any one industry.
The Fund will not involve in option trading or short selling or carry forward transactions.
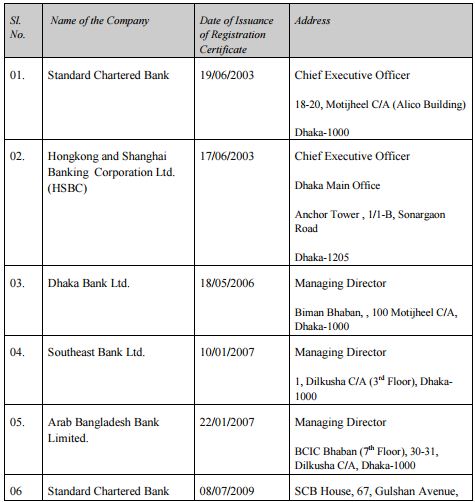
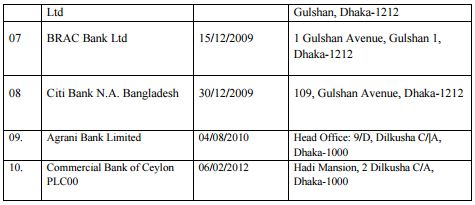
List of Asset Management Companies, Custodians and Trustees;
List of Security Custodians
List of Trustees of Asset Backed Securities
Objective of the Study
The main objective of this report is to evaluate the performance of growth oriented mutual funds and along with that to present an extensive analysis about the factors which directly or indirectly impact the price and the overall performance of the mutual funds as a whole. The considerations underlying the performance evaluation of mutual funds is a matter of concern to the fund managers, investors and researchers alike. The present paper attempts to answer two questions relating to mutual fund performance;
- Whether the growth oriented Mutual Fund are earning higher returns than the benchmark returns (or market Portfolio/Index returns) in terms of risk.
- Whether the growth oriented mutual funds are offering the advantages of Diversification, Market timing and Selectivity of Securities to their investors.
This paper attempts to answer the questions raised, by initially describing some basic concepts and later by employing a methodology which was used by Jenson (1968), Treynor (1965), and Sharpe (1966) and finally drawing appropriate conclusions. More than 30 growth oriented mutual funds are selected for the purpose of this study. The study period is the total period of those mutual funds life period. In this study, the period is selected more than 30 months and some are 20 months or less those are new in market. The data source is weekly Net Asset Values (NAVs) published in “The DSE website.” Then, the weekly NAVs data is converted into monthly NAVs value for our data consideration and uses in further calculation.
Research & Methodology:
As the topic is related with the return of mutual funds, I needed different types of information to better evaluate their performance. I have used some information based on NAV, Price, Trade value, Dividend, Turnover of the mutual funds concerned and data related to the market index.
Research Design:
The performance of mutual funds have been analyzed using various ratios such as Jension measure, Sharpe, and Treynor- a very much effective ratios calculated in order to derive an unbiased analysis. Along with that, statistical models such as average, correlation and standard deviation have been developed to make the study of mutual funds even more realistic. I have put some light on the diversification and selectivity pattern of mutual funds and even compared against the DSEX. The analysis and comparison have been conducted to show more evenly how the mutual funds are actually performing. The alpha and volatility pattern have been analyzed and was the compared against their annualized return. In short, technical and fundamental analyses have been conducted for an in-depth study about the performance of mutual funds. The performance of the more than 30 mutual funds will be unfolded as the reader proceeds.
Data Analysis:
As per the project, to analysis the mutual funds data with Jenson measure along with other model, the monthly NAVs and general index data are converted in to the annualized data. Then, I use the different financial model as per the methodology like CAPM model, regression model and so on. Here, the risk free rate is taken as per Treasury bill rate and calculating the return on basis rate. In this report, to show the actual condition of mutual funds, use Sharpe and Treynor Index. In interpreting the strength of relationships between variables, the guidelines suggested by Rowntree (1981) were followed.
In the core of the fund analysis activity lie the twin pursuits of judging return and risk. Stripped of a lot of the complexity, this task involves determining a fund’s average performance over a period of time. Standard deviation gives a quality rating of an average. A high Standard Deviation may be a measure of volatility, but it does not necessarily mean that such a fund is worse than one with a low standard deviation.
Findings and Analysis:
Annual Return Evaluation against DSEX:
First I have calculated monthly return based on monthly adjusted NAVs then converted to annual return. It has been compared with the market return, it is not good monthly return of those mutual funds which are lower than the market return. Some of the mutual funds’ return are very close to market return but a few mutual funds’ return are very high and some are very low. In the Graph 1 we can see market average annual return is 17.26 percent, based on market return I have evaluated all mutual funds.
When an investor expects for return he must think about risk. So how much risk would take to get a return. From my analysis I have found that all the mutual funds have low risk than market. But only ICB’s mutual funds are high risky.
Prime Financial First Unit Fund (PFFUF) has earned an average return of 17.47 percent as against the market return 17.26 percent. NLI First Mutual Fund has earned an average return of 16.18 percent which is below the market return but it is almost close to the market return. LRGLOBAL Company’s mutual fund named DBH 1st Mutual Fund, GREENDELMF, AIBL 1st
Mutual Fund, MBL 1st Mutual Fund, LRGLOBAL BD MF One have earned very poor return compare to the market. AIMS 1st Mutual Fund earning is very poor it’s a negative return but AIMS other funds like GRAMEEN One earning is 17.55 percent which is above the market return & Reliance One 1st M.F. has earned 10 percent which is below the market. RACE have earned below the market return. In the table 1 we can see a very high return of ICB. ICB 1st MF has earned 88 percent, ICB 2nd 177 percent, ICB 3rd 152 percent. ICB’s average annual return is too high compare to the market and it is abnormal return for the industry.
Risk adjusted performance measure:
I have calculated Sharp ratio, Treynor ratio, Jensen ratio (Alpha), Standard Deviation and Beta which all are associated with risk. To measure the return a fund manger should adjust the risk. A fund manger measures how much risk would take for a certain return for a portfolio. For risk measurement two types of risk are associated, Systematic Risk and Unsystematic Risk.
Systematic risk is the risk inherent to the entire market or an entire market segment. Systematic risk, also known as “Undiversifiable risk,” “volatility” or “market risk,” affects the overall market, not just a particular stock or industry. This type of risk is both unpredictable and impossible to completely avoid. It cannot be mitigated through diversification, only through hedging or by using the right asset allocation strategy. Unsystematic risk, also known as “nonsystematic risk,” “specific risk,” “diversifiable risk” or “residual risk,” can be reduced through diversification. By owning stocks in different companies and in different industries, as well as by owning other types of securities such as Treasuries and Private securities, investors will be less affected by an event or decision that has a strong impact on one company, industry or investment type. Unsystematic risk reduces total risk for a portfolio because systematic risk is same for all portfolios.
In addition, Sharpe ratio and Treynor ratio is calculated in order to evaluate the performance of the 27 mutual funds. Sharpe ratio is the returns generated over the risk free rate, per unit of risk.
Risk in this is taken to be the fund’s standard deviation.
A fund with a higher Treynor ratio implies that the fund has a better risk adjusted return than that of another fund with a lower Treynor ratio. In the Graph 2 & 3, Most of the funds have positive Treynor ratio and Sharp ratio, some have negative ratio. DBH 1ST MF, AIBL 1ST MF, AIMS 1ST MF, MBL 1ST MF indicate negative Sharp ratio and Treynor ratio, that means inferior performance against the market return. The main reason for negative return is portfolios returns are lower than risk free return. On the other hand, PFFUF, RLIMF, NLI 1st MF, GRAMEEN MF One, Reliance One 1st MF, EBL 1st MF, Trust Bank 1st MF, Janata 1st MF, POPULAR Life 1st MF, EBL NRB 1st MF, AB Bank have positive Sharp ratio and Treynor ratio indicate that good performance in the market. 1st MF, ICB 1st, ICB 2nd, ICB 3rd, ICB 4th, ICB 5th, ICB 6th have very high Sharp ratio and Treynor ratio which indicate superior performance in the market.
The basic idea of Jensen’s Measure is that to analyze the performance of an investment manager we must look not only at the overall return of a portfolio, but also at the risk of that portfolio. Jensen’s measure is one of the ways to help determine if a portfolio is earning the proper return for its level of risk. If the value is positive, then the portfolio is earning excess returns.
Recommendation and Conclusion:
Mutual funds have emerged as the best in terms of variety, flexibility, diversification, liquidity as well as tax benefits. Besides, through mutual funds investors can gain access to investment opportunities that would otherwise be unavailable to them due to limited knowledge and resources. Mutual funds have the capability to provide solutions to most investors’ needs, however, the key is to do proper selection and have a process for monitoring and controlling. In Bangladesh, the mutual fund industry is at a growing stage and it is incorporating a higher number of new funds each year. From the above analysis, it can be noted that the growth oriented mutual funds have not performed better than their respect to volatility most of the funds have not performed better. Growth oriented mutual funds are expected to offer the advantages of diversification, market timing and selectivity. In the sample, funds are highly diversified and because of their high diversification they have reduced total risk of portfolio. Whereas, other mutual funds have low diversified portfolio and have more risk. Further, the fund managers of the mutual funds are found to be poor in terms of their ability of market timing and selectivity.
In my findings and analysis part I have found most of the mutual funds have been earning average return. Strengthening the research I have taken 27 mutual funds’ 34 months adjusted NAVs but lack of information of DSEX I have got only 21 months DSEX. So there is a small difference of return between DSEX and Mutual Funds. Another important issue is ICB’s high return which is abnormal scenario compare to the industry average return. The main reason is ICB has six mutual funds which have very old portfolio and they retained a big number of profits. AMC (Asset Management Company) has to share minimum 70 percent profit every year as AMCL rules but they used the advantage of government organization and retained profits. Last 4 years they declared respectively 500, 600, 700, 800 percent dividend which are really huge dividend for the industry and these dividends have made the abnormal return.
For broadening the depth of the capital market, it is necessary to float more mutual funds since these are good instruments of mobilizing savings and providing investment opportunities to small savers. Although still small in size, mutual funds have contributed toward broadening the base of the country’s capital market and helped the investors to gain high and relatively secure returns. Despite bright prospects of mobilizing savings and providing investment opportunities to small savers and the ability to meet different risk profiles through providing a wide range of products, one major factor as to why the mutual funds have not emerged as a preferred saving mode is the lack of availability of quality shares and the underdeveloped state of the capital market.