Financial Highlights of the company:
The performance of the Bank, during the period under review (2003 – 2007), is more significant simultaneously in development and achievements of continuous growth rate in all the areas of banking operations.
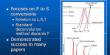
Operating Profit:
Operating Profit is a measure indicating a company’s earning from its own operation. The operating profit of AB Bank is increasing year by year and it is good sign for the company and in year 2007 the operating profit increase more than triple than the year 2006.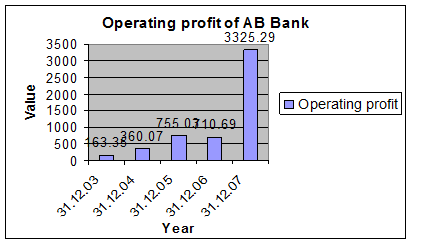
Deposit Collection:
Deposit is one of the principle sources of fund for investment of commercial Banks and investment of deposit is the main stream of revenue for a particular Banking business. So it is important to give a close eye on the efficiency in collection of deposits.

Investment: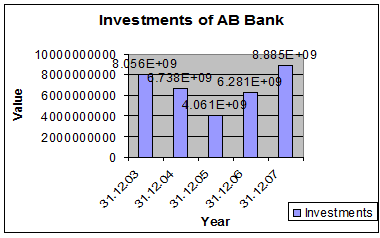
The Investment of AB Bank is fluctuating year by year. In the year 2005 the investment is low compared with other years and in the year 2007 there is highest investment.
Import Business:
AB Bank have a big contributebution in import business of our country.
The total volume of import business of the Bank is increasing year to year though it is not so good sign for our economy and during the year 2007 the import volume stood at Tk. 48441crore.
Export Business:
Bank always encourage export business and provides extra facilities to customers who are engaged with export business.
From the above figure, I am able to conclude that, total volume of the export business is increasing year to year and during the year 2007, the growth of the export business of AB Bank has significantly been increased. It stood at Tk.20677 crore as of December 31, 2007 against Tk. 17876 crore of the previous year.
Foreign Remittance:
AB Bank facilitates the transfer of funds outside the national boundary which is known as foreign remittance.
Foreign Remittance of the Bank stood at Tk.156.36 crore as of December 31, 2007 as against Tk. 131.64crore in 2006.
Five years at a Glance: Figure in million TK.
Particulars | 2007 | 2006 | 2005 | 2004 | 2003 |
| Operating Profit(PBL & T) | 3,325.29 | 710.69 | 755.03 | 360.07 | 163.35 |
| Net Operating Profit(PBT) | 2,817.99 | 532.19 | 407.45 | 190.07 | 47.12 |
| Profit after Tax (PAT) | 1,903.49 | 532.19 | 162.45 | 90.07 | 17.12 |
| Authorized capital | 2,000.00 | 2,000.00 | 800.00 | 800.00 | 800.00 |
| Paid-up capital | 743.26 | 571.74 | 519.76 | 495.01 | 471.44 |
| Statutory & Other reserves | 2,072.54 | 1,456.47 | 826.33 | 623.99 | 592.10 |
| Shareholders Equity | 4,511.59 | 2,582.76 | 1,526.88 | 1,243.58 | 1,135.98 |
| Deposits | 53,375.35 | 42,077.00 | 27,361.44 | 28,299.23 | 27,260.16 |
| Loans & Advances | 40,915.35 | 31,289.25 | 21,384.63 | 17,008.50 | 20,435.24 |
| Investment | 8,884.60 | 6,281.37 | 4,060.95 | 6,738.15 | 3,335.87 |
| Fixed Assets | 2,381.00 | 1,148.46 | 370.06 | 276.67 | 285.20 |
| Total Assets | 63,549.86 | 47,989.34 | 33,065.40 | 32,513.48 | 32,969.45 |
| Import Business | 48,441.35 | 42,860.24 | 23,150.85 | 19,266.00 | 19,281.23 |
| Export Business | 20,676.61 | 17,876.15 | 12,595.20 | 10,100.00 | 9,743.08 |
| Earning per Share (TK.) | 256.10 | 93.08 | 31.26 | 18.19 | 3.63 |
| Return on Equity-ROE (%) | 42.19 | 20.61 | 10.64 | 7.24 | 1.53 |
| Return on assets-ROA (%) | 3.41 | 1.11 | 0.50 | 0.39 | 0.07 |
| Price Earning Ratio(Times) | 100.00 | 9.59 | 11.68 | 20.95 | 53.89 |
| Capital Adequacy Ratio | 10.75 | 9.23 | 9.17 | 9.09 | 9.17 |
| NPL as % of Advance | 4.31 | 4.02 | 8.21 | 11.37 | 19.25 |
| Advance Deposit Ratio (%) | 76.66 | 74.36 | 78.16 | 60.10 | 60.10 |
| Asset Utilization Ratio (%) | 77.43 | 76.37 | 72.60 | 68.48 | 62.58 |
Financial Analysis:
Analyzing the financial performance is so much essential for each and every business institution as well as for the Banking institutions to assess their past financial performance and to identify the sources, where the necessary improvement is needed to perform better in the future and to meet the future challenges by taking effective business strategy.
Financial analysis typically is associated with Quantitative analysis. So I would like to analysis this method–
Quantitative Analysis:
Quantitative analysis can be done with different analysis, Ratio analysis is one of the most well known analysis of them. Ratio analysis involves the methods of calculating and interpreting the financial ratios to analyze the firm’s relative financial performance. The main purpose of this analysis is to analyze and monitor the firm’s financial performance, so, that the interested parties (both the external and internal) can realize the firm’s actual performance easily and conveniently, which is so much essential for the parties. There are several ratios that help a particular analyst to analyze the past performance of a particular firm and to diagnose the various relevant variables, which are important for improving the future operation of that firm. The financial ratios can be divided into five broad categories for convenience and they are enumerated below —–
1. Liquidity Ratio
2. Operating Efficiency Ratio
3. Profitability ratio
4. Capital Ratio
5. Market Ratio
Generally, these five groups of financial ratios are used to analyze a particular firm’s past financial performance and to identify the sectors where the necessary improvement is needed to make the future performance of the firm far better than the past. It is also mentionable that there are three types of ratio comparison and they are
- Cross-Sectional Analysis: involves comparison of different firms’ ratios at the same point of time.
- Time Series Analysis: involves evaluates performance over time by observing the trend of a particular ratio.
- Combined Analysis: combines both the Cross-Sectional and Combined Analysis.
And in this section of the report I am going to evaluate the financial performance of the AB Bank Limited over time by calculating and interpreting some common ratios.
All the important ratios to analyze and evaluate the financial performance of the AB Bank Limited are calculated and interpreted in the following next pages:
Liquidity Ratio:
It measures a firm’s ability to meet up or satisfy its short tem obligations, as they become due. The commonly used liquidity ratios are —-
Current Ratio:
A measure of liquidity, calculated by dividing the current assets by current liabilities. It shows the level of current assets that a particular firm has against per Taka of current liabilities of that firm. So the equation becomes—
“Current ratio = Current Assets / Current Liabilities”
Interpretation: We know that, the current ratio measures a firm’s liquidity by measuring the portion of its current asset relative to its current liabilities and the higher the ratio, the higher the liquidity of the firm. So, after observing the graph shown above, it can be said that the company’s current ratio is fluctuating year to year and Bank’s current ratios are always below the standard level (2), which is not good and risky for the Bank. In 2005 it was lowest, and then it is increasing, which is good for the Bank and the reason is that the Bank has maintained a steady level of current liabilities during this period of time.
Operating Efficiency Ratio:
The ratio measures a particular Bank’s operating efficiency, which is the Bank’s ability to serve its customers in the most effective way by using least amount of resources (such as time, cost etc.). The following ratios are widely used to measure a particular Bank’s operating efficiency:
Operating Cost to Income Ratio:
It measures a particular Bank’s operating efficiency by measuring the percent of the total operating income that the Bank spends to operate its daily activities. It is calculated as follows:
“Operating Cost to Income Ratio = Total Operating Cost/Total Operating Income”
Interpretation: We know that this ratio measures the operating efficiency of a particular Bank my measuring the portion of the total operating costs relative to the total operating income of that Bank and the higher the ratio, the lower the operating efficiency and vice-versa. So, after observing the figure drawn above, I am able to say that, during the time period 2007 the operating efficiency of the AB Bank was increasing, which was a good sign, though at the year of 2006 it was increasing then the year 2005.
Total Asset Turnover: Total Asset Turnover indicates the efficiency with which the firm uses its assets to produce operating income. It is calculated by using a formula, the formula is –
“Total Asset Turnover = Total Operating Income /Total Asset”
Interpretation: We know that this ratio measures the return from per unit of total assets and the efficiency of the Bank in using its total assets to generate operating income and the higher the ratio, the higher the efficiency of the Bank in using its assets. So, after observing the given graph, I am able to say that the return from per unit of total asset, as well as the Bank’s efficiency in generating income is increasing year to year and the Bank generated the maximum level of turnover in year 2007 and lowest level of turnover in the following year 2003, it means the level of total asset turnover is increasing year by year which is a good sign for the bank.
Investment to Deposit Ratio:
It shows the operating efficiency of a particular Bank in promoting its investment product by measuring the percentage of the total deposit disbursed by the Bank as loan & advance or as investment. The ratio is calculated as follows:
“Investment to Deposit Ratio = Total General Investment/Total Deposit”
Interpretation: From the figure drawn above, I am able to say that, the Bank’s investment to deposit ratio is fluctuating year to year and in the year 2004 the Bank has disbursed the highest amount of investment, but after that there is a sudden fall of investment and at the year 2007 there is a slight increase.
Net Interest Margin:
This ratio helps us to determine the efficiency of a particular Bank by measuring the level of net interest income generated by that Bank from per Taka of interest bearing assets. It is calculated as follows:
“Net Interest Margin = (Interest Income – Interest Expense)/Total Earning Assets”
Interpretation: As we know that this ratio reveals us the level of net interest income generated by Bank by using it’s per Taka of earning assets, thus indicates the operating efficiency of the Bank. So after observing the figure shown above, I am able to say that, the level of net interest margin of the Bank is increasing year to year, which indicates that the Bank’s operating efficiency in generating interest income is increasing, which is a good sign for the Bank and the AB Bank has generated the maximum amount of net interest income in the year 2007 and the Bank should try further to improve its current level of Net Interest Margin, which will help the Bank to improve its value to the investors.
Interest Expense to Interest Income Ratio:
The ratio measures operating efficiency by measuring the level of interest expense of the Bank as a percent of the total interest income earned by that Bank and it is calculated as follows:
“Interest Expense to Interest Income Ratio = Total Interest Expense/Total Interest Income”
Interpretation: As the ratio shows the level of interest expense incurred by the Bank as a percent of the total interest income earned by the Bank, so, after observing the figure, I am able to say that the level of interest expense of the Bank is fluctuating year to year and the Bank provide maximum amount of interest in the year 2006 and after that the Bank’s interest expense fall in the year 2007, which is not so good for the Bank.
Profitability Ratios:
These ratios help us to evaluate the firm’s profits with respect to operating income, assets, or equity. Ratios are —-
Net Profit Margin:
It measures the percentage total operating income, that remains after all the costs and expenses have been paid. It is calculated as follows –
“Net Profit Margin = Net Profit after Tax/Total operating Income”
Interpretation: we know that this ratio shows us the portion of total operating income that remains after deducting all the costs and expenditure for particular period of time. From the above graph, it can be said that the company’s net profit margin is fluctuating year to year or over the time and the Bank has generated maximum amount of net profit margin in the year 2006 and lowest amount of margin in 2003.
Return on Total Assets (ROA):
It is also called Return on Investment (ROI) and it measures the overall effectiveness of management in generating profit with its available assets. It is calculated as follows —-
“ROA = Net Profit after Tax / Total Asset”
Interpretation: After having a careful view on the graph I am able to say that the Bank’s effectiveness to generate return by using its available assets is fluctuating year to year and the Bank has generated maximum amount of ROA in the year of 2007 and due to lack of efficiency in utilization of assets the Bank’s ROA falls in the minimum level in the year of 2003, 2004 and 2005.
Return on Equity (ROE):
It measures the return earned by the funds invested by the common stockholders. It is calculated as follows —
“ROE = Net Profit after Tax/Shareholder’s Equity”
Interpretation: The Company’s return on equity is Fluctuating year by year. The AB Bank has generated maximum amount of ROE in the year 2005, and after that there is slight decrease at the year 2006 and 2007. Which is not favourable for the AB Bank.
Capital Ratio:
This type of ratio analyze a particular Bank’s capital structure and help us to determine the level of assets financed by the Bank’s creditors and the level of assets financed by the firm’s shareholder’s funds. The common types of ratios are as follows:
Debt Ratios:
The ratio analyzes a firm’s debt position, which indicates the amount of other people’ money being used in the firm to generate profits by measuring the portion of total asset financed by the firm’s creditor. This ratio is calculated as follows —
“Debt Ratio = Total Liabilities/Total Asset”
Interpretation: After having a careful view on the graph, we can see that the Bank’s debt ratio is decreasing year by year, though the decreasing amount is not so high, the lowest level of debt ratio is in the year 2007.
Equity Capital Ratio:
The ratio shows the position of the Bank’s owners’ equity by measuring the portion of total assets financed by the share holders’ invested funds and it is calculated as follows:
“Equity Capital Ratio = Total Shareholders’ Equity/Total Asset”
Interpretation: From the figure, shown above it can be said that, from the year 2003 the Bank’s equity capital ratio is increasing year to year, which indicates that the Bank is emphasizing on shareholders’ funds to finance its total assets and the Bank has maximum level of equity capital ratio in the year 2007.
³Market Ratios:
Market ratios reflect a particular firm’s market value (which is value of the firm to the investors), as measured by its shares current market price to certain accounting values and the ratios are —–
Price – Earnings (P/E) Ratio:
it measures the amount that the investors are willing to pay for per taka of firm’s return. It is calculated as follows —-
“P/E Ratio = Market Price of Per Share/Earnings per Share”
Interpretation: It measures the level of price that the investors are paying for per taka of earnings offered by the Bank. So from the figure shown above I am able to say that – the investors has paid maximum amount of price for per unit in the year 2003, in which the Bank issued its share in the market and after that the ratio is decreasing year to year, which means the investors are paying less and less amount of price for the Bank’s earnings and this is not favourable for the bank.
Recommendation & Conclusion:
Observation and Recommendation for General Banking:
ABBL should include more differentiate product in their consumer product; like- Foreign Currency Deposit Account, Resident Foreign Currency Account etc.
They can improve their customer service introduced by call center, phone banking, given 24-hours banking etc.
Customers are not so much aware about different product. ABBL should be concern about it
Customers are not so much aware about different charges. They claim to the bank after debiting their account. ABBL can organize lift lets and paper materials to inform them before the imposition of new charges.
Complaint management system is not so good. Bank can set up a complaint box and customer can put the complain letter into the box. At the day end open the box screening the letter and try to solve the problem or send to relevant manager or departments.
More staffs need in front desk to attend the customers.
The software, which is used for giving customer service, should be improved.
Financial strategy should be improved.
For the advertising the product, they used normal staffs. They should appoint new employees for this segment. When these employees are for development, the normal official work is hampered.
They can launch credit card as a customer service.
Cash counter should be more systemic; because it’s a question about of security.
Observation and Recommendation for Credit Management:
ABBL should include more differentiate product in their consumer credit scheme; like- teacher loan, student loan, doctor credit scheme, personal loan for women etc.
A good linkage is essential between front desk office & credit office. If a Loan application declines, front office officials face customer queries and dissatisfaction.
Verification process needs to improve because customers do not want to disclose confidential information to unknown person.
To encourage loan repayment loan closing fees and early settlement fees need to restructure.
The management should emphasis more on the time lag between loan disbursement and loan recovery.
The credit department should expand; like- recovery, valuation etc
Head office and Branch communication gap should be minimize.
Loan facility should be increased.
Loan procedure should be clear and systematic.
Conclusion:
It is a great pleasure for me to have practical experience in AB Bank Ltd. This internship program is an integral part of MBA student. The main purpose of the report was to focus on the lending services to its valuable General Banking and the credit management provided by AB Bank as comprehensively as possible. Although I did not have much time to learn the whole procedures but it was supportive to understand and gather an initial banking management experience. As the long-term performance of any organization depends on its intake of qualified people and developing them to perform their best as a team, as well as individually.

Report on Overall activity on AB Bank ltd [part-1]