Introduction
Maz Tas Furniture Ltd is the Brand Name; MazTas™ furniture possesses capabilities that are fully integrated, from designing, prototyping, material selection and moulding through testing, assembling and distribution. Abreast of being a strong leading player in the market, all our-produced furniture is guaranteed to have met the stringent quality and standards.
MazTas™ Furniture Ltd has its own factory in Savar. Operating in a combined area of more than 12,000 square meter of factory and warehousing. Using fully mechanized and computerized system for manufacturing and designing, imported raw materials, and modern technology for manufacturing furniture of contemporary designs.
All our Products are tasteful, durable, functional and of competitive price. We offer a wide product range that can be tailored for customer requirement and most suitable for modern offices.
COMPANY PROFILE
Name of the company : MazTas™ Furniture Ltd.
Brand Name : MazTas™
Company Status : Private Limited Company
Belongs To : MazTas Group
Establishment Year : 1998
Registered Head Office : 125/A, Motijheel C/A, Dhaka.
BOARD OF DIRECTORS
|
|
| ||||||
| |||||||
|
| ||||||
| |||||||
NATURE OF BUSINESS
MazTas™ Furniture is an ancillary of A.A.L is one of the member companies of MazTas Group. A.A.L furniture unit uses the brand name MazTas™ . The flag ship company of the Group. As a good corporate, MazTas™ Furniture is involved in manufacturing of various types of home, Office, industrial and hospital furniture. Considering the environment issue MazTas™ furniture has designed its product line in such a way so that minimum pressure should be given on natural possessions. In order to reduce the pressure of natural resources that is timber MazTas™ furniture has chosen to use chip board/MDF as substitute of wood and is working relentlessly to develop furniture to cater the demand of the consumer.
STATE OF FINANCIAL NEEDED
Short Term Sources:
- Private sources
- Trade credit
Long Term Sources:
Executive Summary
MazTas™ Furniture has been riding a growth spurt, having discovered the high-end direct mail channel that gave us a push to new potential volumes through channels. Bolstered by appearances in specialty catalogs, we were able to develop another additional channel through distributors of office equipment that sell directly to corporations.
This annual business plan calls for another three years of accelerated growth. Because our sales growth has brought some working capital implications, we are carefully planning to manage growth and provide for steady cash flow.
We also expect to be profitable as never before. In all, this plan is a healthy company with good growth prospects, looking to manage its orderly growth in the near future.
Highlights
Industry Analysis
COMPETITORS
EXISTING Competitors
Acme Computer Furniture
Acme has been operating since the middle 1980s, and grew up with computer-related furniture. It was one of the first, certainly the first we are aware of, to develop personal computer desks and market through advertising in computer magazines. Today they are about twice our size. They have a very nicely done catalog and good relationships with two distributors.
Strengths: Good marketing, strong advertising budget, relationships with distributors, strong direct sales.
Weaknesses: The product is more standardized, and of lesser quality, with less sense of design and materials and workmanship.
NAVANA Furniture is a division of AFTAB AUTO MOBILES LTD., the second largest manufacturers of mainstream home furnishings. Haines bought ABC three years ago and is focusing on our niche. We see very good quality product, and an excellent sense of design, but little movement in channels or catalogs.
Strengths: Financial backing, product quality.
Weaknesses: NAVANA has not seemed to understand our niche, where to find the buyers, how to market as a specialty niche instead of the more traditional furniture channels.
NEW Compotators
1. OTOBI Furniture
2. HATIL Furniture
The new competitors of the business are strong .for this company are try to be defensive. It finds out the strengths and weakness of the competitors and modified its own strategy. The strengths and the weaknesses of the competitors that the company takes consideration are:
Strengths: High marketing, large advertising budget, relationships with distributors, strong direct sales, financial backing, product quality, designs.
Weaknesses: The product is more standardized, and of lesser quality, with less sense of design and materials and workmanship. Like existing competitors they have has not seemed to understand our niche, where to find the buyers, how to market as a specialty niche instead of the more traditional furniture channels
MARKET SEGMENTATION
Market Segmentation
Corporate executives:
Our market research indicates about 2.5 million potential customers who are managers in corporations of more than 100 employees. The target customer is going to be at a high executive level, in most cases, because the purchase price is relatively steep compared to standard office furniture.
Small business owners:
Our customer surveys indicate a strong market among the owners of businesses with fewer than 100 employees. There are 11 million such businesses in this country, most of them with concentrated ownership that makes the owners potential customers.
Home offices:
The home office business has proliferated during the 1990s, and we also have home offices for people employed outside the home. This is a big market, some 36 million home offices, growing faster than other markets.
Market Analysis (Pie)
Market Analysis
| Potential Customers | Growth | 1998 | 1999 | 2000 | 2001 | 2002 | CAGR |
| Corporate executives | 1% | 2,500,000 | 2,525,000 | 2,550,250 | 2,575,753 | 2,601,511 | 1.00% |
| Small business owners | 4% | 11,000,000 | 11,440,000 | 11,897,600 | 12,373,504 | 12,868,444 | 4.00% |
| Home offices | 10% | 36,000,000 | 39,600,000 | 43,560,000 | 47,916,000 | 52,707,600 | 10.00% |
| Other | 3% | 1,000,000 | 1,030,000 | 1,060,900 | 1,092,727 | 1,125,509 | 3.00% |
| Total | 8.23% | 50,500,000 | 54,595,000 | 59,068,750 | 63,957,984 | 69,303,064 | 8.23% |
Target Market Segment Strategy
Our segment definition is of itself strategic. We are not intending to satisfy all users of office furniture intended for use with personal computers, but, rather, only those who are most demanding. We are definitely out to address the needs of the high-end buyer, who is willing to pay more for quality.
In our particular market, we also seek the buyer who appreciates two attributes: the quality of furniture workmanship and the excellence of design, with an understanding of technology and ergonomics built in.
Market Needs:
We understand that our target market needs more than just office furniture. The need grew out of the special needs of personal computing, when combined with office furniture — keyboards at correct height, monitors at correct height, proper channels for cables, and other amenities. Our target customer wants to have all of that plus fine furniture. There is a need for quality, reassurance of wood and good workmanship. We don’t just sell office furniture; we sell office environment and design, plus workmanship.
Market Trends:
Our market has finally grown to recognize the disparity between most of the standard office furniture sold through channels, and our own products.
The development of the high-end office worker, office owners, and baby-boomer executive is an important trend for us. We now have people who are using computers who also appreciate the old-fashioned workmanship of good furniture.
Market Growth:
According to [source omitted], the market for office furniture is growing at XX percent per year, and is projected to increase. The market for PC-related office furniture is growing even faster, at YY percent per year, and is projected to top $XX billion by the year 2000.
Most important is the growth in home offices with personal computer equipment. As the cost of the computer goes down, steadily, the number of home offices goes up. According to [omitted], this is about 36 million right now, growing at 15 percent per year. Households spent $XX billion last year to equip home offices, and 15 percent of that was spent on furniture.
INDUSTRY ANALYSIS
The office furniture industry has undergone a great deal of change in this decade. The growth of the office superstores made a few large brands dominant. They produce relatively inexpensive furniture that makes compromises in order to stay at the low price level.
Makers of higher quality furniture are in general shuffling for niches to hide in. Although Willamette Furniture Mfr. was essentially developed around a niche, many of the more traditional furniture makers are looking for niches, trying to deal with declining sales as the main volume goes elsewhere.
Industry Participants
The main volume in the industry is now concentrated in four main brands, all of which compete for retail sales through major retail chain stores: Office Depot, Office Max, Staples, and others. These same four are also concentrating efforts as well in the major club discount stores, the Price Club, Costco, Sams, etc.
The growth of the office superstores made a few large brands dominant. Designs are similar and quite competitive, costs and cost control is critical, and channel management and channel marketing are the keys to these businesses’ continued success.
In mainstream office furniture, the rise of the office store channel has siphoned a lot of volume from the older and more traditional manufacturers. The channels that sold the more traditional lines are also suffering. What’s left are smaller brands, smaller companies, and divisions of more traditional furniture companies.
There are also some traditional manufacturers still making desks as part of furniture lines focused mainly on home furnishings. Some of these have looked at times at our niche, and are competing for the same dollars.
Distribution Patterns
The four main manufacturers are selling direct to the office superstores and buying discount clubs. This accounts for the main volume of distribution. The office furniture customer seems to be growing steadily more comfortable with the retail buy in the chain store.
The major corporate purchases are still made directly with manufacturers. Although this is still a major channel for some of the more traditional manufacturers, it is essentially closed to new competition. The direct channel is dominated by two manufacturers and two distributors. The distributors will occasionally take on a new line — happily, this has helped Willamette Furniture Mfr. — but the main growth is in retail.
Published research indicates that 51% of the total sales volume in the market goes through the retail channel, most of those major national chains. Another 23% goes through the direct sales channel, although in this case direct sales include sales by distributors who are buying from multiple manufacturers. Most of the remainder, 18%, is sold directly to buyers by catalogs.
Competition and buying patterns
In the mainstream business, channels are critical to volume. The manufacturers with impact in the national sales are going to win display space in the store, and most buyers seem content to pick their product off the store floor. Price is critical, because the channels take significant margins. Buyers are willing to settle for laminated quality and serviceable design.
In direct sales to corporations, price and volume is critical. The corporate buyer wants trouble-free buying in volume, at a great price. Reliable delivery is as important as reliable quality.
In the high-end specialty market, particularly in our niche, features are very important. Our target customer is not making selections based on price. The ergonomics, design, accommodation of the computer features within the high-quality feel of good wood, is much more important than mere price. We are also seeing that assembly is critical to shipping and packing, but our customer doesn’t accept any assembly problems. We need to make sure that the piece comes together almost like magic, and as it does, it presents a greater feel of quality than if it hadn’t required assembly at all.
FIVE FORCES ANALYSIS
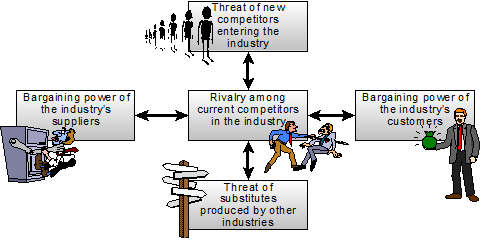
Rivalry among existing firms:
Economic growth:
The economy of our country is a growing one. It’s current growth in GDP is about 5.52%. There are many new ventures and business firms both small and large are growing rapidly. So the demand for office furniture is increasing day by day to meet up the growing demand arising ventures.
Competition among competitors:
This market is not yet competitive enough. There are few firms that sells office furniture such as Otobi, Navana, Akter, Hatil etc. But their main business segment is not the office furniture though they sell office furniture. Rather they produce all types of furniture.
Product differentiation:
Product differentiation is not significant in this market. Firms produce similar types of products and often customize their product according to their customers demand.
Switching cost:
Switching cost is low because customers can switch products among firms without significant loss.
From the above discussion we can conclude that the rivalry among existing firms is low that they are not competing in a way so they need to cut their price aggressively to grab the market share.
Threat of new entrants:
Legal barriers:
There is no such legal barrier to enter the market. Willing firms can easily enter the market without significant legal hazards.
First mover advantage:
In our country there are firms that have been selling office furniture but their sole business segment is not the office furniture. So there is no such firm in the market which is targeting the office furniture segment of the furniture market.
Threat of substitute products:
Substitutes products of wood furniture are steel furniture, plastic furniture etc. the major substitute of this sector is the steel furniture. There are many business firms that like the steel furniture instead of wood furniture because of their longevity and safety. But major portion of office furniture is produced by using wood causes they are much decorative and good looking.
Bargaining power of buyers:
Bargaining power depends on size of the buyer. That is how much the buyer wants to buy from the firm. If the firm purchases huge quantity of products then it may gain some extent of bargaining power. So the bargaining power may depend on situation. But overall the bargaining power of buyers is nil cause there are very few buyers in office furniture market that make a such huge amount of purchase to exercise the bargaining power.
Description Of The Venture
PRODUCT
Product Description:
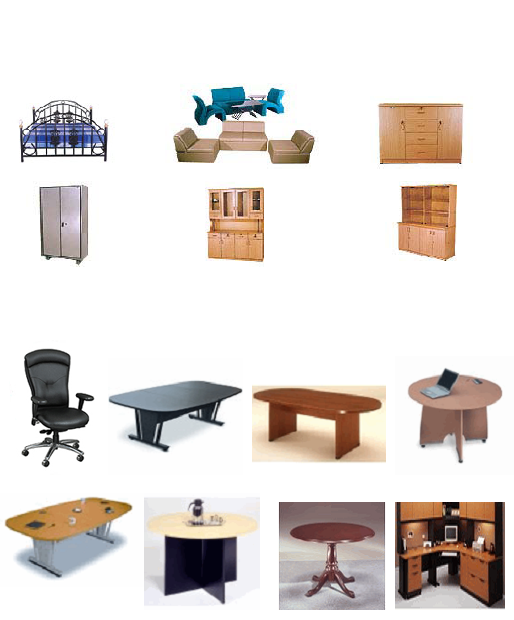
- Our main line is the computer desk and hospital furniture’s in several versions. This is an elegant piece of office furniture designed to look good in executive office or home office, and at the same time be ideal for real use of the computer. The two critical elements of ergonomics — keyboard height and angle and monitor height and angle — are completely adjustable. Cable runs and shelving add to the utility of the executive computer, without sacrificing elegance.
- We also make complementary pieces to fill out the office suite, including file cabinets, printer stands, and bookcases.
- We also make custom designs to fit exact measurements
Some of our products are………
MS Sheet Products:
Almirah (3 models of Household, 2models of Office) File Cabinet (3models)
Special Products:
- Heavy Duty Rack (8’x8’x2′)
- Slotted Angle Rack (4’x2’x6′)
- Book Shelve
- Personal Locker
- Bed Side Cabinet
- Departmental Storage Rack
- Customized Products
Hospital Items:
- Intensive Care Unit Bed
- Mechanical Bed
- Patient Examinant on Bed
- Saline Stand
- Medicine Trolley
- Instrument Trolley
- Patient Trolley
- Dressing Trolley
- Oxygen Cylinder Trolley
- Stretcher
Catalog:
SERVICES
ü Try to know the customers need then suggest them the best product suitable to them.
ü Warranty of ranging 3 months,6 months, 1 years and 5 years. It depends on the situation at what range they give warranty. For example if materials are given by the clients or if the company import the product according to the customers instruction then the company provide less periods warranty. It also depends on the prices of the respective products.
ü Also fulfill the contractual obligation.
ü Free delivery. For this it has own vehicle.
ü It also provides the internet services. It has its own web page. From this page it takes order, complains, suggestions.
ü It gives values the clients complains or any suggestions. Justify those and if possible applied.
ü Interior design services.
Size of The Business
Land Area | : | 12,000 sqm |
Name of Sections | : |
|
Number of Staff & Employees
- Mechanical Graduate Engineer – 05 Nos.
- Electrical Graduate Engineer – 02 Nos.
- Mechanical Diploma Engineer – 14 Nos.
- Administrative Staff – 12 Nos.
- Sales & Marketing Staff – 30 Nos.
- Skilled & Semi Skilled Worker – 450 Nos.
Production plan
MazTas™ Furniture offers very high quality office furniture designed to effectively incorporate computer machinery into the executive office or home office. The key to the line is an ergonomically effective desk that still looks like an executive desk, looks very good in a high-end home office, but is intended to accommodate the personal computer.
MAJOR RAW MATERIAL USED
- Imported Melamine Laminated Chip Board & MDF Board
- Imported Cold Rolled MS Tube
- Imported AISI 304 Grade SS Sheets & Tube
- Imported Fabric & PVC Leather
- Imported Chair Components
- Imported Fitting & Accessories
Sourcing
Our Oregon location is a distinct advantage for local wood. We can buy higher quality WOOD than either of our competitors (one in Chittagong, one in BANDERBAN). Since our sales increased over the last two years, we have been able to buy at better prices, because of higher volumes.
We work with three wood suppliers, all local. TIMBERLAND supplies most of our materials and a bit of cherry and some other specialty woods. TIMBERLAND has been in business for as long as we have, and has given us good service and good prices. This is a good, stable supplier. Duffin Wood Products is a good second source, particularly for cherry and specialty woods. We’ve used Merlin supplies as well, frequently, for filling in when either of our main two suppliers were short.
We also work with a number of specialty manufacturers for furniture fittings, drawer accessories, glass, shelving accessories, and related purchases.
Although we aren’t a major player compared to the major furniture manufacturers, we are one of the biggest buyers of the custom materials we need. Most of our suppliers are selling through channels to hobbyists and carpenters, so they treat us as a major account.
Technology
We depend on our dominance of the latest in technology of ergonomics, combined with classic design elements of fine furniture. We must remain on top of new technologies in display, input and output, and communications. For example, our latest models are already assuming the desktop digital scanner as a frequent accessory, and audio for use in creating presentations, email attachments, etc.
Our assembly patents are an important competitive edge. No competitor can match the way we turn a drawback — having to assemble the product — into a feature. Our customer surveys confirm that customers take the interlocking assembly system as an enhancement to the sense of quality.
Major Machinery
- Tube Bending Machine SB50NC
- “SCM” Sliding table saw with scoring & main saw blade & with spindle moulder.
- “Hirzt” Automatic Edge Bender
- “Scheer” Universal Dowel Boring Machine “Holytek” Router Machine
- “Hipoint” Corner trimming Unit
- “Holytek” Band saw Machine
- “BLM” Sawdust extraction unit c/w 2 top & 2 bottom bags
- “Holytek” Manual edge bender
- San-Jui Carbide Tool Grinder Machine
- Sunfluid Hydraulic Guillotine
- Sunfluid Hydraulic Guillotine Press Brake
- Lignar Mark 4H Post former Bench Tops
- SPA MODEL STDE 3+3 Spindles
- “Formahero” FH-302V4HP Multi Horizontal & Vertical Boring
- Holzher Sprint 1317-1, Single- sided Edge bender C/W 415V/50Hz
- Sicar Best 3000 Sliding Table Saw C/W 415V/50Hz
- BS-120 Speedy Panel Saw M/C
- EB-7/L60 Edge Bender M/C
- HS-84 T Four -Unit Boring M/C
- Hipoint Brand Double End Tenoner M/C
Manufacturing Process
After knowing the customers need, current fashion, materials available at home country and at abroad and evaluating the suggestions and the complains and any innovative ideas the manufacturing departments give instruction to begins the production. In the manufacturing process the following sections of the company take parts-
- ‘Press Section’ for M.S. & S.S. Structure.
- ‘Phosphate Section’ for de-rusting, degreasing & surface coating.
- ‘Paint Section’ for staving and powder coating paint.
- ‘Laminated Board Section’ for chip board & MDF Board furniture fabrication.
- ‘Wood Section’ for wooden shell Manufacturing.
- ‘Cushioning Section’ for upholstery manufacturing.
- ‘Tooling Section’ for Tool & Mould Making
Future Products
We will introduce the new line based on the executive laptop computer, with docking station to connect to a network. The new furniture has a different configuration to assume easy access to the docking station, and better use of the space that doesn’t have to be dedicated the CPU case.
We are also going to accommodate larger monitors, the 17″ and 21″ sizes that are becoming much more common, particularly in our high-end market. As we do, we will also be watching for the new technology providing wall-mounted flat screens, the liquid plasma and similar technologies.
Marketing Plan
Our product is positioned very carefully: this is high-quality office furniture combining workmanship and ergonomics for the customer who understands quality, is a user of high technology equipment, and is willing to spend money on the best. Unlike the mainstream products, we do not use laminates or cheap manufacturing technology.
Our marketing strategy is based mainly on making the right information available to the right target customer. We can’t afford to sell people on our expensive products, because most don’t have the budget. What we really do is make sure that those who have the budget and appreciate the product know that it exists, and know where to find it.
The marketing has to convey the sense of quality in every picture, every promotion, and every publication. We can’t afford to appear in second-rate catalogs with poor illustrations that make the product look less than it is. We also need to leverage our presence using high-quality catalogs and specialty distributors.
1 Positioning Statements
For discriminating personal computer users who want to integrate their PCs with fine furniture, the Willamette line offers exquisite workmanship and design combined with state-of-the-arts ergonomics and technology. Unlike the Acme line, Willamette Furniture makes no design compromises for standardization.
2 Pricing Strategy
We will maintain our pricing position as a premier provider. We are the best product available, for the most discriminating consumer. We intend to maintain our separation from the price competition at the lower end of the business. Our plan calls for no significant changes in pricing.
3 Promotion Strategies
Our most important vehicle for sales promotion is the direct mail catalog published by the specialty retailer such as Sharper Image and its competitors. Our advertising budget of $264 million goes mainly for space in the specialty catalog.
We also participate in major industry events, including both the Spring and Fall national computer furniture shows and the fall computer show. Our total budget for events is $40,000, plus about half of the $31,000 travel budget.
This year we will also promote our products with an in-house catalog including our own products plus related merchandise of interest to the same target market.
4 Distribution Strategies
Our most important marketing program is [specifics omitted]. Ivy Bells will be responsible, with budget of $50,000 and milestone date of the 15th of July. This program is intended to [objectives omitted]. Achievement should be measured by [specific concrete measurement].
Another key marketing program is [specifics omitted]. [Name] will be responsible, with budget of $50,000 and milestone date of [date]. This program is intended to [objectives omitted]. Achievement should be measured by [specific concrete measurement].
Organization Plan
Form Of Ownership
We are a small company owned and operated by RASHID, SALAM, and KABIR, friends, as a Subchapter S corporation. Rashid and Kabir is the developer and designer of the products and Salam manages the company as president.
Management style reflects the participation of the owners. The company respects its community of co-workers and treats all workers well. We attempt to develop and nurture the company as community. We are not very hierarchical.
Organization structure
Abu Salam, President, is responsible for overall business management. Our managers of finance, marketing, and sales report directly to Tasmia.
M.M.RASHID and M.M.Kabir, designers, are responsible for product design and development, assembly, and manufacturing. Our workshop manager reports directly to Tuli.
As co-owners, they jointly develop business strategy and long-term plans. Kabir is strong on product know-how and technology, and Salam is strong on management and business know-how.
Management Team
Identifications And Background
Abu Salam, president, had a successful career in retail before becoming half owner of MazTas™ Furniture Mfr. he was an area manager of Ross Stores, a buyer for Macy’s, and merchandising assistant for Sears and Roebuck. He has a degree in Literature from the University of Notre Dame.
M. M. RASHID, workshop manager, designed furniture for Haines Manufacturing before becoming an owner of MazTas™ Furniture. He was responsible for one of the first executive desks designed to include customized fittings for personal computers, and was one of the first to design the monitor inside the desk under glass. He has an B.S. and M.S. in industrial design, from StanfordUniversity and the University of Oregon, respectively.
M.M.KABIR, is marketing manager. Terry joined MazTas™ Furniture from the marketing department of the SYLHET Furniture chain, having been in charge of national catalog production and catalog advertising. Terry also managed direct sales at one of the furniture distributors that have since died to industry consolidation. He has a B.A. degree in literature from the University of Washington. FORM OF OWNERSHIP.
Management team Gaps
We depend on our professionals, our CPA and our attorney, for some key management help. We don’t have a strong background in finance or business management.
As we grow we will need to develop more manufacturing technique, more mass production. Leslie grew up with the hand-made and custom furniture business, knows fine woodworking well, but admits a weakness in establishing standardized assembly.
Personnel plan
The personnel table assumes slow growth in employees, and 10% per annum pay raises. We already have a strong benefits policy (with fully-paid medical, dental, and life insurance, plus a profit sharing and 401K plan) and very low turnover.
Salaries are generally in line with market pay for the Eugene area, although our benefits are above standard market level, so we ultimately pay a bit more for our people than what might be considered standard in our market. Eugene, however, is on average a lower wage location than most of the more developed industry areas.
As we grow, we expect to see steady increases in our personnel to match the increases in sales.
Personnel Plan | |||
| Production Personnel | 1998 | 1999 | 2000 |
| Workshop manager | $30,000 | $50,000 | $75,000 |
| Assembly | $21,600 | $30,000 | $60,000 |
| Other | $0 | $0 | $50,000 |
| Subtotal | $51,600 | $80,000 | $185,000 |
| Sales and Marketing Personnel | |||
| Marketing manager | $37,000 | $65,000 | $72,000 |
| Subtotal | $37,000 | $65,000 | $72,000 |
| General and Administrative Personnel | |||
| President | $48,000 | $75,000 | $100,000 |
| Subtotal | $48,000 | $75,000 | $100,000 |
| Other Personnel | |||
| Design | $3,000 | $15,000 | $25,000 |
| Subtotal | $3,000 | $15,000 | $25,000 |
| Total Payroll | $139,600 | $235,000 | $382,000 |
Strategy and Implementation Summary
We focus on a special kind of customer, the person who wants very high quality office furniture customized to work beautifully with modern technology including personal computers, scanners, internet connections, and other high-tech items. Our customer might be in larger corporations, small or medium business, or in a home office with or without a home-office business. What is important to the customer is elegance, fine workmanship, ease of use, ergonomics, and practicality.
Our marketing strategy assumes that we need to go into specialty channels to address our target customer’s needs. The tie-in with the high-end quality catalogs like Sharper Image is perfect, because these catalogs cater to our kind of customers. We position as the highest quality, offering status and prestige levels of purchase.
The product strategy is also based on quality, in this case the intersection of technical understanding with very high quality woodworking and professional materials, and workmanship.
Our most important competitive edge is our assembly strategy, which is based on interlocking wood pieces of such high quality that assembly is not only a pleasure for our customers; it is actually a feature that enhances the sense of quality.
Strategy Pyramids
Our main strategy at MazTas™ Furniture. is to position ourselves at the top of the quality scale, featuring our combination of superb technology and fine old-fashioned woodworking, for the buyer who wants the best quality regardless of price. Tactics underneath that strategy include research and development related to new designs and new technology, choosing the right channels of distribution, and communicating our quality position to the market. Programs are mainly those listed in the milestones table, including new design programs, new equipment to keep up with design, channel development, channel marketing programs, our direct sales, and our continued presence in high-end catalog channels and new presence in the web.
Value Proposition
MazTas™ Furniture gives the discriminating personal computer user, who cares about design and quality furniture and quality of working environment, a combination of highest quality furniture and latest technology, at a relatively high price.
Competitive Edge
Our competitive edge is our dominance of high-technology ergonomics and traditional high-quality furniture workmanship. Although there are many computer furniture manufacturers, and many computer lovers, few have brought the two crafts together as we have.
Marketing Strategy
Our product is positioned very carefully: this is high-quality office furniture combining workmanship and ergonomics for the customer who understands quality, is a user of high technology equipment, and is willing to spend money on the best. Unlike the mainstream products, we do not use laminates or cheap manufacturing technology.
Our marketing strategy is based mainly on making the right information available to the right target customer. We can’t afford to sell people on our expensive products, because most don’t have the budget. What we really do is make sure that those who have the budget and appreciate the product know that it exists, and know where to find it.
The marketing has to convey the sense of quality in every picture, every promotion, and every publication. We can’t afford to appear in second-rate catalogs with poor illustrations that make the product look less than it is. We also need to leverage our presence using high-quality catalogs and specialty distributors.
Sales Strategy
Our strategy focuses first on maintaining the identity with the high-end buyer who appreciates the best available quality, but is also very demanding regarding computer systems and technology. We’ve been able to find these customers using a combination of direct mail catalogs and direct sales to distributors.
For the next year we continue to focus on growing presence in the high-end direct mail catalog that finds our specialty customer. We will work with Sharper Image and Broadview more than ever, and we expect to gain position in the major airline catalogs as well. Specialty retail is a new channel that could become important for us.
Our work with distributors has been promising. We hope to continue the relationship with distributors selling directly to larger corporations, even though this takes working capital to support receivables.
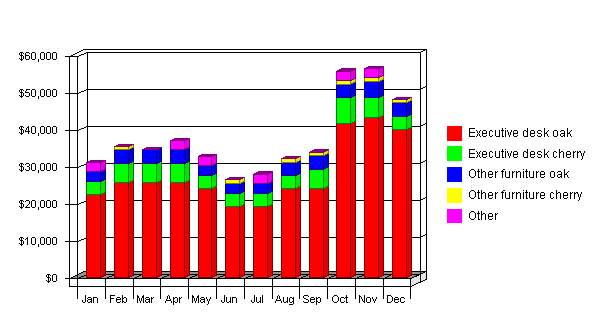
Sales Forecast
Our sales forecast assumes no change in costs or prices, which is a reasonable assumption for the last few years.
We are expecting to increase sales grow from $225 thousand last year to $450 thousand in the next year, which is about doubling in size. The growth forecast is in line with our last year, and is relatively high for our industry because we are developing new channels. In 1999 and 2000 we expect growth closer to 50% per year, to a projected total of more than $1 million in 2000.
We are projecting significant change in the product line, or in the proportion between different lines. The key to our growth is the growth of the new channels, with the main desk.
Our seasonality, as shown in the chart, is still a factor in the business. We tend to sell much better in Spring and Fall, and sales drop in the summer.
Sales Forecast | |||
| Unit Sales | 1998 | 1999 | 2000 |
| Executive desk oak | 209 | 350 | 600 |
| Executive desk cherry | 31 | 30 | 30 |
| Other furniture oak | 45 | 50 | 50 |
| Other furniture cherry | 7 | 10 | 10 |
| Other | 6 | 10 | 10 |
| Total Unit Sales | 298 | 450 | 700 |
| Unit Prices | 1998 | 1999 | 2000 |
| Executive desk oak | $1,600.00 | $1,600.00 | $1,600.00 |
| Executive desk cherry | $1,750.00 | $1,750.00 | $1,750.00 |
| Other furniture oak | $900.00 | $900.00 | $900.00 |
| Other furniture cherry | $1,000.00 | $1,000.00 | $1,000.00 |
| Other | $2,500.00 | $2,500.00 | $2,500.00 |
| Sales | |||
| Executive desk oak | $334,400 | $560,000 | $960,000 |
| Executive desk cherry | $54,250 | $52,500 | $52,500 |
| Other furniture oak | $40,500 | $45,000 | $45,000 |
| Other furniture cherry | $7,000 | $10,000 | $10,000 |
| Other | $15,000 | $25,000 | $25,000 |
| Total Sales | $451,150 | $692,500 | $1,092,500 |
| Direct Unit Costs | 1998 | 1999 | 2000 |
| Executive desk oak | $400.00 | $400.00 | $400.00 |
| Executive desk cherry | $525.00 | $525.00 | $525.00 |
| Other furniture oak | $180.00 | $180.00 | $180.00 |
| Other furniture cherry | $300.00 | $300.00 | $300.00 |
| Other | $625.00 | $625.00 | $625.00 |
| Direct Cost of Sales | 1998 | 1999 | 2000 |
| Executive desk oak | $83,600 | $140,000 | $240,000 |
| Executive desk cherry | $16,275 | $15,750 | $15,750 |
| Other furniture oak | $8,100 | $9,000 | $9,000 |
| Other furniture cherry | $2,100 | $3,000 | $3,000 |
| Other | $3,750 | $6,250 | $6,250 |
| Subtotal Direct Cost of Sales | $113,825 | $174,000 | $274,000 |
Sales Programs
Specific sales programs:
Catalog sales:
Develop placement with one additional catalog catering to the high-end office executive, paying of course for space and positioning. The budget is $10,000 for this program, due March 15, with Jan responsible.
Distributor sales:
We need to develop at least new distributor, spending for co-promotion as required, and making direct sales calls. The specific responsibility is Jan’s, and due date is May 15, with a budget of $15,000.
Direct sales:
We will do a mailing of a new in-house catalog, developed by the marketing department, to add to our direct telephone sales. Jan will be responsible, without a budget or a deadline because the catalog is a marketing program.
Financial Plan
The financial picture is quite encouraging. We have been slow to take on debt, but with our increase in sales we do expect to apply for a credit line with the bank, to a limit of $150,000. Assets easily support the credit line.
We do expect to be able to take some money out as dividends. The owners don’t take overly generous salaries, so some draw is appropriate.
Important Assumptions
The accompanying table lists our main assumptions for developing our financial projections. The most sensitive assumption is the collection days. We would like to improve collection days to take pressure off of our working capital, but our increasing sales through channels makes the collection time a cost of doing business.
We also expect to see a decline in our inventory turnover ratio, another unfortunate side effect of increasing sales through channel. We find ourselves having to buy earlier and hold more finished goods in order to deal with sales through the channel.
General Assumptions | |||
| 1998 | 1999 | 2000 | |
| Plan Month | 1 | 2 | 3 |
| Current Interest Rate | 10.00% | 10.00% | 10.00% |
| Long-term Interest Rate | 9.00% | 9.00% | 9.00% |
| Tax Rate | 25.42% | 25.00% | 25.42% |
| Sales on Credit % | 75.00% | 75.00% | 75.00% |
| Other | 0 | 0 | 0 |
Key Financial Indicators
The following chart shows changes in key financial indicators: sales, gross margin, operating expenses, collection days, and inventory turnover. The growth in sales will be very hard to manage. We expect our gross margin to be a bit lower than before, because our projections show a slight decline as we go into new product areas and face new competition.
The projections for collection days and inventory turnover show that we are already expecting a decline in these indicators, because of increasing sales through channels.
Benchmarks
Break-even Analysis
Our break-even analysis is based on running costs, the “burn-rate” costs we incur to keep the business running, not on theoretical fixed costs that would be relevant only if we were closing. Between payroll, rent, utilities, and basic marketing costs, we think $40,000 is a good estimate of fixed costs.
Our assumptions on average unit sales and average per-unit costs depend on averaging. We don’t really need to calculate an exact average; this is close enough to help us understand what a real break-even point might be.
The essential insight here is that our sales level seems to be running comfortably above break-even.
Break-even Analysis
Break-even Analysis: | |
| Monthly Units Break-even | 67 |
| Monthly Revenue Break-even | $80,000 |
| Assumptions: | |
| Average Per-Unit Revenue | $1,200.00 |
| Average Per-Unit Variable Cost | $600.00 |
| Estimated Monthly Fixed Cost | $40,000 |
Projected Profit and Loss
We do expect a significant increase in profitability this year, and in the future, because we have learned how to deal with the increasing sales levels of selling through channels. Despite the lower profitability levels of recent years, we expect to pass 5% in 1998, and remain at that level through 2000.
Our higher sales volume has lowered our cost of goods and increased our gross margin. This increase in gross margin is important to profitability.
Pro Forma Profit and Loss | |||
| 1998 | 1999 | 2000 | |
| Sales | $451,150 | $692,500 | $1,092,500 |
| Direct Costs of Goods | $113,825 | $174,000 | $274,000 |
| Production Payroll | $51,600 | $80,000 | $185,000 |
| Other | $3,110 | $0 | $0 |
| ———— | ———— | ———— | |
| Cost of Goods Sold | $168,535 | $254,000 | $459,000 |
| Gross Margin | $282,615 | $438,500 | $633,500 |
| Gross Margin % | 62.64% | 63.32% | 57.99% |
| Operating Expenses: | |||
| Sales and Marketing Expenses: | |||
| Sales and Marketing Payroll | $37,000 | $65,000 | $72,000 |
| Miscellaneous | $2,400 | $2,600 | $2,900 |
| Advertising/Promotion | $64,000 | $70,400 | $77,400 |
| Events | $6,250 | $6,900 | $7,600 |
| Public Relations | $750 | $800 | $900 |
| Travel | $4,500 | $5,000 | $5,500 |
| ———— | ———— | ———— | |
| Total Sales and Marketing Expenses | $114,900 | $150,700 | $166,300 |
| Sales and Marketing % | 25.47% | 21.76% | 15.22% |
| General and Administrative Expenses: | |||
| General and Administrative Payroll | $48,000 | $75,000 | $100,000 |
| Sales and Marketing and Other Expenses | $0 | $0 | $0 |
| Depreciation | $1,000 | $1,100 | $1,200 |
| Leased Equipment | $1,500 | $1,700 | $1,900 |
| Utilities | $2,400 | $2,600 | $2,900 |
| Insurance | $500 | $600 | $700 |
| Rent | $3,600 | $4,000 | $4,400 |
| Other | $1,200 | $1,300 | $1,400 |
| Payroll Taxes | $20,940 | $35,250 | $57,300 |
| Other General and Administrative Expenses | $0 | $0 | $0 |
| ———— | ———— | ———— | |
| Total General and Administrative Expenses | $79,140 | $121,550 | $169,800 |
| General and Administrative % | 17.54% | 17.55% | 15.54% |
| Other Expenses: | |||
| Other Payroll | $3,000 | $15,000 | $25,000 |
| Contract/Consultants | $0 | $0 | $0 |
| ———— | ———— | ———— | |
| Total Other Expenses | $3,000 | $15,000 | $25,000 |
| Other % | 0.66% | 2.17% | 2.29% |
| ———— | ———— | ———— | |
| Total Operating Expenses | $197,040 | $287,250 | $361,100 |
| Profit Before Interest and Taxes | $85,575 | $151,250 | $272,400 |
| Interest Expense | $8,750 | $14,000 | $21,500 |
| Taxes Incurred | $19,016 | $34,313 | $63,770 |
| Net Profit | $57,809 | $102,938 | $187,130 |
| Net Profit/Sales | 12.81% | 14.86% | 17.13% |
Projected Cash Flow
Although we expect to be more profitable in 1998, we still have drains on the cash flow. We need to invest $25,000 in new assembly and manufacturing equipment, plus $15,000 in new computer equipment, and another $10,000 in miscellaneous short-term assets, including office equipment. Because of our increased sales through channels, and necessary increase in inventory levels, we need to increase working capital. We plan to extend our credit line to cover as much as $150,000 in short-term credit, backed by receivables and inventory. Our maximum extension looks like $115,000 at the end of the year, and it is barely covered by an estimated $140,000 in receivables and inventory that same month.
Cash
Pro Forma Cash Flow | |||
| 1998 | 1999 | 2000 | |
| Cash Received | |||
| Cash from Operations: | |||
| Cash Sales | $112,788 | $173,125 | $273,125 |
| Cash from Receivables | $291,789 | $479,692 | $753,606 |
| Subtotal Cash from Operations | $404,576 | $652,817 | $1,026,731 |
| Additional Cash Received | |||
| Sales Tax, VAT, HST/GST Received | $0 | $0 | $0 |
| New Current Borrowing | $125,000 | $50,000 | $100,000 |
| New Other Liabilities (interest-free) | $0 | $0 | $0 |
| New Long-term Liabilities | $0 | $0 | $0 |
| Sales of Other Current Assets | $0 | $0 | $0 |
| Sales of Long-term Assets | $0 | $0 | $0 |
| New Investment Received | $50,000 | $0 | $0 |
| Subtotal Cash Received | $579,576 | $702,817 | $1,126,731 |
| Expenditures | 1998 | 1999 | 2000 |
| Expenditures from Operations: | |||
| Cash Spending | $128,052 | $145,495 | $214,496 |
| Payment of Accounts Payable | $304,828 | $467,294 | $727,353 |
| Subtotal Spent on Operations | $432,880 | $612,789 | $941,850 |
| Additional Cash Spent | |||
| Sales Tax, VAT, HST/GST Paid Out | $0 | $0 | $0 |
| Principal Repayment of Current Borrowing | $10,000 | $0 | $0 |
| Other Liabilities Principal Repayment | $0 | $0 | $0 |
| Long-term Liabilities Principal Repayment | $0 | $0 | $0 |
| Purchase Other Current Assets | $0 | $0 | $0 |
| Purchase Long-term Assets | $50,000 | $20,000 | $30,000 |
| Dividends | $0 | $0 | $0 |
| Subtotal Cash Spent | $492,880 | $632,789 | $971,850 |
| Net Cash Flow | $86,696 | $70,028 | $154,882 |
| Cash Balance | $88,134 | $158,162 | $313,044 |
Projected Balance Sheet
Our projected balance sheet shows an increase in net worth to more than $400 thousand in 2000, at which point we expect to be making 17% profit on sales of $1.1 million. With the present financial projections we will be careful in supporting our working capital credit line, and we are growing assets both because we want to — new equipment — and because we have to grow receivables and inventory to support growth in sales through channels.
Pro Forma Balance Sheet | |||
| Assets | |||
| Current Assets | 1998 | 1999 | 2000 |
| Cash | $88,134 | $158,162 | $313,044 |
| Accounts Receivable | $74,179 | $113,862 | $179,630 |
| Inventory | $48,280 | $73,804 | $116,220 |
| Other Current Assets | $2,375 | $2,375 | $2,375 |
| Total Current Assets | $212,968 | $348,203 | $611,269 |
| Long-term Assets | |||
| Long-term Assets | $53,210 | $73,210 | $103,210 |
| Accumulated Depreciation | $2,720 | $3,820 | $5,020 |
| Total Long-term Assets | $50,490 | $69,390 | $98,190 |
| Total Assets | $263,458 | $417,593 | $709,459 |
| Liabilities and Capital | |||
| Current Liabilities | 1998 | 1999 | 2000 |
| Accounts Payable | $8,791 | $9,988 | $14,725 |
| Current Borrowing | $115,000 | $165,000 | $265,000 |
| Other Current Liabilities | $1,803 | $1,803 | $1,803 |
| Subtotal Current Liabilities | $125,594 | $176,791 | $281,528 |
| Long-term Liabilities | $0 | $0 | $0 |
| Total Liabilities | $125,594 | $176,791 | $281,528 |
| Paid-in Capital | $54,500 | $54,500 | $54,500 |
| Retained Earnings | $25,555 | $83,364 | $186,302 |
| Earnings | $57,809 | $102,938 | $187,130 |
| Total Capital | $137,864 | $240,802 | $427,931 |
| Total Liabilities and Capital | $263,458 | $417,593 | $709,459 |
| Net Worth | $137,864 | $240,802 | $427,931 |
Business Ratios
Our ratios look healthy and solid. Gross margin is projected to decline below 60%, return on assets getting to about 17%, and return on equity at 35% or better. Debt and liquidity ratios also look tough, with debt to net worth running at more than 1.4 to one. The projections, if we make them, are manageable. The standard comparisons are based on SIC code 2521, manufacturers of wood office furniture.