
9.0 Discussion
9.1 Business utilization of technical analysis
9.1.1 Bangladesh inter-bank Foreign Exchange Market
9.1.1. a Inter-Bank Transaction in Foreign Exchange
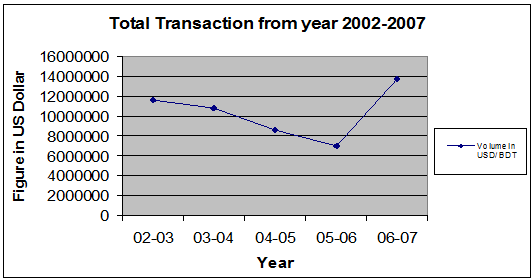
The volume of inter-bank foreign exchange transaction maintained a downward trend till year 2006 but started to move upward from the year 2006. In year 2006-2007, the inter-bank transactions in foreign exchange were totaled US$13,705,791.14, which has increased by 6,709,141.064 compared with the preceding year total US$ 6,996,650.076 (See appendix 1).
Total transactions in the inter-bank foreign exchange market from the year 2002-2007 were given into a graph as under.
Monthly position of inter-bank transactions was uneven over the period due to unpredictable demand and supply position in the inter-bank market.
Month-wise position of inter-bank transaction in foreign exchange for last twelve months is given below in a graphical form. It appears from the graph that the highest transaction took place in June-July 2007, over the last 12 months period (see appendix 2).
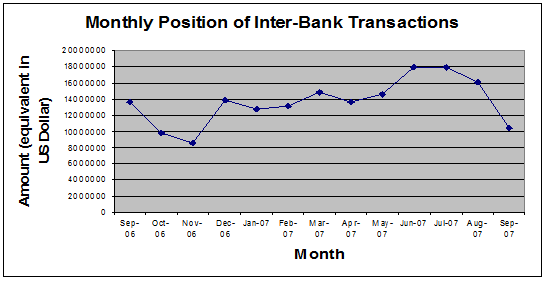
Inter-bank foreign exchange transactions have been going on smoothly despite declining the trend of transaction volume from July 2007. The transactions equivalent in million U.S.
Dollar in the inter-bank foreign exchange market during July-Sept, 2007 were the followings- 17914318.18, 16027368.42, and
10396500(equivalent in US Dollar), from which we can see very easily that the transaction volume is declining month by month.
9.1.1. b Quarterly transactions of USD/BDT and Other FCY/BDT Transaction
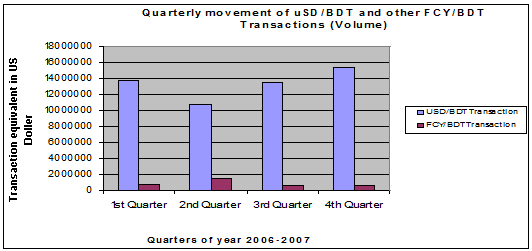
FCY/BDT Market has experienced much unsteady condition over the period in current year.
The volume of other FCY/BDT transactions incredibly increased during second quarter, the amount equal to 1478914.474, and after that during third and forth quarter it again declined and reach almost to its earlier position.
On the other hand, USD/BDT transactions decreased from 13738515.63 to 10706875 during the second quarter, but after that it again started moving upward and reached to15385873.02 during the fourth quarter (see appendix 4).
This is happened mainly due to supply of U.S. Dollar in the inter-bank forex market and price hike of importable products like petroleum & petroleum products and other essential commodities in the international market. A comparative position showing quarterly movement of USD/BDT and other FCY/BDT transactions for the current year is given in graph:
The volume of BDT trades against USD decline during the second quarter due to the higher demand of import payments as well as the official rate declared against the USD/BDT by the central bank. According to the official sources from Central Bank USD/BDT rates are 68.61 taka (as of Nov 07) whereas the underlying rates of BDT against FCY reaches Tk69.50. Comparing average TT clean buying rates of the commercial banks operated into this market stands at 68.80 on 15Nov06 and selling rates at 69.80 (refers appendix 6). The difference between these 1..00 taka between the official and actual markets rates insist the volume of FCY deals against BDT thus originating more cross currency trading.
9.2 The use of Technical analysis in Bangladesh
The use of forecasting techniques can play major role in the increasing amount of transactions into the inter-bank foreign exchange markets in the third currency. The reasons underlying these transactions are mainly the Spot currency speculations as well as the obligations arise from the imports and governments payments.
In order to minimize the risk and to gain the opportunity over the global currency markets the introduction of the technical analysis help the speculators and give the importer or exporter the opportunity to hedge their currency positions.
9.2.1 Importers point of views
If major trends can be identified in advance the dealers can advise the importer in advance to cover the risk through forwards or even within the day transactions.
Suppose an importer opens a L/C of GBP1.00 million and the current market rate against GBP= USD 2.0655 and USD= TK 68.6050. if the documents have to retire today the importer have to pay Tk141.7036 million today.
But utilizing the technical analysis, if the major trends can be identified, the importer can hedge their obligations as per the trend, i.e. if the trend is upward in both GBP/USD and USD/BDT, hedge it today through spot of forward or if the trend in downward use the maximum period before the payments due date.
9.2.2 Exporters point of views
Similar to an importer, if an exporter due to receive currency like GBP or USD against the export documents, can position accordingly to the major outlooks of the underlying currency he/she will receive.
In the current scenario in USD/BDT as the market is in favor of USD, the exporter should try to lag his/her export proceeds in order to get deprecated rates over Taka.
10.0 Significance of the Study
The foreign exchange market has played a vital role in the last decade or so in guiding the purchase and sale of goods, services and raw materials globally. The market directly affects country’s bond, equities, private property, manufacturing and all assets that are available to foreign investors. The market is a stabilizing factor in the world system of monetary exchange and was created not by design but by necessity.
Foreign exchange rates also play a major role in determining who finances government deficits, which buys equities in companies and literally effects and influences the economic scenario of every nation to cope with the foreign exchange risk in an open market economy. The market has its own momentum and therefore it is crucial to follow a universal time tested policy to tackle the forces behind the free market system with minimal risk involvement.
The research will draw various forecasting techniques in the foreign exchange market, basics of the technical analysis, business utilization of the technical analysis and also the utilization of the technical analysis in Bangladesh.
And finally the research has also described about some of the mistakes made in the forex markets and also some techniques to avoid the mistakes in the forex markets which the dealers apply while doing their works.
11.0 Risks Involved in foreign exchange
On the foreign exchange market one discerns the following kinds of the risks:
- Exchange rate risk;
- Interest rate risk;
- Credit risk;
- Country risk.
11.1. Exchange Rate Risk
Exchange rate risk is a consequence of the continuous shift in the worldwide market supply and demand balance on an outstanding foreign exchange position. A position will be a subject to all the price changes as long as it is outstanding. In order to cut losses short and ride profitable positions that losses should be kept within manageable limits. The most popular steps are the position limit and the loss limit. The limits are a function of the policy of the banks along with the skills of the traders and their specific areas of expertise. There are two types of position limits: daylight and overnight.
1. The daylight position limit establishes the maximum amount of a certain currency which a trader is allowed to carry at any single time during.
The limit should reflect both the trader’s level of trading skills and the amount at which a trader peaks.
2. The overnight position limit which should be smaller than daylight limits refers to any outstanding position kept overnight by traders. Really, the majority of foreign exchange traders do not hold overnight positions.
The loss limit is a measure to avoid unsustainable losses made by traders; which is enforced by the senior officers in the dealing center. The loss limits are selected on a daily and monthly basis by top management.
The position and loss limits can now be implemented more conveniently with the help of computerized systems which enable the treasurer and the chief trader to have continuous, instantaneous, and comprehensive access to accurate figures for all the positions and the profit and loss. This information may also be delivered from all the branches abroad into the headquarters terminals.
Trading 106
11.2. Interest Rate Risk
Interest rate risk is pertinent to currency swaps, forward out rights, futures, and options. It refers to the profit and loss generated by both the fluctuations in the forward spreads and by forward amount mismatches and maturity gaps among transactions in the foreign exchange book. An amount mismatch is the difference between the spot and the forward amounts. For an active forward desk the complete elimination of maturity gaps is virtually impossible. However, this may not be a serious problem if the amounts involved in these mismatches are small. On a daily basis, traders balance the net payments and receipts for each currency through a special type of swap, called tomorrow/next or rollover.
To minimize interest rate risk, management sets limits on the total size of mismatches. The policies differ among banks, but a common approach is to separate the mismatches, based on their maturity dates, into up to six months and past six months. All the transactions are entered in computerized systems in order to calculate the positions for all the delivery dates and the profit and loss. Continuous analysis of the interest rate environment is necessary to forecast any changes that may impact on the outstanding gaps.
11.3. Credit Risk
Credit risk is connected with the possibility that an outstanding currency position may not be repaid as agreed, due to a voluntary or involuntary action by a counter party. In these cases, trading occurs on regulated exchanges, where all trades are settled by the clearing house. On such exchanges, traders of all sizes can deal without any credit concern.
The following forms of credit risk are known:
1. Replacement risk which occurs when counter parties of the failed bank find their books unbalanced to the extent of their exposure to the insolvent party. To rebalance their books, these banks enter new transactions.
2. Settlement risk which occurs because of different time zones on different continents. Such a way, currencies may be credited at different times during the day. Australian and New Zealand dollars are credited first, then Japanese yen, followed by the European currencies and ending with the U.S. dollar. Therefore, payment may be made to a party that will declare insolvency (or be declared insolvent) immediately after, but prior to executing its own payments.
The credit risk for instruments traded off regulated exchanges is to be minimized through the customers’ creditworthiness. Commercial and investment banks, trading companies, and banks’ customers must have credit lines with each other to be able to trade. Even after the credit lines are extended, the counter parties’ financial soundness should be continuously monitored. Along with the market value of their currency portfolios, end users, in assessing the credit risk, must consider also the potential portfolios exposure. The latter may be determined through probability analysis over the time to maturity of the outstanding position. For the same purposes netting is used. Netting is a process that enables institutions to settle only their net positions with one another not trade by trade but at the end of the day, in a single transaction. If signs of payment difficulty of a bank are shown, a group of large banks may provide short-term backing from a common reserve pool.
Successful Trading 108
11.4. Country Risk
The failure to receive an expected payment due to government interference amounts to the insolvency of an individual bank or institution, a situation described under credit risk. Country risk refers to the government’s interference in the foreign exchange markets and falls under the joint responsibility of the treasurer and the credit department. Outside the major economies, controls on foreign exchange activities are still present and actively implemented.
For the traders it is important to know or be able to anticipate any restrictive changes concerning the free flow of currencies. If this is possible, though trading in the affected currency will dry up considerably, it is still a manageable situation
12.0 Recommendation
Followings are some methods of avoiding foreign exchange risks:
- · Don’t read the news-analyze the news: Many times, seemingly straight forward news releases from government agencies are really public relation vehicles to advance a particular point of view or policy. Such “news,” in the forex markets more than any other, is used as a tool to affect the investment psychology of the crowd. Such media manipulation is not inherently a negative. Governments and traders try to do that all the time. The new forex trader must realize that it is important to read the news to assess the message behind the drums.
- · Don’t trade surges: A price surge is a signature of panic or surprise. In Reproduction or use of the text or pictorial content in any manner without written permission is prohibited. Copyright 2002 by Futures Magazine Group, 250 S. Wacker Dr., Suite 1150, Chicago, IL60606 these events, professional traders take cover and see what happens. The retail trader also should let the market digest such shocks.
Trading during an announcement or right before, or amid some turmoil, minimizes the odds of predicting the probable direction. Technical indicators during surge periods will be distorted. You should wait for a confirmation of the new direction and remember that price action will tend to revert to pre-surge ranges providing nothing fundamental has occurred.
- Simple is better: The desire to achieve great gains in forex trading can drive us to keep adding indicators in a never-ending quest for the impossible dream.
Similarly, trading with a dozen indicators is not necessary. Many indicators just add redundant information. Indicators should be used that give clues to:1) trend direction, 2) resistance, 3) support and 4) buying and selling pres sure.
13.0 Conclusion
Technical analysts consider the market to be 80% psychological and 20% logical. Fundamental analysts consider the market to be 20% psychological and 80% logical. It may be open for debate, but there is no questioning on the current price. After all, it is available for all to see and nobody doubts its legitimacy. The price set by the market reflects the sum knowledge of all participants, and we are not dealing with lightweights here. These participants have considered (discounted) everything under the sun and settled on a price to buy or sell. These are the forces of supply and demand at work. By examining price action to determine which force is prevailing, technical analysis focuses directly on the bottom line: What is the price? Where has it been? Where is it going?
Even though there are some universal principles and rules that can be applied, it must be remembered that technical analysis is more a practitioner’s things form than a science. As over time form, it is subject to interpretation. However, it is also flexible in approach and each trader should use only that which suits his/her style. Developing a style takes time, effort and dedication, but the rewards can be significant.
Today’s markets are incredibly volatile. Plus, thousands competing against HSBC who are constantly looking for an “edge”. The market risk is very real, and can be daunting if HSBC is not prepared. That’s why need a trading strategy that will help to reduce risk and ensure reward.
Appendix
Appendix1: Inter-Bank Transaction in Foreign Exchange on Yearly Basis:
| Calendar Year | Total transactions(Spot and Forward-equivalent in US Dollar) |
| 02-03 | 11,574,579.44 |
| 03-04 | 10,754,685.92 |
| 04-05 | 8,590,738.175 |
| 05-06 | 6,996,650.076 |
| 06-07 | 13,705,791.14 |
Appendix 2: Month to Month Inter-Bank Transaction in Foreign Exchange:
| Month | Amount(Equivalent in US Dollar) |
Sep-06 | 13,673,250 |
Oct-06 | 9,867222.222 |
Nov-06 | 8,601,500 |
Dec-06 | 13,885,833.33 |
Jan-07 | 12,730,526.32 |
Feb-07 | 13,128,947.37 |
Mar-07 | 14,814,868.42 |
Apr-07 | 13,628,571.43 |
May-07 | 14,623,809.52 |
Jun-07 | 17,905,238.1 |
Jul-07 | 17,914,318.18 |
Aug-07 | 16,027,368.42 |
Sep-07 | 10,396,500 |
Appendix3: Quarterly transactions of USD/BDT and Other FCY/BDT Transaction in the inter-bank markets:
| Quarters of year July2006-Jun2007 | USD/BDT Transaction | FCY/BDT Transaction |
| 1st Quarter | 13738515.63 | 746,640.625 |
| 2nd Quarter | 10706875 | 1,478,914.474 |
| 3rd Quarter | 13558114.04 | 677,216.4388 |
| 4th Quarter | 15385873.02 | 675,238.0952 |
Appendix 4: Summary of 23 months Moving Average Calculations:
| Summary of the 12 months moving average calculation | ||||
| Month | Daily market Rate | Moving average forecast | Forecast error | Squared forecast error |
January-06 | 68.65492 | |||
February-06 | 70.23846 | |||
March-06 | 72.13497 | |||
April-06 | 70.63066 | 70.34278333 | 0.287876667 | 0.082872975 |
May-06 | 69.89733 | 71.00136333 | -1.104033333 | 1.218889601 |
June-06 | 70.2956 | 70.88765333 | -0.592053333 | 0.35052715 |
July-06 | 70.37398 | 70.27453 | 0.09945 | 0.009890303 |
August-06 | 70.18733 | 70.18897 | -0.00164 | 2.6896E-06 |
September-06 | 68.33639 | 70.28563667 | -1.949246667 | 3.799562568 |
October-06 | 67.58447 | 69.63256667 | -2.048096667 | 4.194699956 |
November-06 | 71.76473 | 68.70273 | 3.062 | 9.375844 |
December-06 | 70.11912 | 69.22853 | 0.89059 | 0.793150548 |
January-07 | 70.26637 | 69.82277333 | 0.443596667 | 0.196778003 |
February-07 | 69.4276 | 70.71674 | -1.28914 | 1.66188194 |
March-07 | 69.21849 | 69.93769667 | -0.719206667 | 0.517258229 |
April-07 | 69.28277 | 69.63748667 | -0.354716667 | 0.125823914 |
May-07 | 69.3557 | 69.30962 | 0.04608 | 0.002123366 |
June-07 | 69.24568 | 69.28565333 | -0.039973333 | 0.001597867 |
July-07 | 68.9061 | 69.29471667 | -0.388616667 | 0.151022914 |
August-07 | 69.00869 | 69.16916 | -0.16047 | 0.025750621 |
September-07 | 69.33975 | 69.05349 | 0.28626 | 0.081944788 |
October-07 | 69.423 | 69.08484667 | 0.338153333 | 0.114347677 |
November-07 | 69.57957 | 69.25714667 | 0.322423333 | 0.103956806 |
5. Summary of the 15 months exponential smoothing average calculation:
| Summary of the 15 months exponential smoothing average calculation | |||
| Month | Rate (Yt) | Exponential Smoothing Forecast (Ft) | Forecast Error |
Jan-06 | 68.65492 | ||
Feb-06 | 70.23846 | 68.65492 | 1.58354 |
Mar-06 | 72.13497 | 68.971628 | 3.163342 |
Apr-06 | 70.63066 | 69.6042964 | 1.0263636 |
May-06 | 69.89733 | 69.8096 | 0.08773 |
Jun-06 | 70.2956 | 69.82718 | 0.46842 |
Jul-06 | 70.37398 | 69.9209 | 0.45308 |
Aug-06 | 70.18733 | 70.0115 | 0.17583 |
Sep-06 | 68.33639 | 70.0467 | -1.71031 |
Oct-06 | 67.58447 | 69.7047 | -2.12023 |
Nov-06 | 71.76473 | 69.2807 | 2.48403 |
Dec-06 | 70.11912 | 69.7775 | 0.34162 |
Jan-07 | 70.26637 | 69.8458 | 0.42057 |
Feb-07 | 69.4276 | 69.92994 | -0.50234 |
Mar-07 | 69.21849 | 69.8295 | -0.61101 |
Apr-07 | 69.28277 | 69.707298 | -0.424528 |
May-07 | 69.3557 | 69.6223924 | -0.2666924 |
Jun-07 | 69.24568 | 69.56905392 | -0.32337392 |
| 6. Summary of the 12 months Seasonal irregular values: | ||||||
| Summary of the 12 months Seasonal irregular values | ||||||
| Year | Quarter | Rate | Four quarter total | Four quarter moving average | Centered moving average | Seasonal-Irregular Value |
2006 | 1 | 70.34278 | ||||
2 | 70.27453 | |||||
3 | 69.63257 | 280.0726533 | 70.01816333 | 69.9300013 | 1.001260719 | |
4 | 69.82277 | 279.3673567 | 69.84183917 | 69.7193625 | 1.00175671 | |
2007 | 1 | 69.63749 | 278.3875433 | 69.59688583 | 69.5284208 | 1.000984705 |
2 | 69.29472 | 277.8398233 | 69.45995583 | |||
3 | 69.08485 | |||||
7. Comparison of Different forecasted rates with the Actual Market rate:
| Comparison of Different forecasted rates with the Actual Market rate | ||||
| Month | Moving average forecast | Centered moving average | Exponential Smoothing Forecast (Ft) | Actual Market Rate |
Jan-06 | 68.65492 | |||
Feb-06 | 68.65492 | 70.23846 | ||
Mar-06 | 68.971628 | 72.13497 | ||
Apr-06 | 70.34278333 | 69.6042964 | 70.63066 | |
May-06 | 71.00136333 | 69.8096 | 69.89733 | |
Jun-06 | 70.88765333 | 69.82718 | 70.2956 | |
Jul-06 | 70.27453 | 69.93000125 | 69.9209 | 70.37398 |
Aug-06 | 70.18897 | 69.93000125 | 70.0115 | 70.18733 |
Sep-06 | 70.28563667 | 69.93000125 | 70.0467 | 68.33639 |
Oct-06 | 69.63256667 | 69.7193625 | 69.7047 | 67.58447 |
Nov-06 | 68.70273 | 69.7193625 | 69.2807 | 71.76473 |
Dec-06 | 69.22853 | 69.7193625 | 69.7775 | 70.11912 |
Jan-07 | 69.82277333 | 69.52842083 | 69.8458 | 70.26637 |
Feb-07 | 70.71674 | 69.52842083 | 69.92994 | 69.4276 |
Mar-07 | 69.93769667 | 69.52842083 | 69.8295 | 69.21849 |
Apr-07 | 69.63748667 | 69.707298 | 69.28277 | |
May-07 | 69.30962 | 69.6223924 | 69.3557 | |
Jun-07 | 69.28565333 | 69.56905392 | 69.24568 | |
Mean- | 69.95031556 | 69.72592819 | 69.65374169 | 69.83414278 |
8. Exchange rates of Commercial Banks to public for Us Dollar
| U. S. Dollar | ||||||
SL. | Spot Buying | Spot Selling | ||||
No. | Name of Bank | T.T. | O.D.Sight | O.D. | T.T. & | B.C. |
Clean | Exp. Bills | Transfer | O.D. | |||
1 | Agrani Bank | 68.0200 | 68.0000 | 67.7500 | 68.9200 | 68.9700 |
2 | Al-Arafah Islami Bank Limited | 68.5500 | 68.4705 | 68.3900 | 69.6300 | 69.6500 |
3 | Arab Bangladesh Bank Limited | 69.0500 | 68.9500 | 68.5332 | 69.9400 | 69.9900 |
4 | Bangladesh Krishi Bank | 68.0700 | 68.0500 | 67.8300 | 68.9500 | 69.0000 |
5 | Bangladesh Shilpa Bank | 68.0200 | 68.0000 | 67.7400 | 68.9200 | 68.9700 |
6 | BASIC Bank Limited | 68.5500 | 68.4000 | 68.3000 | 69.5700 | 69.6000 |
7 | Bank Asia Limited | 68.9500 | 68.9069 | 68.4674 | 69.9000 | 69.9500 |
8 | BRAC Bank Limited | 68.7500 | 68.7264 | 68.7130 | 69.7000 | 69.7400 |
9 | Citibank, N.A. | 68.9000 | 68.8700 | 68.6656 | 69.9200 | 69.9500 |
10 | Commercial Bank of Ceylon Ltd. | 68.9000 | 68.8732 | 68.7641 | 69.9150 | 69.9450 |
11 | Dhaka Bank Limited | 68.8900 | 68.7369 | 68.4681 | 69.8200 | 69.8800 |
12 | Dutch-Bangla Bank Limited | 68.7200 | 68.6265 | 68.0786 | 69.7000 | 69.7500 |
13 | Eastern Bank Limited | 68.8500 | 68.7429 | 68.3910 | 69.8700 | 69.9000 |
14 | EXIM Bank Limited | 68.5500 | 68.4500 | 68.3539 | 69.4700 | 69.5000 |
15 | First Security Bank Limited | 68.0500 | 67.8650 | 67.5150 | 69.2000 | 69.2500 |
16 | Habib Bank Limited | 68.3000 | 68.4600 | 68.6200 | 69.4700 | 69.5000 |
17 | HSBC Limited | 68.8837 | 68.8795 | 68.6705 | 69.9206 | 69.9447 |
18 | IFIC Bank Limited | 68.6945 | 68.5075 | 68.1335 | 69.4775 | 69.5075 |
19 | Islami Bank Bangladesh Limited | 68.5000 | 68.4500 | 68.2500 | 69.4500 | 69.5000 |
20 | Janata Bank | 68.0200 | 68.0000 | 67.7400 | 68.9200 | 68.9700 |
21 | Jamuna Bank Limited | 68.6000 | 68.4105 | 68.1732 | 69.6750 | 69.7000 |
22 | Mercantile Bank Limited | 68.7000 | 68.5000 | 68.2592 | 69.6500 | 69.7000 |
23 | Mutual Trust Bank Limited | 68.7000 | 68.4023 | 68.1790 | 69.6700 | 69.7000 |
24 | National Bank Limited | 68.5000 | 68.4100 | 68.1600 | 69.4500 | 69.5000 |
25 | NCC Bank Limited | 68.9000 | 68.8000 | 68.7000 | 69.8500 | 69.9000 |
26 | ONE Bank Limited | 68.6340 | 68.6022 | 68.2147 | 69.5500 | 69.6000 |
27 | Prime Bank Limited | 68.9000 | 68.7124 | 68.4981 | 69.8500 | 69.9000 |
28 | Pubali Bank Limited | 68.4500 | 68.3500 | 68.3000 | 69.4500 | 69.5000 |
29 | Rupali Bank Limited | 68.2500 | 68.2000 | 68.0000 | 69.2300 | 69.2500 |
30 | Shahjalal Islami Bank Limited | 68.8500 | 68.6626 | 68.2074 | 69.8600 | 69.9000 |
31 | Social Investment Bank Limited | 68.9000 | 68.7401 | 68.1912 | 69.7500 | 69.8000 |
32 | Sonali Bank | 68.0200 | 68.0000 | 67.7400 | 68.9200 | 68.9700 |
33 | Southeast Bank Limited | 68.7500 | 68.5500 | 68.1000 | 69.6500 | 69.7500 |
34 | Standard Bank Limited | 68.9000 | 68.8001 | 68.7003 | 69.8600 | 69.9000 |
35 | Standard Chartered Bank | 68.9000 | 68.8770 | 68.8311 | 69.9200 | 69.9500 |
36 | State Bank of India | 68.6500 | 68.6175 | 68.3700 | 69.6500 | 69.7000 |
37 | The City Bank Limited | 68.9000 | 68.8062 | 68.4558 | 69.7800 | 69.8500 |
38 | The Oriental Bank Limited | 67.8000 | 67.6995 | 67.5682 | 68.8500 | 68.9000 |
39 | The Premier Bank Limited | 68.0500 | 67.8912 | 67.7551 | 69.2000 | 69.2500 |
40 | The Trust Bank Limited | 68.9500 | 68.8500 | 68.5500 | 69.8000 | 69.8500 |
41 | United Commercial Bank Limited | 68.8500 | 68.7500 | 68.5900 | 69.8200 | 69.8500 |
42 | Uttara Bank Limited | 68.4400 | 68.3403 | 68.1350 | 69.4500 | 59.5000 |
| Average | 68.5908 | 68.4985 | 68.2631 | 69.5607 | 69.3664 | |
Some More Parts-
Report on Forecasting Techniques in Foreign Exchange Markets (Part-1)
Report on Forecasting Techniques in Foreign Exchange Markets (Part-2)