BOARD OF DIRECTORS
The Directors of the Board are appointed by the Shareholders in the Annual General Meeting (AGM) who are accountable to the Shareholders. The Board is responsible for guiding the Company towards the goal set by the Shareholders. The Board also ensures that Grameenphone Policies & Procedures and Codes of Conduct are implemented and maintained; and the Company adheres to generally accepted principles for the governance and effective control of Company activities. In addition to the other legal guidelines, the Grameenphone Board has also adopted “Governance Guidelines for the Board” for ensuring better governance in the work and the administration of the Board.
The Board of Directors in Grameenphone is comprised of nine members including the Chairman who is elected from among-st the members. In compliance with the Corporate Governance Guidelines issued by the Securities and Exchange Commission (SEC) and as per the provision of the Articles of Association (AOA) of the Company, the Board of Directors in its 101st Board meeting held on March 19, 2010 appointed an Independent Director to the GP Board.
The AOA requires the Board to meet at least four times a year and otherwise when duly called for in writing by a Board member or Shareholder. Dates for Board Meetings in the ensuing year are decided in advance and the notice of each Board Meeting is served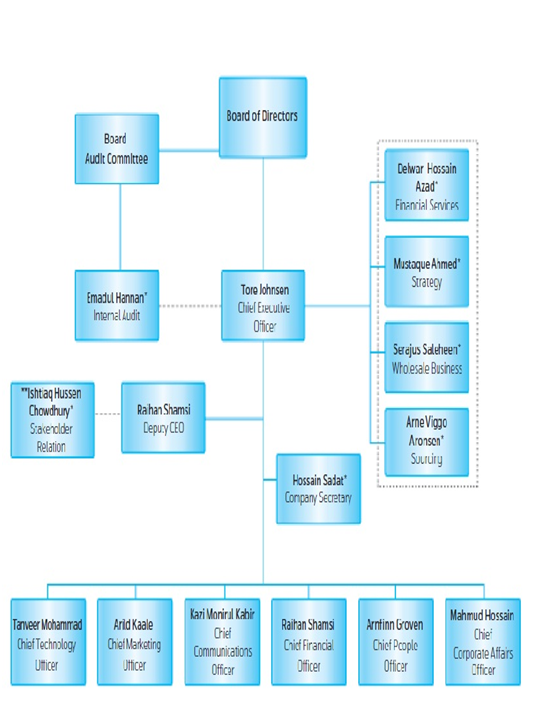
Figure 13: Board of Directors Grameenphone.
CONTROL ENVIRONMENT IN GRAMEENPHONE:
| |||||||||||||||||||||||||||||||||||||||||||||||||||||||||
CONTROL ENVIRONMENT IN GRAMEENPHONE
| In implementing the right Governance in Grameenphone, the Board and the Management Team ensures the following: | |||||||||||||||||||||||||||||||||||||||||||||||||||||||||||||||||||||||||||||||||||||||||||||||||||||||||||||||||||||||||||||||||||||||||||||||||||||||||||||||||||||||||||||||||||||||
MANAGEMENT TEAM OF GRAMEENPHONE LIMITED The Management Team is the Executive Committee of Grameenphone managing the affairs of the Company. The Management Team consists of the CEO and other key Managers across the Company. The CEO is the leader of the team. Management Team endeavors to achieve the strategic goals & mission of the Company set by the Board of Directors.
The Management Team meets on a weekly basis to monitor the business performance of the Company. Grameenphone places a high value on human resource development and the contributions made by its employees. They persevere to maintain a productive and harmonious working environment in the whole organization. GP always continues with its efforts to improve the efficiency of its employees and align them to the right positions with well-defined responsibilities.
Because of the rapid expansion of GP’s networks and enormous growth of its subscriber base, the company has increased its workforce to almost 4700 persons till the beginning of 2012. Grameenphone has successfully hired some key senior managers who were recruited on the basis of their professional expertise and experience. In order to cope up with the dynamic nature of the company’s business, initiatives are always taken to restructure and reorganize the company’s existing set up. It always evolves standardized management systems and procedures across functional divisions, focusing in particular, on the effective integration and assimilation of all the organizational units. The internal organizational functions of Grameenphone Ltd. are done by six functional divisions. The divisions are: Finance Division. People and Organization Division. Commercial Division. Communication Division. Technology Division. Corporate Affairs Division. CORPORATE GOVERANCE
| |||||||||||||||||||||||||||||||||||||||||||||||||||||||||||||||||||||||||||||||||||||||||||||||||||||||||||||||||||||||||||||||||||||||||||||||||||||||||||||||||||||||||||||||||||||||
Quantitative Analysis
Quantitative ANALYSIS:
ANALYSIS OF FINANCIAL PERFORMANCE OF GRAMEENPHONE
Financial performance analysis is very important for any organization. This kind of analysis has so many implications in organization. By analyzing the financial conditions, the management of the respective organization can understand the problems of the organization and take necessary measures to resolve the problems. In this analysis I tried to find out the condition of Grameenphone’s profitability, liquidity, market ratios and capital structure. Performance evaluation can help:
To find out whether the organization uses its capacity or not.
To determine the financial condition of the organization.
To judge the earning capacity of the organization and whether dividends can be paid out of profit or not.
To identify the organization’s potential for growth. The institutional investors are interested in this respect.
To identify the solvency of the organization.
It supplies information to the users in various dimensional decisions making.
The financial analysis is done mainly in two parts. The first part consists of the financial trend analysis of revenue, operating profit, total assets, operating cost, non-operating cost and other important measures and the second part consists of the financial ratio analysis of Grameenphone Limited.
FIVE YEAR FINANCIAL SUMMARY
For the analysis I have to present the related financial data of Grameenphone. By using these data I analyzed the financial performance of the organization. The following tables show the five year annual results in brief:
Table 7: Operational results (2006-2010)
Operational Result in million BDT | 2006 | 2007 | 2008 | 2009 | 2010 |
| Revenue | 45,640 | 54,303 | 61,359 | 65,300 | 74,733 |
| Gross profit | 26,962 | 29,946 | 28,667 | 32,222 | 38,730 |
| Operating profit | 18,195 | 16,287 | 15,350 | 20,518 | 20,207 |
| Profit before tax | 17,020 | 13,535 | 11,579 | 18,595 | 20,913 |
| Net profit after tax | 7,484 | 3,060 | 2,984 | 14,968 | 10,705 |
Source: Grameenphone Annual Report 2010.
Table 8: Financial position (2006-2010)
Financial position in million BDT | 2006 | 2007 | 2008 | 2009 | 2010 |
| Paid up capital | 2,430 | 2,430 | 12,152 | 13,503 | 13503 |
| Shareholders’ equity | 24,509 | 26,111 | 27,588 | 50,154 | 48032 |
| Total assets | 66,757 | 88,461 | 108,194 | 109,162 | 109502 |
| Total liabilities | 42,247 | 62,350 | 80,606 | 59,008 | 61470 |
| Current assets | 10,442 | 6,851 | 14,430 | 22,182 | 30802 |
| Current liabilities | 23,568 | 36,445 | 50,231 | 38,952 | 44642 |
| Noncurrent assets | 56,314 | 81,610 | 93,765 | 86,981 | 78700 |
| Noncurrent liabilities | 18,680 | 25,905 | 30,375 | 20,056 | 16828 |
Source: Grameenphone Annual Report 2010
Table 9: Financial ratios (2006-2010)
Financial ratios | 2006 | 2007 | 2008 | 2009 | 2010 |
| Current asset to current liability | 0.44 | 0.19 | 0.29 | 0.57 | .69 |
| Debt to equity | 0.32 | 0.63 | 0.68 | 0.14 | .11 |
| Gross profit margin | 59% | 55% | 47% | 49% | 52% |
| Operating profit margin | 40% | 30% | 25% | 31% | 27% |
| Net profit margin | 16% | 6% | 5% | 23% | 14% |
| Return on equity | 35.0% | 12.1% | 11.1% | 38.5% | 22% |
| Return on total assets | 12.9% | 3.9% | 3.0% | 13.8% | 10% |
Source: Grameenphone Annual Report 2010
Table 10: Ordinary share information (2006-2010)
Ordinary share information | 2006 | 2007 | 2008 | 2009 | 2010 |
| Ordinary share outstanding (in millions) | 56.52 | 56.52 | 12,151.75 | 13,503.00 | 13503.00 |
| Face value per share | 43 | 43 | 1 | 10 | 10 |
| Cash dividend on paid up capital | 60% | 62% | 13% | 60% | 120% |
| Dividend payout | 19% | 49% | 53% | 54% | 151% |
| NAV per share | 20.17 | 21.49 | 22.70 | 37.14 | 35.57 |
| Net operating cash flow per share | 21.53 | 19.86 | 20.24 | 24.77 | 23.16 |
| Earnings per share | 132.41 | 54.41 | 0.25 | 12.08 | 7.93 |
| Adjusted EPS | 6.16 | 2.52 | 2.46 | 12.08 | 7.83 |
Source: Grameenphone Annual Report 2010
FINANCIAL TREND ANALYSIS
In this part I am trying to find out the 5 year financial trend of Grameenphone’s revenue, profit before taxes, net profit after taxes, capital expenditure, operating cost, Grameenphone’s assets, owners’ equity and liability.
I also presented data on net cash flow per share and net asset value per share of Grameenphone Limited. For the mobile service operators Average Revenue per User (ARPU) analysis is very important. I also tried to illustrate the Average Revenue per User data of Grameenphone.
REVENUE
For the financial analysis the thing that comes first is the revenue earned by the particular company. To find out the performance of Grameenphone in terms of revenue earnings following figure is presented with Grameenphone’s revenue of last 5 years with annual diversified growth rate.
Table 11: GP Revenue growth for 5 years.(2006-2010)
Year | Revenue(million BDT) | Annual Growth Rate |
2006 | 45640 | 55% |
2007 | 54303 | 19% |
2008 | 61359 | 13% |
2009 | 65300 | 1.73% |
2010 | 74733 | 14.44% |
Source: Grameenphone Annual Report 2010
From the table we can identify that, the revenue growth rate is decreasing year by year. In the year 2006, the growth rate was the highest that is 55% from the previous year 2005. The major identification is that, the growth rate is positive.
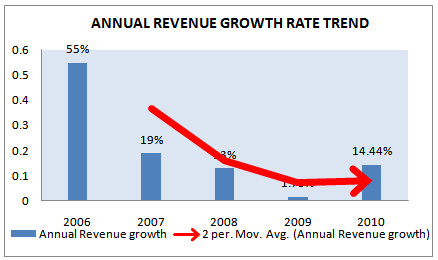
Figure 14: Revenue growth (2006-2010).
From the above figure it is also clearly shown that the revenue earnings of the Grameenphone increase year to year. The past data shows that profitability of GP did not decrease for any year during the last 5 years. And it is the most amazing thing that the revenue of GP became almost 2 times higher within that period from 2006 to 2010. The lager increase is occurred in 2006 when the revenue is increase approximately 55% compared to 2005. And all of these years GP can maintain a healthy rate of revenue earnings. Revenue increased by 14.44% (BDT 3.9 billion) 2010 than the previous year 2009. The most recent increase in the sales or revenue is caused by the sales of GP internet modem and GP handsets, which hit in the market at a great extent.
PROFIT BEFORE TAX
Then the next important thing is the profitability that means net profit. Before going to the net profit I will present the information about earnings ‘profit before tax (EBT)’ by the GP during the last 5 years. Because the tax rate in Bangladesh is changed for many times during that period and it has the probability to affect the net income. So before going to the net income EBT discussion is necessary. The figure below shows the conditions of profit before taxes and tax paid during the years (2006 to 2010).
Table 12: Profit before taxes for 5 years. (2006-2010)
year | Profit before taxes(million BDT) |
Annual Growth Rate |
2006 | 17,020 | 45% |
2007 | 13,535 | -20% |
2008 | 11,579 | -14% |
2009 | 18,595 | 61% |
2010 | 20,913 | 12.46% |
Source: Grameenphone Annual Report 2010
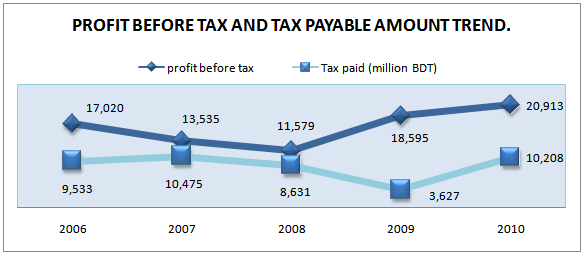
Figure 15: Profit before taxes and tax paid (2006-2010)
The figure shows an increasing trend in profit before taxes 2006; then decrease in 2007 and 2008 and again increase in 2009 and 2010. But the Tax line shows that tax are in slow increasing rate from 2006 and it became much higher in 2007 but the tax is deceased thereafter and again increase at 2010. The more stimulating news is that GP’s tax rate will reduced by 10% in 2010, which was previously 37.5% of income and this year it will 27.5% of income, because of being public limited company. This caused a 61% growth in profit before taxes in 2010. It will be a greater advantage for Grameenphone Limited over the other mobile phone operators.
NET PROFIT AFTER TAX
In the net profit after taxes table, we can see that there had been some ups and downs in different periods. There was an increasing trend up to 2006; in 2007 it drops about 59% from the previous year, again drops 2% in 2008 and in 2009 the growth rate of Net Profit after Tax is almost increase by 402%. This increase was due to higher revenue and lower operating expenses.
Table 13: Net Profit after Taxes growth for 5 years (2006-2010)
year | NPAT(million BDT) | Annual Growth Rate |
2006 | 7484 | 8% |
2007 | 3060 | -59% |
2008 | 2984 | -2% |
2009 | 14968 | 402% |
2010 | 10705 | -0.28% |
Source: Grameenphone Annual Report 2010
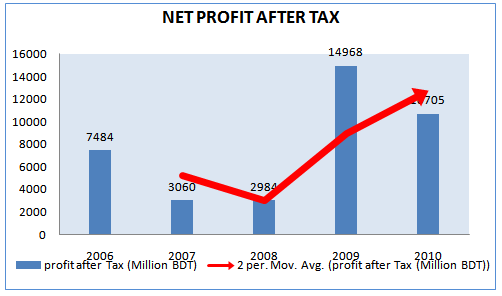
Figure 16: Net Profit after Tax (2006-2010)
Another reason of increase in the net profit of the company is the performance and services offered to the customers by Grameenphone. In addition, 2008 net profit after tax was lower due to one-time regulatory payment. Profit Trend for grameenphone is continuing in 2010 as well .But in comparison to 2009 it is downwards.
CAPITAL EXPENDITURE
Capital expenditure mines the long term capital expense for the company. At year 2007 Grameenphone make the highest percentage of capital expenditure.
Table 14: Capital Expenditure for 5 years (2006-2010)
year | CAPEX(million BDT) | Annual Growth Rate |
2007 | 21,656 | -17% |
2008 | 35,763 | 65% |
2009 | 27,351 | -24% |
2010 | 10,369 | -62% |
Source: Grameenphone Annual Report 2010.
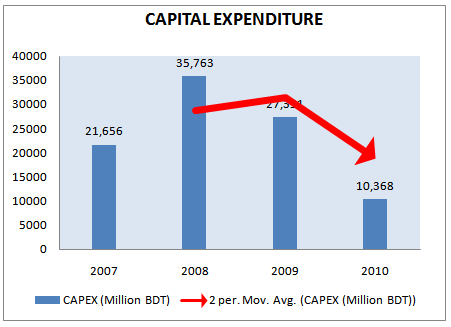
Figure 17: Capital Expenditure (Million BDT) (2006-2010)
From the figure we can see that the capital expenditure of Grameenphone is decreasing for the last four years. In the last five years the capital expenditure was highest in 2008. The decreasing trend of CAPEX in recent years 2010 a good sign for Grameenphone Limited.
OPERATING COST
Operating cost are non-capital expenses incurred by a company in normal operations such as salaries and wages, insurance costs, floor space rental, electricity, computer maintenance contracts, software maintenance contracts, and so on. In brief, almost all routine expenditures a company makes are operating expenses. For the analysis data are taken for the last 5 years. The above mentioned figure shows that the Operating cost (OC) of GP in increase up to 2008 with same portion of increase in revenue but decreased in 2009 when the profit before tax EBT of GP is again became high.
Table 16: Operating cost and Non-operating cost for 5 years (2006-2010)
Year | Operating Cost(MILLION) | Annual Growth Rate of Operating Cost | Non-operating cost |
2006 | 27,547 | 62% | 1,178 |
2007 | 38,054 | 38% | 2,755 |
2008 | 46,061 | 21% | 3,771 |
2009 | 44,825 | -3% | 1,922 |
Source: Grameenphone Annual Report 2010
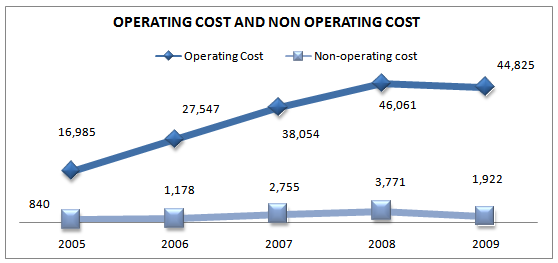
Figure 18: Operating cost and non-operating cost trend for 5 years (2006-2010)
But that impact has little effect as the revenue of GP also increases with that. Our desired result will be finding out by tracking the line of Non-operating cost (NOC). The NOC of GP in increased tremendously in 2007 and 2008 almost equal to the decrease amount of EBT.
So it can be conclude that the decrease in EBT of GP in the year 2007 and 2008 occurred because of increase in non-operating cost. But increase in non-operating cost was happened because GP was fined twice by BTRC during that period which affects the profitability of the GP.
TOTAL ASSETS
Another important part of the financial analysis of any organization is the analysis of assets of the organization, because assets provide the base of future profitability and give the organization strength to operate in full speed. And the assets indicates the capability of the organization to serve its’ customers. The assets of the GP in last 5 years are as follows-
Table 16: Total Assets of Grameenphone for 5 years(2006-2010)
year | Total Assets(Million BDT) | Annual Growth Rate |
2006 | 66,757 | 35% |
2007 | 88,461 | 33% |
2008 | 108,194 | 22% |
2009 | 109,162 | 1% |
2010 | 109,502 | .31% |
Source: Grameenphone Annual Report 2010
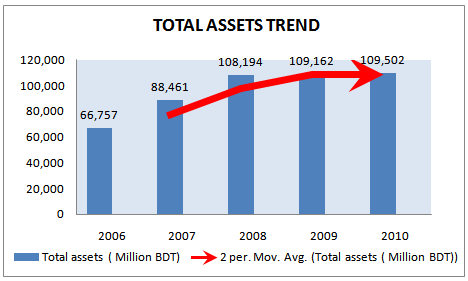
Figure 19: Total Assets trend for 5 years (2006-2010)
The assets of the GP increase throughout the last 5 years at a very satisfactory rate. In the last 5 years the assets growth rate is also very satisfactory, which indicate that with the increase in the volume of market, GP’s infrastructure and capabilities also increase at that time to serve the increased market. Grameenphone’s current asset base increased by BDT 7.6 billion mainly in cash and bank balance resulting from higher net cash from operations and proceeds from IPO. But the financing of these assets is another part of analysis, because, assets can be acquired in two ways –
(1) Through decreasing liabilities, (2) Through increase equity.
To know that we can analyze the equity and debt of GP in different years, which are presented in the following part.
OWNERS EQUITY AND LIABILITY
To meet up the financing of increase in assets GP use both debt and equity in equal portion up to 2004. But thereafter the main parts of the financing were come from the debt rather than equity. Though equity also increase in small extend. But in the last year equity portion was used as much higher that, it almost became equal to the debt portion of GP. At end of the 2009 GP was running with 54% debt and 46% equity. So at present the debt and equity of the GP are in balanced situation and in 2010 table show that equity financing has decreased by .20 % and debt financing has increased by 4.17 %.
Table 17: Total Owners Equity and Liability for 5 years (2006-2010)
Year | Total Equity (million BDT) | Annual Growth Rate | Liability | Annual Growth Rate of Liability |
2006 | 24,509 | 34% | 42,247 | 35% |
2007 | 26,111 | 7% | 62,350 | 48% |
2008 | 27,588 | 6% | 80,606 | 29% |
2009 | 50,154 | 82% | 59,008 | -27% |
2010 | 40,032 | (-) .20% | 61,470 | 4.17% |
Source: Grameenphone Annual Report 2010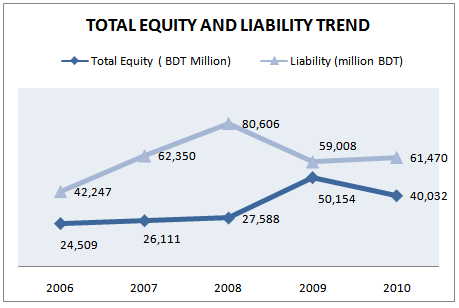
Figure 20: Total Owners Equity and Liability (2006-2010)
Total liabilities decreased during the year mainly due to early settlement of entire bond obligation, repayment of short-term borrowings, reduced deferred tax liabilities due to change in corporate tax rate and allocation of shares to Private Placement Offering (PPO) investors from advance against IPO.
OTHERANALYSIS
Some other analysis is very important for the company. Such as net cash flow, net assets value per share, earning per share, ARPU .these are illustrated below:
NET CASH FLOW PER SHARE
Net cash flow per share is a measure of an organizations financial strength. It is a useful measure for the organizational strength and the sustainability of its business model and its implication. Net Cash flow shows the result of cash inflow and out flows difference.
Table 18: Net cash flow per share for 5 years
year | Net cash flow/share(BDT) |
2006 | 21.53 |
2007 | 19.86 |
2008 | 20.24 |
2009 | 24.77 |
2010 | 23.16 |
Source: Grameenphone Annual Report 2010
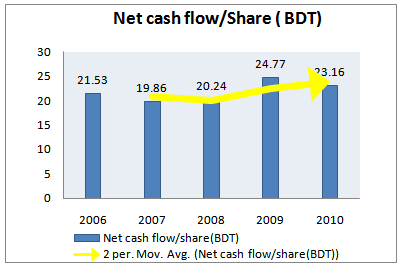
Figure 21: Net cash flow per share (2006-2010)
From the above figure, we can find out that for the last five years the cash flow per share is increasing. This is a very good sign for the investors. In 2006 net cash flow per share was 21.5.; it increased in 2009 up to 24.7 and then drops to 23.16 in 2010, but maintains an increasing trend up to 2010. Overall trend for the last five year is upward and positive movement which indicates that grameenphone LTD is going good with its financial strength.
NET ASSET VALUE PER SHARE
Net asset value per share is a financial term for net asset value that represents a company’s value per share. This term is also referred to as “book value per share”, is usually below the market price per share.
Table 19: Net asset value per share for 5 years
Year | NAV/share (BDT) | Annual Growth Rate |
2006 | 20.17 | 34% |
2007 | 21.49 | 7% |
2008 | 22.70 | 6% |
2009 | 37.14 | 64% |
2010 | 35.57 | -4.2% |
Source: Grameenphone Annual Report 2010
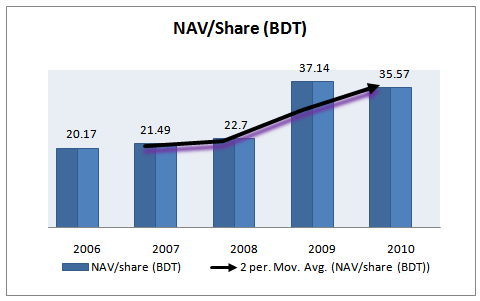
Figure 22: Net asset value per share (2006-2010)
In 2009 Grameenphone’s NAV was 37.14, which is the highest with a growth rate of 64%. So the company’s stocks have strong value in the market. This basis for this increase is that Grameenphone has performed very well in their business. In 2010 net assets value of grameenphone decrease by only .04%.but overall maintaining a good rate though its shareholder is increase day by day.
EARNING PER SHARE
Stockholders are concerned about the earnings that will eventually be available to pay them dividends or that are used to expand their interest in the firm because the firm retains the earnings. These earnings may be expressed on a per share basis. Earnings per share are calculated by dividing net income by the number of shares outstanding. Shares authorized but not issued, or authorized, issued and repurchased (treasury stock), are omitted from the
Table 20: Adjusted Earnings per share.
Year | Adjusted EPS (BDT) | Annual Growth Rate |
2006 | 6.16 | 8% |
2007 | 2.52 | -59% |
2008 | 2.46 | -2% |
2009 | 12.08 | 391% |
2010 | 7.93 | -34% |
Source: Grameenphone Annual Report 2010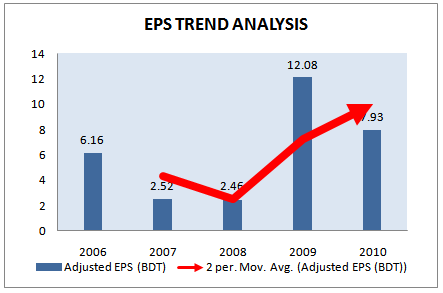
Figure 23: Adjusted Earnings per share (2006-2010)
From the above figure we can find that, in the year 2009 the EPS is the highest (12.08 BDT). In 2005 and 2006 there was an increasing trend in EPS, but it dropped in 2007 and 2008 and again goes up at 2009 and again drop at 2010.
EPS influence the shareholder to invest in the company it also show the efficient management operation of the company. Due to decreasing in net operating earning it is a cause of reduction in EPS at 2010 by 34%.
AVERAGE REVENUE PER UNIT
Table 21: Average Revenue per User for 5 years (2006-2010)
year | Average Revenue per User(BDT) | Annual Growth Rate |
2006 | 466 | – |
2007 | 329 | -29% |
2008 | 262 | -20% |
2009 | 250 | -5% |
2010 | 231 | -7.6 |
Source: Grameenphone Annual Report 2010
From the above table we can see that, there exists a negative growth rate in average revenue per user through last five years. That means per user revenue is decreasing for Grameenphone.
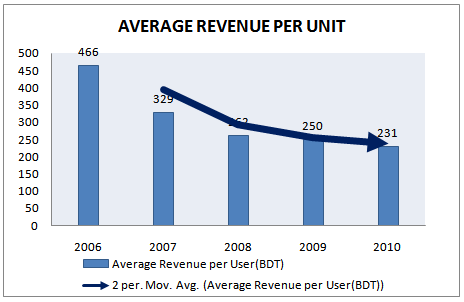
Figure 24: Average Revenue per User (BDT) (2006-2010)
Considering the ARPU trend over the last five years, a further decline in ARPUs is expected, largely because of price war among the cellular operators, revenue growth of the Company may come under pressure. However, through diversifying its product base, adding more value added features, GP is expected be able to maintain its revenue level at upward trend.
FINANCIAL RATIO ANALYSIS
Another important way to analysis the performance of the business is financial ratio analysis. Because financial ratio analysis enables us to calculate return, liquidity power earnings etc. Financial ratios are useful indicators of a firm’s performance and financial situation. Financial ratios can be used to analyze trends and to compare the firm’s financials to those to other firms. Different ratio analysis on last few years’ data is given below.
LIQUIDITY DIMENSION
A firm’s ability to pay its debts can be measured partly through the use of liquidity ratios. A firm should ensure that it does not suffer from lack of liquidity and also that it is not too much highly liquid. Short term liquidity involves the relationship between current assets and current liabilities. If a firm has sufficient net working capital (the excess of current assets over current liabilities), it is deemed to have sufficient liquidity. There are some ratios that are commonly used to measure liquidity directly, they are:
1. Current ratio
2. Quick ratio or acid test
CURRENT RATIO CALCULATION
The current ratio is a ratio of the firm’s total current assets to its total current liabilities. The current ratio is computed by dividing current assets by current Liabilities. Current asset normally includes cash, sundry debtors, inventory, marketable securities, and current liability consists of Sundry creditors, short-term loans and advance current liabilities and provision for taxes and other accrued expenses.
The ratio is generally an acceptable measure of short term creditors are covered by assets that are likely to be converted into cash in a period corresponding to the maturity of the claims .A low ratio is an indicator that a firm may not be able to pay its future bills on time, particularly if conditions change, causing a slowdown in cash collections. A high ratio may indicate an excessive amount of current assets and management’s failure to utilize the firm’s resources properly.
Grameenphone LTD. has formed in 1997 but still their current asset is lower than current liability. As a result current ratio of this company is very low. We hope they will recover from this situation soon. In last five years current ratio has decreased 2007 from 2008 but in 2009 and 2010 it has increased because in those years current liability has decreased. By going through over the components of current assets in year 2007 and 2008 we have seen that cash disburse for BTRC Fine and infrastructure development increased at a higher rate compare with previous years and other factors are almost same.
Current Ratio = (Current Asset / Current liability)
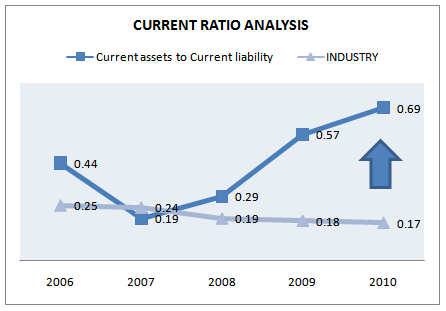
Figure 25: Current ratio trend (2006-2010)
Analyzing current asset we see that all of the components has increased over 5 years except few cases. But few of the part of this asset are inventory and account receivables. This inventory is not a pure liquid that’s why it doesn’t give us actual liquidity position of grameenphone. To get more pure ratio we will discuss about quick ratio. But in comparison to industry average in last five years except 2007 grameenphone is performing is very well.
QUICK RATIO CALCULATION
The quick ratio, which is also known as acid-test ratio is a better test of financial strength than the current ratio, as it gives no consideration to inventory, which may be very slow moving. A comparison of the current ratio with quick ratio would give an indication regarding inventory position.
Moreover, in the very short-term the ability to meet requirements of cash can be judged only on the basis of a properly drawn cash budget and not on the basis of the quick ratio.
QuickRatio= {(Cash+ marketable security+ Receivable)/Current liability}
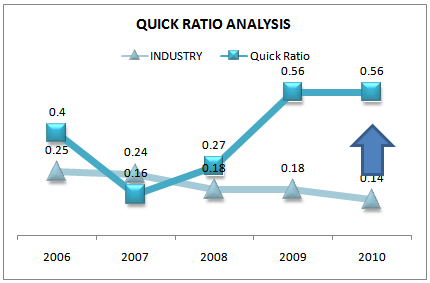
Figure 26: Quick ratio trend (2006-2010)
Here we see that current ratio in 2010 is 1.23 time higher than quick ratio. Quick ratio has increased day by day compared to current ratio. The quick ratio is increasing from 2006 because the components of current asset except inventory are increasing at higher rate than that of current liability but in 2007 and 2008 it decrease dramatically due to increase in current liability. By analyzing quick ratio 2009 and 2010 we have realized that the company is more focus on increasing current assets and minimize current liabilities, which can’t make any profit. To increase quick ratio and as well as their actual liquidity position they need to more conscious about company resources utilization properly.Increased in quick ratio in 2009 and 2010 is a good sign for short term creditors of Grameenphone. As per industry concern grameenphone in doing very well because industry average at 2010 is only 0.14 which is less than company achievement.
ACTIVITY DIMENSION
Activity ratios reflect the firm’s efficiently in utilizing its assets. The funds of creditors and owners are invested in various kinds of assets to generate sales and profits. The better the management of assets the larger the amount of sales. These ratios are also called Turnover Ratios because they indicate the speed with which assets are being converted or turned over into sales. A proper balance between assets and sales generally reflects that the assets are managed well. There are some ratios under these criteria. They are as follows:
1. Accounts receivable turnover,
2. Average collection period,
3. Inventory turnover,
4. Accounts Payable turnover,
5. Accounts Payable turnover in days,
ACCOUNT RECEIVABLE TURNOVER
AccountsReceivableTurnover means Money owed by customers (individuals or corporations) to another entity in exchange for goods or services that have been delivered or used, but not yet paid for. Receivables usually come in the form of operating lines of credit and are usually due within a relatively short time period, ranging from a few days to a year.
The Accounts receivable turnover is a comparison of the size of the firm’s sales and the size of its uncollected bills from customers. If the firm is having difficulty collecting its money, it has a large receivables balance and a low ratio. If it has a strict credit policy and aggressive collection procedures, it has a low receivable balance and a high ratio. It measures the effectiveness of the firm’s credit policy.
Accounting receivable turnover= (Net annual sale/ Average Receivable)
Accounting receivable turnover (Times)
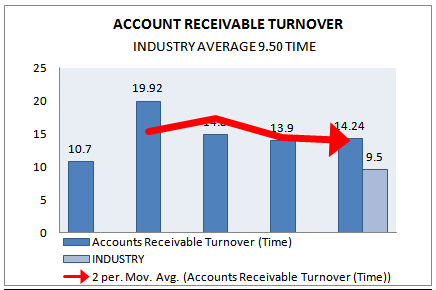
Figure 27: Account receivable Turnover (Time) Trend (2006-2010).
We have seen that for grameenphone at 2007 is the best year in comparison to nearest year; because among the last five year data at 2007 average account receivable turnover is almost 19.92 and it’s gradually reduce in 2009 and 2010.In comparison to industry grameenphone is performing very well because at 2010 industry average only 9.50 times but at the same time grameenphone achieved almost 14.24 times.
AVERAGE COLLECTION PERIOD (days)
The average collection period provides a rough approximation of the average time that it takes to collect receivables. It compares the receivables balance with the daily sales required to produce the balance. The ratio reflects the average collection period. Average collection period means the approximate amount of time that it takes for a business to receive payments owed, in terms of receivables, from its customers and clients.
At 2007 average collection period is best in comparison to the recent year data. Lowest the collection period shows the superior efficiency.
Accounting collection period (days) = (360/ Average Receivable turnover)
Accounting collection period (days) | INDUSTRY AVERAGE 2010 |
2010 |
2009 |
2008 |
2007 |
2006 |
30 DAYS | 25.63 | 26 | 24 | 18 | 34 |
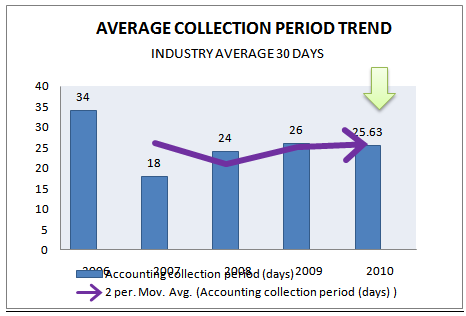
Figure 28: Accounting collection period (days) (2006-2010).
In comparison to the previous period it’s gradually increasing day by day. So we can say that company management is not doing well. Though in comparison to industry it is good but for Long Run Operation Company need to more focus to reduce average receivable collection period.The goal of any company should be increase sale without increasing receivable because it tied up the cash balance and makes ultimate loss for the company.
INVENTORY TURNOVER
This relationship expresses the frequency with which average level of inventory investment is turned over through operations. The higher the inventory turnover the larger the amount of profit, the smaller the amount of capital tied up in inventory and the more current the other stock. Moreover, a firm with a high turnover has a great competitive advantage as it can afford to sell its inventory at a lower price because increased sales volume may yield a larger total profit even though the margin of profit unit is slightly less.
The preferred turnover ratio is relative to CGS which does not include the profit implied in sale. The better benchmark is to compare with the industry average. At 2009 it is far better because the ratio is lower in 2008.Among the last five year data we have seen consistency in the liquidity of the company. In comparison to industry at 2010 company is not doing well because industry average at 2010 is almost 50 times but for the company it’s only 43.15 times.
Inventoryturnover defined as a method to show the liquidity of the inventories based on the firms inventory turnover and the implied processing time .inventory turnover can be calculate relative to sale or cost of goods sold.
Inventory turnover= (CGS/ Average inventory)
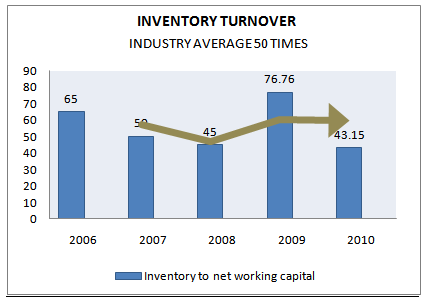
Figure 29:INVENTORY TURNOVER(2006-2010).
Normally when inventory turnover increases we think that the stock of inventory is going to be finished but in this case the level of inventory has not decreased and thus we can guess that the firm will not face any inventory problem. But one thing is important that they are holding much more inventory, which has tied up the cash balance.
DAYS TO INVENTORY (DAYS)
If the Inventory turnover period is more rotate its shows the greater efficiency, so in comparison to the data among last five years at 2006 is showing the worst situation. Day by its reduce and show great efficiency. Company need to be more focus on maintaining days to inventory turnover.
DaysofInventory(days) = (365/annual inventory turnover)
DaysofInventory(days)
| INDUSTRY AVERAGE 2010 | 2010 | 2009 | 2008 | 2007 | 2006 |
10 | 8.45 | 4.75 | 5 | 12 | 19 |
In comparison to industry, company is almost near to industry. Industry average at 2010 is 10 days for processing inventory and company is having 8.45 days for processing. So we can say company is doing very well.
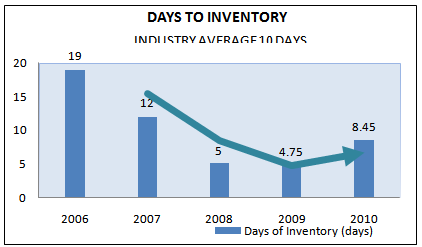
Figure 30: Days to inventory (2006-2010).
ACCOUNTS PAYABLE PERIOD (Days)
The accounts payable turnover indicates ratio of accounts payable compare with sales of a firm. This ratio indicates the rapidity of accounts payable to be turned into cash. It measures the tendency of a firm’s policy whether stretch payable or not. The accounts payable turnover ratio also indicates how many times a company pays off its suppliers during an accounting period. It measures how a company manages paying its own bills. A higher ratio is generally Show less efficiency.
Accountspayableperiod(days) = 365/ (Net annual purchase/ Average purchase)
Accounts payable period turnover(Days) | INDUSTRY AVERAGE 2010 |
2010 |
2009 |
2008 |
2007 |
2006 |
40 | 48 | 52 | 43 | 120 | 92 |
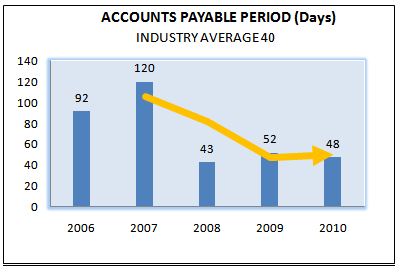
Figure 31: Accounts payable period (days) (2006-2010).
At 2007 among the last five year data is the greatest year in terms of accounts payable period , because at that time it was almost 120 days to paid up to the supplier. Day by day it’s seemed as alarming for grameenphone that it becomes less day by day. In comparison to industry it is far more batter and maintain a good trade cycle. It means the firm maintains a low Accounts payable.
So, we can say that the firm pays their accounts payable immediately. As a result there is a low balance of cash. One thing is important that a firm can earn money by stretching account payable because they don’t have to pay interest for that. Thus the way they can use cost free fund.
PROFITABILITY DIMENSION:
There are many measures of profitability, which relate the returns of the firm to its sales, assets, or equity. As a group, these measures allow the analyst to evaluate the firm’s earnings with respect to a given level of sales, a certain level of assets, or the owners’ investment. Without profits, a firm could not attract outside capital. Moreover, present owners and creditors would become concerned about the company’s future and attempt to recover their funds. Owners, Creditors, and management pay close attention to boosting profits due to the great importance placed on earnings in the marketplace. The profitability ratios are:
(1). Gross profit margin
(2). Operating profit margin
(3). Net profit margin
(4). Return on total asset (ROA)
(5). Return on total equity (ROE).
GROSS PROFIT MARGIN:
The gross profit margin is a measure of the gross profit earned on sales. Gross profit margin serves as the source for paying additional expenses and future savings. The gross profit margin considers the firm’s cost of goods sold, but does not include other costs. It is also known as “gross margin”. The gross profit margin measures the percentage of each sales amount remaining after the firm has paid for its goods. It may be used as an indicator of the production operation and the relation between production cost and selling price. The gross profit margin is calculated as follows:
Gross profit margin = (Revenue – Cost of goods sold /Revenue)
| Gross profit margin | INDUSTRY AVERAGE 2010 | 2006 | 2007 | 2008 | 2009 | 2010 |
30% | 59% | 55% | 47% | 49% | 51% |
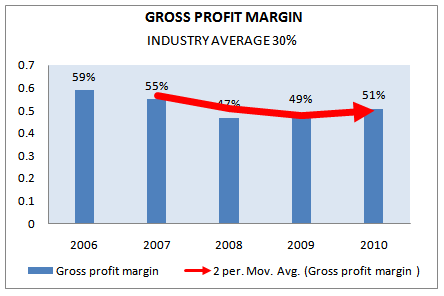
Figure 32:Gross profit margin (2006-2010).
Though the decreasing trend indicates that, the sales of Grameenphone are decreasing, Grameenphone maintains a good gross profit margin in each and every year. All the years it earns gross profit over 47%.
The gross profit margin has slightly decreased in 2008 compare with 2006 and 2007. In 2010 over all sales has increased as well as gross profit margin has also increased.
The decline in gross profit margin has happened because of cost of goods sold. It has increased more than 4% in 2010 in compare to 2007. On the other hand sales have increased at the same time operating cost of goods sold increased though grameenphone doing well by maintaining a good gross profit margin over the last few years.
NET PROFIT MARGIN
The net profit margin measures the percentage of each sales remaining after all costs and expenses including interest and taxes deducted. The higher firm’s net profit margins the better substance it shows. The net profit margin is calculated as follows:
Net profit margin = (net income / net sale)
| Net profit margin | INDUSTRY AVERAGE 2010 |
2006 |
2007 |
2008 |
2009 |
2010 |
3% | 16% | 6% | 5% | 23% | 14% |
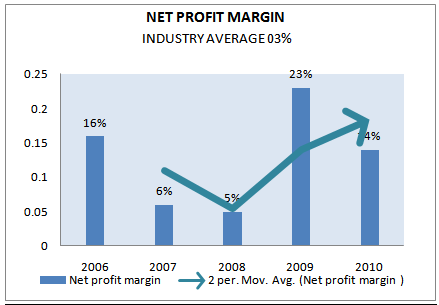
Figure 33: Net profit margin (2006-2010).
In this case also net profit margin has decreased in 2007 and 2008. Earlier we have said that the increasing rate of CGS and operating cost is higher than increasing rate of sales. But we don’t mention about tax and interest. These have also increased significantly. Though account payable has decreased but short-term bank loan has increased. As a result interest has increased and tax has also increased in 2007 and 2008 compare with the year 2009. But after listing in share Market, Company get reduction in tax margin by almost 10%. This is the main reason of increasing in net profit margin over last two years 2009 and 2010.
RETURN ON EQUITY (ROE)
Return on equity is the bottom line measure for the shareholders, measuring the profits earned for each taka invested in the firm’s stock. That means the ratio figures out the net benefit that the stockholders receive from investing their capital in the organization.
Return on Equity = (Net Income / Total Equity)
Return on equity (ROE) | INDUSTRY AVERAGE 2010 |
2006 |
2007 |
2008 |
2009 |
2010 |
35% | 35.0% | 12.1% | 11.1% | 38.50% | 21.00% |
In the last 5 years Grameenphone maintained a very healthy percentage of ROE ratios. In three years it maintained the ROE ratio over 35%, but in 2007 and 2008 it dropped to 12.1% and 11.1% respectively. The industry average ROE and GP’s ROE are almost equal in the year 2009 but once again in 2010 it decrease in comparison to 2009. But by considering the scenario of last 5 years it can be said that GP’s efficiency in utilizing capital is well.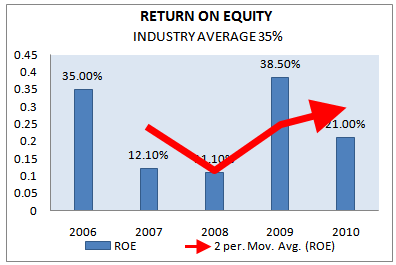
Figure 34: Return on equity (2006-2010)
RETURN ON ASSETS (ROA)
Return on asset is a measure of how effectively the firm’s assets are being used to generate profit. It is an indicator of how profitable a company is relative to its total assets. ROA gives an idea as to how efficient management is at using its assets to generate earnings. Calculated by dividing a company’s annual earnings by its total assets, ROA is displayed as a percentage.
Return on Assets = (Net Income / Total Assets)
Return on assets (ROA) | INDUSTRY AVERAGE 2010 |
2006 |
2007 |
2008 |
2009 |
2010 |
11% | 12.9% | 3.9% | 3.0% | 13.8% | 10.00% |
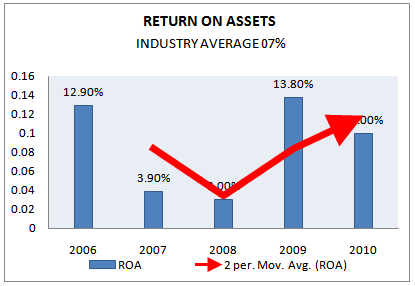
Figure 35: Return on asset (2006-2010)
From the above presented figure, it is founded that GP also maintain a high ROA ratio. And in some years its’ return on asset is very high. But the ratio dropped in 2007 and 2008. The reason of which is like as reason of decrease in ROE. The industry average ROA is 11.29% in 2009 and ROE of GP in 2009 is 13.8%, so this can be said that GP has a high efficiency of utilizing assets but in 2010 it is slightly decrease in comparison to 2009.
DEBT TO EQUITY
This ratio compares the long-term debts with shareholders fund. The relationship between borrowed funds & owners capital is a popular measure of the long term financial solvency of a firm. This relationship is shown by debt equity ratio. Alternatively, this ratio indicates the relative proportion of debt & equity in financing the assets of the firm. The debt ratio measures the proportion of total assets financed by the time’s creditor. The higher the ratio, the greater amount other people’s money being used is an attempt to generate profits. The ratio is calculated as follows:
Debt to equity = Total long term debt / Total shareholders fund
Debt to equity | INDUSTRY AVERAGE 2010 |
2006 |
2007 |
2008 |
2009 |
2010 |
.20 | 0.32 | 0.63 | 0.68 | 0.14 | .11 |
Analysis shows that debt ratio has continuously decreased from 2007 through the total liability has decreased only in the year 2001. The ratio has decreased because total asset had increased at a higher rate than total debt. And it’s a good sign for the company.
In this case creditor will allow them to sell their product to them on credit. The company is following the policy to pay the debt immediately. Thus the way they can save interest expense. And as a result their net income will be high within a short period of time 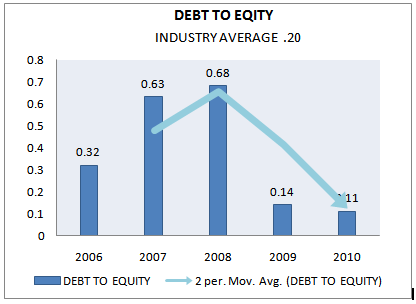
Figure 36: Debt to equity (2006-2010)
From above we can see that Grameenphone is able to maintain a very good average of debt to equity ratio. Grameenphone maintain a good balance of debt with equity provided by the shareholders. This is a positive sign for the shareholders of Grameenphone Limited. Compare to the industry at 2010 its stated lower.
BUSINESS GROWTH RATE ANALYSIS
Business growth rate depend on the amount of resources retained and reinvested in the entity. And the rate of return earn on the reinvested fund. We can calculate the business growth rate from the following formula.
Growth= (percentage of earning return * Return on equity)
Retention rate = 1-( Dividend declare/Operating income tax) | ||||||||||||||||||||||||||||||||||||||||||||
Year | Rotation rate = 1-(dividend declared /operating income after tax) | ||
2010 | -.51=[1-1.51] |
|
|
2009 | .46=[1-.54] |
|
|
2008 | .47=[1-.53] |
|
|
2007 | .51=[1-.49] |
|
|
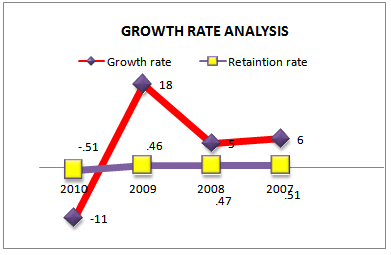
Figure 37:Growth rate analysis (2006-2010).
As we see that in 2007 to 2009 growth rate is positive but in 2010 growth rate is negative due to reduction in earning rather than 2009 as well as payout ratio is increase by 1.51.overall trend is positive for Grameenphone limited.
RISK ANALYSIS OF GRAMEENPHONE
It examines the uncertainty of income flows for the total firm and for the individual sources of capital. (Debt, preferred stocks, common stock) .Total risk is considering under two internal components.
(1) Business risk: Business risk arises from uncertainty of operating income. It can be cause of two factors. Volatility of the firm’s sales over time and its product mix and variable cost of the operating leverage. We can measure the business risk of grameenphone LTD by the following formula.
Business Risk
(2) Financial risk analysis:Due to use fixed financial obligation financial risk arises. Use of debt in the capital structure increase financial risk.When company is trying to give more preference in debt financing fixed interest obligation create risk for the company. We can measure financial risk through debt equity ratio and interest coverage ratio.
Comments: Grameenphone has very low financial risk as well because through the IPO listing in 2009 helps to reduce the debt financing and fixed interest obligation.
EXTERNAL RISK ANALYSIS
(1)Liquidity risk:
Liquidity risk is the risk that the company will not be able to meet its financial obligations as they fall due. The company’s approach to managing liquidity (cash and cash equivalents) is to ensure, as far as possible, that it will always have sufficient liquidity to meet its liabilities when due, under both normal and stressed conditions, without incurring unacceptable losses or risking damage to the company’s reputation. Typically, the company ensures that it has sufficient cash and cash equivalents to meet expected operational expenses, including financial obligations through preparation of the cash flow forecast, prepared based on time line of payment of the financial obligation and accordingly arrange for sufficient liquidity fund to make the expected payment within due date. In extreme stressed conditions, the company may get support from the parent company in the form of short term financing. The carrying amount of financial liabilities represents the maximum exposure to liquidity risk. The maximum exposure to liquidity Risk at 31 December 2010 was:
Carrying amount Maturity period
Taka Months
Payable for operating expenses 121,923,559 six months or less
Payable for capital expenditure 176,839,206 -do-
Other current liabilities 4,533,784 -do-
Total 303,296,549
2)Market risk:
Market risk is the risk that any change in market prices, such as foreign exchange rates and interest rates will affect the company’s income or the value of its holdings of financial instruments. The objective of market risk management is to manage and control market risk exposures within acceptable parameters.
(3)Currency risk:
The company is exposed to currency risk on certain revenues and purchases such as IT service revenue from foreign customers and import of IT equipment, software and software support services. Majority of the company’s foreign currency transactions are denominated in USD and relate to procurement of software and software support service from abroad. As at 31 December 2010, only exposure to currency risk arises from receivable for IT services provided to Telenor Broadcast Holding AS amounting to Tk. 2,297,652. Exchange rate for USD as at 31 December 2010 was Tk 71.40.
(4)Interest rate risk:
The only interest bearing financial instrument for the company is the special notice deposit (SND) account maintained by the company with its banks. Historically, interest rates for such instruments show little fluctuation. Interest rate risk for the company is therefore insignificant.
QUALITATIVE ANALYSIS:
SWOT ANALYSIS OF THE COMPANY
Strengths and weaknesses are the micro environmental factors influencing a business which are within the organization. Opportunities and threats are the macro environmental factors that influence all the firms in the industry. They are present in the whole industry. The following figure shows the strengths and opportunities that Grameenphone Ltd. enjoys as well as the weaknesses and threats that the company faces. This simple analysis helps to find out the major four factors, which are opportunities, threats, strengths and weaknesses of the organization
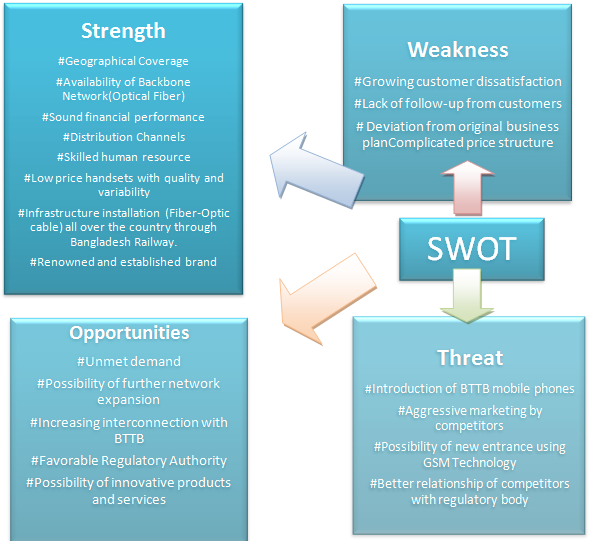
Figure 11: SWOT Analysis of Grameenphone.
FINDINGS
There are some findings regarding the analysis done in the previous chapter can be discussed into two parts, positive and negative. I also include some breakdown which area should give more focus to build the future prospect for the company and .Hopefully this helps to manage shot coming of the current past in an effective manner. The major findings in my analysis are briefly discussed in the following section.
Maintain Good liquidity proportion
The Current ratio and quick indicate high liquidity position of GP considering its size and scale of operation in spite of recent downturn in the net operating cash flow up to 23.16 ( Share /BDT) at 2010 which is less than 24.77 ( Share /BDT) at 2009 . Current ratio of this company is increasing in every year (2006, .44, 2007, .19, 2008, .29, 2009, .57, 2010, .69).At 2009 and 2010 it has increased because in those years’ current assets and other inventory is more increased by introducing new handset BADON and tag SIM card with it.
Consistency in net profit margin
However the decreasing trend in net profit indicates that, the sales of Grameenphone have been decreasing, but the true fact is that gross profit is 38730 million BDT at 2010 but net profit 10705 million BDT .Lower net profit after tax for the year 2010 compared to 2009 was mainly driven by heavy subsidy of BDT 680 crore, partly offset by revenue growth. The 2009 net profit after tax was higher due to a positive adjustment of BDT 412 crore in income tax after successful listing into the stock exchanges. Without this adjustment, the 2009 net profit after tax was BDT 1,085 crore.
Activity ratios
Activity ratios are impressive in case of grameenphone. Over all ratios is good particularly close attention should be given to increase in such areas as inventory turnover, average collection period and fixed asset turnover.
Operating efficiency
The industry average ROE 35% and GP’s ROE 38.50% are almost equal in the year 2009. But by considering the scenario of last 5 years it can be said that GP’s efficiency in utilizing capital is well. This efficiency in utilizing capital to generate income would be a driving force for Grameenphone in the coming years.The industry average ROA is 11.29% in 2010 and ROA of GP in 2010 is 10.00%, so this can be said that GP has not performed high efficiency of utilizing assets to provide revenue. The increase in assets indicates the capabilities of serving large customer base in future. The company has huge established infrastructure and fixed assets, which is also a very good indication for their future operation and prospect.
Balance Debt and Equity Proportion
Grameenphone has able to keep balance in the shareholders equity and liability portion. In the year 2009 the equity portion increases by 82% while the liability portion decreases. At end of the 2010 the company was running with 54% debt and 46% equity.
Lowering CAPEX IN 2010
The company was very much successful in lowering their capital expenditure in 2010. Capital expenditure during 2010 was BDT 846 crore compared to BDT 1,037 crore in 2009.
Increasing trend in assets growth.
The assets of the GP increase throughout the last 5 years at a very satisfactory rate. Total asset base increased marginally by BDT 34 crore between 2009 and 2010 due to higher cash generation from operation and higher inventory build-up of handsets and SIM card in line with higher sales target. However, this increase in assets was partly offset by higher depreciation and amortization expense charged on existing asset base during the year.
Strong revenues growth.
From the financial analysis we can find that Grameenphone has able to maintain an increasing trend in revenue in each and every year. This is a very good sign for the company. The Company committed to making modern mobile telephony and data services available to everyone, both in urban and rural areas, thereby making a positive contribution to the lives of the people of Bangladesh. Grameenphone earned BDT 7,473 crore revenues for the year 2010 with a 14.4% increase from 2009. The growth was mainly from voice as well as interconnection revenues driven by subscription growth and revenues from sales of mobile devices. Data revenue has also contributed to this strong revenue growth for the year 2010 going up by 64.0% from 2009.
Decreasing ARPU.
Due to market competition started back in the past years, Average Revenue Per User (ARPU) decreases over the previous years from BDT 262 in 2008 to BDT 250 in 2009 and at 2010, 231 BDT. This is an alarming sign for Grameenphone as the market competition is increasing day by day. To maintain a good level of ARPU the company should make an effort to increase its subscriber base by introducing more products and services and more value added services.
Leadership position in industry.
Grameenphone has been able to maintain its leadership position in the industry .Typically there is some reason, such as continuing to deliver innovative and relevant products and services to its customers and providing a quality network with the widest coverage. The Company has so far invested BDT 15,796 crore to build the network infrastructures since its operation on March 26, 1997. BDT 846 crore was invested during 2010 alone. Grameenphone has built the largest cellular network in the country, covering 99 percent of the population and over 89 percent of land areas.
Keeping Consistent market share.
The strong customer base of GP (29.97 million in 2010) and its superior service quality is the prime factor for its large revenue scale in spite of decreasing ARPU trend. In the coming years if Grameenphone can maintain its strong subscriber base and market share by introducing more new products and services with more innovative features, the company will be able to sustain its strong revenue growth.
Tax advantage by listing in capital market.
The company has able to save huge amount of earnings before tax (EBT) and net income for the last years. In 2010, being a public limited company the corporate tax rate is reduced, so the earnings before tax will grow higher in the coming year. It will be a greater advantage for Grameenphone Limited over the other mobile phone operators in country. In 2009 the growth rate of Net Profit after Tax is almost 402%. This increase was due to higher revenue and lower operating expenses.
The negative sides of the findings are as follows:–
There were decreases in Earnings after Tax in 2010 Comparison to 2009 and also operating profit decreasing at 2010 then 2009.
The company has been found twice by regulatory authority (BTRC) not to comply with the law. For that Grameenphone was fined twice huge amount of money for not being compliant with the telecommunication authority. This is the reason for the huge increase in non-operating expenses in 2008. The management of Grameenphone should be much more in charge of what is happening in its operation, because now being a public company there is much more risk involved for the shareholders.
Currently company can’t manage to retain the loyal customer. There is a huge completion in the market regarding price and promotion .Other companies likes Airtel, Banglalink, Robi are involving to capture the market. Though GP manage to introduce new customer in the market but this is a cost layer for the company because there is subsidy need to payment for the huge SIM tax in recent years.
Recently the market share of Grameenphone is decreasing. And from the analysis of 35 month subscriber growth data we also see a decreasing trend in the growth rate as well as in the subscriber gain.
Here these Findings on overall financial performance and other key indicated that Grameenphone is a good growing company & if they maintain the current revenue growth and manage the cost of production and relative operating cost then Certainly they will be manage to keep its leading position in the telecommunication industry in Bangladesh in near future.
RECOMMENDATION
The overall performance of Grameenphone shows a satisfactory position although they are facing a huge competition in few years. The liquidity ratios show that they have very impressive ability to meet the outside liabilities from current assets. On the other hand the profitability as well as total assets are in increasing trend. Although they have very low return on asset at the end of the study but it can be said that there is every possibility to get better financial condition and improvements by taking appropriate and accurate actions to protect decreasing tendency in ARPU, Market share growth, Cash flows etc. Whereas due to fall in earning yield, Return on asset, Return on equity, there is every possibility of further fall in market price of share. Appropriate measures should be taken to improve the above ratios. The short coming of grameenphone can be resolve to certain extend by considering following suggestion.
For the operational Excellence and improvement in financial performance:
Grameenphone need to incorporated cost optimization initiatives through operational excellence program to maximize profit. In addition, Grameenphone need to opt for cost-efficient network solutions through swapping of assets with less cost equipment’s .Which might help GP to maximize profit.
Net operating cash flow per share decrease in 2010 (23.16 BDT) 2009,(24.77 BDT),2008 (20.14 BDT), so company need to be more conscious regarding down trend of cash flows it might hamper the liquidity of grameenphone.
Compare to 2009 ROA (13.8%) and ROE (21.9%) is decreasing in comparison to 2010 ROA (9.8%) ROE (21.9%), so company need give more focus on operating efficiency.
Market share of grameenphone is in decreasing trend (2010-43.7%, 2009-44.4%, 2008-47.0%, 2007-48.0%, 2006-50.10%) though it is maintaining a constant growth in every year. So company need to improve in market share by promoting new offers and price cattle.
Operating profit is decreasing in 2010 (20207 million BDT) in comparison to 2009 (20518 million BDT) though it is consistent in last few years .So company need to focus on this issue and should try to find the way how they can minimize operating expenditure.
Net profit after tax is decreasing in 2010 (10705 million BDT) in comparison to 2009 (14968 million BDT) which is happened due increase in subsidy (BDT 455 crore), Commission (BDT 116 crore), SIM card cost of device (BDT 108 crore).So company need to minimize the operating cost of the company which will lead to maximize profit for the company.
Total liability increased by BDT 246 crore during the year due to increase in accounts payable against income tax and SIM card tax. So company needs more attention to minimize liabilities.
They should increase dividend per share that will serve as a promotional toolAs we seen dividend paid in 2009 (12.08 BDT) but it decreasing in 2010 (7.93 BDT).
They have to be more careful about utilization of working capital.
Need to perform Contribution analysis for each of the product lines to optimize profit in light of demand factors.
Regulatory authorities have played a vital role in business environment with new directives and guidelines, such as reduced interconnect prices, guidelines for infrastructure sharing and likewise. So they need to be more compliance with the new directive of BTRC.
Rationality and planning in materials purchases to avoid unnecessary inventory buildup or shortage of materials.
Effects to bring selling prices in line with costs having regard to competition and other market factors.
Improvement of productivity through work-study and training of front line supervisors.
Amidst global recession and intense competition in the market, Grameenphone has had a good year in terms of its financial consolidation. Competitors are engaged into price war and with new entrants coming into the market, there is a possibility of exhilarating competition ahead. So they need to prepare of this competition.
Customer relation and retention development for future prospect:
Company needs to focus on customer retention because they are the hart of grameenphone. So they need to more conscious about customer loyalty program such as star campaign.
People are expecting that such a big company grameenphone will promote a chip price to its customer, and hopefully provide exciting offer to customer.
Strong brand value helps to influence the people. So they need to more contribute for the society by taking initiative of different corporate social responsibility.
Grameenphone need to be continued with its product innovation and offering wide array of services because other contestant is coming with lots of chipset offer,
For the interest of shareholders:
Now grameenphone is a listing company in share market so it need to more focus in the investor interest and other corporate communication.
Close attention should be given to earning of the company.
Upcoming years promises to be full of opportunities to expand GP’s business and ICT expertise to meet new development challenges as well as offer yet even more innovative products and services for its customers.
For the employee benefits
Need to focus on the employee satisfaction.
Arrange and manage different training for the employees for better efficiency.
Conclusion:
In this age of modern civilization telecommunication is playing its splendid role to keep the communication easier for the people through the cellular phone ever than past as well as helps to economic development wheel moving for the country. We can see lot of new telecommunication company has been established in last few years and these companies have made this Telco sector very competitive. The major task for a telecommunication companies are to survive in this competitive environment by managing its huge numbers of subscriber base and revenue growth with an efficient way. Grameenphone has a strong financial base as well huge subscriber base to contend with other company, which make this organization financially sound and solvent. The ranking of this paper are done based on some key ratios, growth rate analysis and the risk index, but there are other factors that are also need to be considered to analysis the companies surveillance, like – long term liabilities, Revenue growth, customer satisfaction and retention ARPU, Debt equity ratio analysis etc. but according to the analysis of key ratio and the risk index it is found that grameenphone is the best telecommunication company among the other company tailed by Robi, Banglalink. Airtel, City cell, Teletalk respectively. However, the finding was such that Grameenphone was ranked the number one position because the other had less performed. When analyzing the key indicator of Grameenphone over its corresponding year, it was found that in many scenarios it had performed better over the period of time. Moreover, their improvement over the period of time in relationship building with the other company was not significant but a good sign occurs in 2010 by signing a network infrastructure sharing among the telecommunication company in Bangladesh which gives a new dimension for the companies to minimize resources as well as proper utilization of the resource . Grameenphone Limited only the profitable company which is enlisted capital market of Bangladesh and declared AAA credit rate which is the highest given by CARB in comparison to the company. Research and Development of product and service is done by a dynamic team under marketing division for keeping the quality of product and ensure continuous improvement which is one of the most confidential tactics of Grameenphone LTD to keep the leadership position in the industry. Here as an employee of commercial division i am allowed to get limited information for my study. I am not allowed to get the information which is too much confidential for the company. So in my report all the information used was meant for the public. It was an honor for me that I have been working as an employee in a reputed organization like grameenphone Limited. The grameenphone is a company that confirms the best service to the customer’s .grameenphone Limited is the fastest growing telecommunication company in Bangladesh. By working in commercial division, the knowledge learnt would be helpful enough to sustain with the different organizational environment for long time.
Bibliography:
Books:
Reilly Brown. investment analysis and portfolio management8 edition,(Tomas south western)2010
Lcpold ,AB ernsteinPhdCpa .Financial statement analysis ,( The McGraw and Hill)2010
Parasanna Chandra, Project Management, Sixth edition (The McGraw and Hill)2009
Lesikar , Flatlet Business Communication, Tenth edition 9 (The McGraw and Hill)2007
Eugene Bringham ,Louis Gapenski , Financial management, Fifth edition(The Dryden Press)2007

Some are parts:
Over View of the Financial Performance of GrameenPhone Ltd (Part 1)
Over View of the Financial Performance of GrameenPhone Ltd (Part 2)