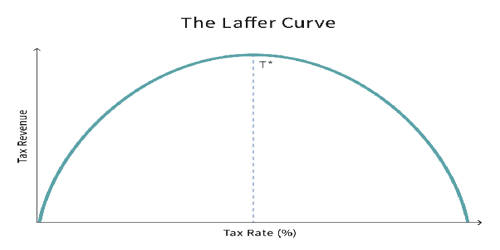
In economics, the Laffer curve illustrates a theoretical relationship between rates of taxation and the resulting levels of the government’s tax revenue. It is based on the economic idea that people will adjust their behavior in the face of the incentives created by income tax rates. The Laffer curve assumes that no tax revenue is raised at the extreme tax rates of 0% and 100% and that there is a tax rate between 0% and 100% that maximizes government tax revenue. It states that if tax rates are increased above a certain level, then tax revenues can actually fall because higher tax rates discourage people from working. The shape of the curve is a function of taxable income elasticity – i.e., taxable income changes in response to changes in the rate of taxation. The curve is used to illustrate Laffer’s argument that sometimes cutting tax rates can increase total tax revenue.
The Laffer curve is typically represented as a graph that starts at 0% tax with zero revenue, rises to a maximum rate of revenue at an intermediate rate of taxation, and then falls again to zero revenue at a 100% tax rate. It describes the relationship between tax rates and total tax revenue, with an optimal tax rate that maximizes total government tax revenue. However, the shape of the curve is uncertain and disputed among economists. Under the assumption that the revenue is a continuous function of the rate of taxation, the maximum illustrated by the Laffer curve is a result of Rolle’s theorem, which is a standard result in calculus. The importance of the theory is that it provides an economic justification for the politically popular policy of cutting tax rates.
The logic underlying the Laffer Curve is that the greater the tax on production, the lesser the amount of production. One implication of the Laffer curve is that reducing or increasing tax rates beyond a certain point is counter-productive for raising further tax revenue. In the United States, conservatives have used the Laffer Curve to argue that lower taxes may increase tax revenue. However, the hypothetical maximum revenue point of the Laffer curve for any given economy cannot be observed directly and can only be estimated – such estimates are often controversial. The New Palgrave Dictionary of Economics reports that estimates of revenue-maximizing tax rates have varied widely, with a mid-range of around 70%. As a broad-brushed economics principle, this is reasonable, but the Laffer Curve itself is bogus. Unfortunately, this bogus curve is being used to justify bad government policy.
The Laffer curve was popularized in the United States with policymakers following an afternoon meeting with Ford Administration officials Dick Cheney and Donald Rumsfeld in 1974, in which Arthur Laffer reportedly sketched the curve on a napkin to illustrate his argument. The term “Laffer curve” was coined by Jude Wanniski, who was also present at the meeting. The basic concept was not new; Laffer himself notes antecedents in the writings of the 14th-century social philosopher Ibn Khaldun and others.


