Financial Performance Evaluation and
Ratio Analysis of Square Toiletries Limited
Square Toiletries Ltd (STL) is one of the largest FMCG Company in Bangladesh. It is promoting more than 20 brands in different section like health and hygiene, oral care, hair care, beauty products, laundry products etc. As a local brand they gain consumer’s trust by their quality products.
This report applies Financial Performance Evaluation of Square Toiletries Limited. It means how well the company performs. The main data is collected from the annual financial reports of the company from 2010 to 2014 which are provided by the employees of the company. Different financial ratios are evaluated such as liquidity ratios, asset management ratios, profitability ratios, debt management ratios and finally measure the best performance of the company. The graphical analysis and comparisons are applied for the measurement of all types of financial ratio analysis. Liquidity ratio is conveying the ability to repay short-term creditors and its total cash. It determines the performance of short term creditor of the company under the three categories such as current ratio, quick ratio and cash ratio. Asset management ratio is measured to know how the company is using and controlling its assets. Profitability ratio and debt coverage ratio are also measured to know overall market position of the company in the current market.
Overview of “SQUARE”
SQUARE today symbolizes a name – a state of mind. But its journey to the growth and prosperity has been no bed of roses. From the inception in 1958, it has today burgeoned into one of the top line conglomerates in Bangladesh. Square Pharmaceuticals Ltd., the flagship company, is holding the strong leadership position in the pharmaceutical industry of Bangladesh since 1985 and is now on its way to becoming a high performance global player.
SQUARE today is more than just an organization, it is an institute. In a career spanning across four and half decades it has pioneered the development of the local business in fields as diverse as Pharmaceuticals, Toiletries, Garments, Textile, Information Technology, Health Products, Food Products, Hospital, etc. With an average Annual turnover of over US$ 200 million and a workforce of about 3500 the SQUARE Group is a true icon of the Bangladesh business sector.
Corporate History:
Square group is not just successful company; it is a symbol of achievement. The journey of the company has been tough but it managed to sail through and have made it to the list of top companies of Bangladesh. Square Pharmaceuticals, which is the flagship company of the conglomerate is the leader among the pharmaceuticals companies in Bangladesh and currently gaining popularity across the globe.
It was a partnership effort of four young and enterprising men whose determination and passion saw it through the turmoil’s of the incipient period. By its four year SQUARE turned into a profit making organization. Today SQUARE Group is becoming a leading local corporate conglomerate in Bangladesh.
Square group has consistently been at the top position since 1958 and has worked hard to achieve all the success which has come its way so far. The company has turned into a public limited company in the year 1991. The total turnover of the company was more than $163 million in the year 2010 with a steady year on year growth of 16.72%.
Corporate History of Square Toiletries Limited:
Square Toiletries Ltd. is one of the largest and leading FMCG (First-moving consumer goods) company in Bangladesh with a turnover of USD 75 million. The company is marketing 20 Brands in different segments like health & hygiene, oral care, hair care, fabric care etc. Major Brands of the company are Jui, Chaka, Senora, Magic, Meril Protective Care & Meril Baby. Square is also exporting its finished products to 13 countries- UAE, Germany, UK, Australia, Malaysia etc.
STL has been built around one core asset, and it is its people. That is what makes working so special here. STL believes that work is more than a place you go every day. It should be a place of exploration, professional growth and creativity. It’s about being inspired and motivated to achieve extraordinary things. STL wants its people to take pride in their work. After all, it’s the combined talents, skills, knowledge, experience and passion of our people that make us who we are.
Currently STL is employing over 2,000 employees ensuring their consistent welfare and security. Due to its sociable working environment and highly motivated employee, STL is enjoying one of the lowest employee turnover rates. STL emphasizes on equal employment opportunity resulting in 38% women employees. Besides, STL also provides employment opportunity to physically challenges persons.
Corporate Governance
Board of Directors
A Quarterly Report on business operation and financial position is presented before the Board of Directors for their information and review, for implementation by the Executive Management. Every month co-ordination meeting is held congregating all the department heads to discuss priority issues and solve problems, if any.
Executive Management:
The Executive Management is headed by the Managing Director, the Chief Executive Officer (CEO) who has been delegated necessary and adequate authority by the Board of Directors. The Executive Management operates through further delegations of authority at every echelon of the line management. The Executive Management is responsible for preparation of segment plans/sub-segment plans for every profit centers with budgetary targets for every item of goods and services and is held accountable for deficiencies with appreciation for exceptional performance. These operations are carried out by the Executive Management through series of team-bound initiatives.
Vision & Mission
Vision
We attempt to understand the unique needs of the consumer and translate that needs into products which satisfies them in the form of quantity products, high level of service an affordable price range in a unique way products which satisfies them in the form of quality products, high level of service an affordable price range in a unique way
Mission
- To treasure consumer understanding as one of our most valued assets and thereby exerting every effort to understand consumers’ dynamic requirements to enable us in offering maximum satisfaction.
- To offer consumer products at affordable price by strictly maintaining uncompromising stance with quality. With continuous R&D and innovation we strive to make our products complying with international quality standards.
- To maintain a congenial working environment to build and develop the core asset of STL – its people. As well as to pursue for high level of employee motivation and satisfaction.
- To sincerely uphold the responsibility towards the government and society with utmost ethical standards as well as make every effort for a social order devoid of malpractices, anti environmental behaviors, unethical and corruptive dealings.
Critical Observations
Square Toiletries Limited only considers an event of expense or an event when sales has occurred that is they follow the accrual-basis accounting which does not consider whether cash payment is done or not. Although they do not have the policy of selling on credit STL sometimes do make sales and purchases on credit. For this reason, they have the terms such as accounts payable and accounts receivable on their balance sheet. If STL does not get all the bills at the end of a specific period, they will have to close their accounts for that particular period as a result getting the accuracy of the pending issues (Accounts Payable and Accounts Receivables) for a particular period sometimes become very difficult for STL. In this stage STL could have gone for cash-basis accounting where the terms such as accounts payable and accounts receivables would not have existed on their balance sheet. An expense would have been recorded only after an expense has occurred. Also, collection of money would have been recorded only after money has been received from the suppliers although this method is no longer used in any of the organizations now days.
STL makes sure that each and every of their suppliers give tax because tax is an income for the government. As a rule of government, on behalf of their suppliers, STL deducts tax on suppliers’ income and deposit it to the government treasury (Sonali Bank, Bangladesh Bank) on the suppliers’ name and will deliver the chalan copy to their suppliers. Here, STL acts as the collecting authority. However, STL can only deduct tax on the suppliers’ income only if they supply a minimum of TK. 200001 raw materials.
Product of STL
- Jui
- Meril Protective Care
- Meril Baby
- Meril Splash
- Revive
- Chaka
- Chamak
- Senora
- Freshgel
- White Plus
- Magic
- Kool
- Xpel
- Spring
- Sepnil
- Zerocal
- Select Plus
- Shakti
- Saaf
- Madina
Statement of the study:
This study is based on the performance evaluation of Square Toiletries Ltd. So I am going to analyze the financial condition according to the following questions:
- How STL is performing according to their liquidity ratios?
- How STL is performing according to their activity ratios?
- How STL is performing according to their profitability ratios?
- Overall, how STL is performing?
Data Analysis:
For preparing my internship report I followed some steps which includes the selection of financial reports, identification of their balance sheet and income statement, ratio analysis, mathematical calculation, graphical analysis and finally comparing their present situation with previous years.
First I selected the annual reports of STL that I needed to do the ratio analysis. The annual reports include all the financial data of the company. I used the annual report of 2010 to 2014 for my analysis.
Secondly, from the balance sheet and the income statement I find out all the information for doing ratio analysis like liquidity ratio, activity ratio, profitability ratio etc.
Thirdly I did all of my calculation in Microsoft excel to find out the results. And also did all the graphs in Microsoft word
At the last, after the analysis of the ratios I evaluate their performance whether they are doing good or not and how much it is financially strong in the market by using my theoretical knowledge that I learn from my financial courses.
Objective:
The main objective of the report is to introduce with the information contained in the financial reports of the company and to give the opportunity to use this information in preparing a report on a target company.
The objective of the study may be viewed as:
- General Objective
- Specific objective
General objective:
The general objective of the study is to evaluate the financial information that is financial performance of STL.
Specific objective:
This study also covers some specific objectives which are:
- To get clear and practical knowledge about STL.
- To highlight the financial ratios in credit analysis and competitive analysis as well as financial capability of the company.
- To identify the problematic areas of the organization.
- To get a practical idea about the organizational environment
- To make recommendation that will help to improve their performance in future
Performance analysis
Financial Performance Analysis
Financial Performance Analysis means the process of reviewing and evaluating a company’s financial statements such as the balance sheet or profit and loss statement, thereby gaining an understanding of the financial health of the company and enabling more effective decision making.
In this part we will evaluate the financial performance of Square Toiletries Ltd by Horizontal Analysis such as trend analysis.
Trend Analysis
Trend analysis is an aspect of technical analysis that tries to predict the future movement of company’s financial condition based on past data. Trend analysis is based on the idea that what has happened in the past which gives an idea of what will happen in the future. Under trend analysis I have calculated Liquidity Ratios, Profitability Ratios, Asset Management Ratios and Debt Ratios.
Liquidity Ratio
Liquidity ratios are the ratios that measure the ability of a company to meet its short term debt obligations. These ratios measure the ability of a company to pay off its short-term liabilities when they fall due. Under liquidity ratios, I will evaluate here the Current Ratio and Quick Ratio.
Current Ratio
An indication of a company’s ability to meet short-term debt obligations, the higher the ratio, the more liquid the company is. Current ratio is calculated by dividing firm’s current asset by current liability.
Current Ratio = Current Asset ÷ Current Liability
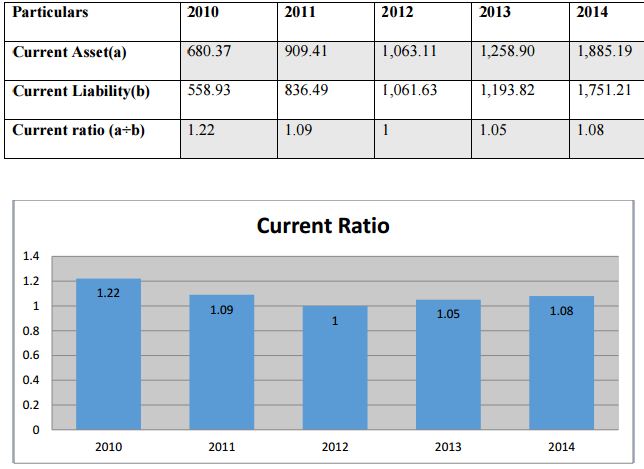
From 2010 current ratio of STL has declined till 2013 and it has increased in the year 2014 at a low rate. It means in the year 2010 the condition of the company was better than in last four years. As the current liabilities of the company was in an increasing rate, STL was not that much capable in paying its obligations in last three years. In year 2014 STL is doing better as it was able to decrease the amount of their current liabilities.
Quick Ratio
The quick ratio measures a company’s ability to meet its short-term obligations with its most liquid assets. Acid Test ratio is calculated by dividing firm’s quick asset by its quick liability.
Quick Ratio = Quick Asset ÷ Quick liability
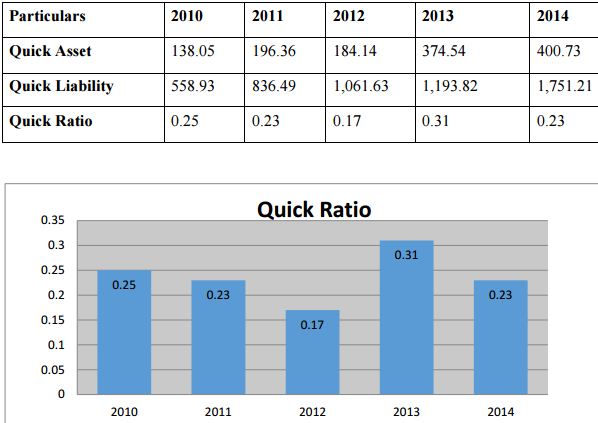
In the year 2010 the quick ratio was better than last four years but it has started to decline. In 2011 and 2014 it was same but in 2012 it has declined at a significant rate which indicates that the liquidity condition of STL was not satisfactory. In the year 2013 the ratio has increased and it was 0.31 times higher than its current liabilities.
Profitability Ratio
Profitability allows us to measure the firm’s ability to earn an adequate return on sales, total asset and equity. Under profitability ratios I will evaluate Gross Profit Margin, Net Profit Margin, Return on Asset and Return on Equity of STL.
Gross Profit Margin
Gross profit margin measures the percentage of gross earnings of the company on its net sales.
Gross Profit Margin = (Gross profit ÷ Net sales) × 100
In last five years the gross profit margin of STL was stable although it is decreasing slightly from 2012. It means STL is paying its operating and other expenses without any problems. Over all we can say that STL has a gross profit of around Tk26 for every Tk 100 sales.
Net Profit Margin
Net profit margin measures the percentage of net earnings after tax of the company on its net sales/net premium.
Net Profit Margin = (Net profit after tax ÷ Net sales) × 100
The net profit margin for STL in last five years was good as it is increasing significantly. That means percentage change in sales of STL was higher than percentage change in net profit of STL. Like in 2014 for every Tk100 of sales STL had a net profit of Tk 6.33.
Return on Equity
Return on Equity measures the percentage of net earnings after tax of the company on its total Equity.
Return on Equity = (Net profit after tax ÷ Total Equity) × 100
In the last five years STL’s common share holders were able to earn a high amount from their investment. But it was fallen in 2010 as the equity portion was higher on that year still they could make a little profit from it.
Return on Asset
Return on Asset measures the percentage of net earnings after tax of the company on its total asset.
Return on Asset = (Net profit after tax ÷ Total Asset) × 100
Total return on assets for STL was increasing from 2010 to 2014 and increase was quite satisfactory. It is a very good sign for the company’s reputation. It is also indicate that there is a huge opportunities for the investor to invest in SYL
Asset Management Ratio
Assets include plant, machinery, computers and even property, all of which are necessary to run your business. The asset turnover ratio indicates how efficiently these assets generate revenue. Under this, I will evaluate total asset turnover, fix assets coverage ratio, net worth to total assets ratio.
Total Asset Turnover
Total asset turnover is measured by dividing the total premium by total asset of the company.
Total Asset Turnover = Total premium ÷ Total asset
From the year 2010 to 2013 total asset turnover ratio has increased which means in these years STL was able to generate more sales according to their total assts. In 2014 it has decreased as total assets were higher in this year but sales were still higher than last years.
Fixed Asset Coverage Ratio
Fixed asset coverage ratio is measured by dividing the total premium by total asset of the company.
Total Asset Turnover = Net sales ÷ Total Premium
From 2010 the fixed asset turnover ratio has declined in last four years. Reason behind this is the inventory has increased but sales have not increased according to this. On this situation STL should produce a bit less than usual as the sales has not increased in that way.
Inventory Turnover Ratio:
Inventory turnover ratio Measures the efficiency of a firm’s inventory management.
Inventory turnover ratio = Cost of goods sold ÷ Inventory
STL’s inventory turnover ratio is good in last four years but in 2014 it has declined as the cost of goods sold has increased in that year. Till 2010 to 2013, on an average STL was able to sold out and restock its inventory by 5 times and in 2014 it was by 3.6 times.
Days Sales Outstanding:
How many days on an average, a company takes to turnover its receivables from their customers are considered as days sales outstanding of that company.
DSO = Accounts receivables ÷ (sales ÷ 365)
In 2013 and 2014 it took a much higher time to recollect the money from their customers for STL which is a bad sign for the company. In 2011 and 2010 DSO had improved than 2009. As accounts receivable decreased and average per day sales increased DSO has also decreased on these years.
Recommendations:
After analyzing last five years data I find out that STL’s financial position is overall satisfactory still they need to go through some changes. From the liquidity ratio I observed that it has declined in 2014 and company has a difficulty of paying its obligations although the current ratio was in increasing rate. As STL has some illiquid current ratio it has increased the liabilities portions. So STL should give more impotents in liquidity as it indicated the true liquidity of the company.
In case of inventory management ratio it was in a decline rate which indicates that STL is facing poor sales and lower cost of goods sold. It is happening may be because of not utilizing their main power for production process. Therefore proper utilization of man power as well as raw materials is required for STL in order to increase the sales rate and inventory turnover ratio.
I also observed that STL is facing cash shortage problem as their accounts payback period is higher and it took much time to pay back to its creditors. Beside that STL’s total assets turnover ratio is also fluctuation in last few year. It might happened because of they could not manage their assets in last few years and sales has declined. So STL needs to focus on their assets management properly so that they can keep their reputation among their suppliers and increase their selling rate.
However, financial ratio analysis always does not give the proper indication about the company’s performance. So one stakeholder cannot always predict or make a comment about future performance of the company from these ratios. The quality of products and experience of the management team can change the success story of a company. Therefore financial ratios do not indicate the real face of management quality of the company.
Conclusion
After analyzing the last five years financial data of Square Toiletries Ltd. I came to the conclusion that STL is one of the leading manufacturing company of Bangladesh with a variety of product which have a export quality and it is a self solvent company with a strong position in the manufacturing sector. Almost all of the ratios of STL’s show that they are solvent enough and they have the efficiency. However there liquidity ratio and turnover ratios needed to be improved as early as possible so that the company can reduce their liabilities. In the last I would like to add that STL’s financial management practice needed to be improved and they need to take some effective solution so that STL can hold their reputation as a business icon in the manufacturing sector.