Adjusted R-squared (R2) is a modified version of R-squared (R2) with the number of predictors in the model adjusted. To put it another way, the adjusted R-squared indicates whether or not adding more variables improves a regression model. An grasp of R-squared is necessary to comprehend adjusted R-squared. When the additional term improves the model more than would be anticipated by chance, the adjusted R-squared rises. When a predictor improves the model by less than predicted, it drops.
A lower adjusted R-squared shows that the additional input variables are not adding value to the model when compared to a model with fewer input variables. The corrected R-squared is usually positive, not negative. It is never greater than R-squared. The adjusted R2 can be negative, with a value that is always less than or equal to R2. Unlike R2, adjusted R2 only rises when the increase in R2 (due to the addition of a new explanatory variable) is greater than one would anticipate by chance. R2, also known as the coefficient of determination, is a measure of how well input variables (predictor variables) account for variance in output variables (predicted variables).
It has a range of 0 to 1. If the R-squared is 0.9, for example, it means that the input variables account for 90% of the variation in the output variables. If a set of explanatory variables with a predetermined hierarchy of importance are introduced into a regression one at a time, with the adjusted R2 computed each time, the regression with the ideal combination of having the best fit without excess/unnecessary terms would be the one at which adjusted R2 reaches a maximum and then decreases.
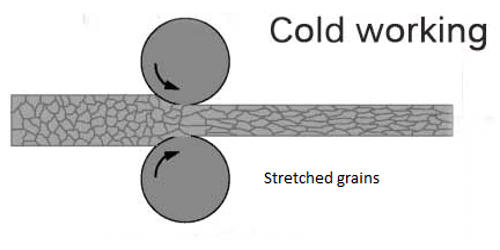
When you add additional independent variables or predictors to a regression model, the R-squared value rises, tempting the model’s creators to add even more variables. This is referred to as over-fitting, and it might result in an unjustifiedly high R-squared score. A higher R-squared implies a better fit for the model in general. Consider the following diagram:
The blue line depicts the relationship between variables and is known as the line of best fit. The line is displayed where the vertical distances (blue dotted lines) of the yellow dots to the line of best fit are reduced using regression analysis. The plot of input and output variables is shown by the yellow dots. The x-axis represents the input variable, while the y-axis represents the output variable.
The gap between the plot of input and output variables and the line of best fit is indicated by the blue dotted lines. The R-squared is calculated by subtracting the distance between all of the yellow dots and the line of best fit (the blue line). Adjusted R-squared is used to assess the reliability of a correlation and how much it is influenced by the inclusion of independent variables.
Adjusted R-squared will assist identify how much of the correlation with the index is attributable to the addition of those factors in a portfolio model with additional independent variables. When comparing alternative models in the feature selection stage of model building, adjusted R2 is more appropriate for evaluating model fit (the variance in the dependent variable accounted for by the independent variables) and evaluating model fit (the variance in the dependent variable accounted for by the independent variables). Additional input factors will cause the R-squared to stay the same or grow, which is an inherent issue with R-squared (this is due to how the R-squared is calculated mathematically).
As a result, the R-squared will grow even if the extra input variables have no connection with the output variables. The adjusted R-squared accounts for the inclusion of variables and only rises if the new predictor improves the model above what might be predicted by chance. When a predictor improves the model less than what is anticipated by chance, it will drop. In other words, the adjusted R-squared examines if new input factors are influencing the model.
Adjusted R2 is not an unbiased estimator of the population R2, which arises from utilizing the population variances of the errors and the dependent variable instead of estimating them while employing unbiased estimators for the population variances of the error and the dependent variable. It examines if the model is aided by extra input variables. As a result, the modified R-squared might determine that the temperature input variable is ineffective in describing the output variable.
Information Sources: