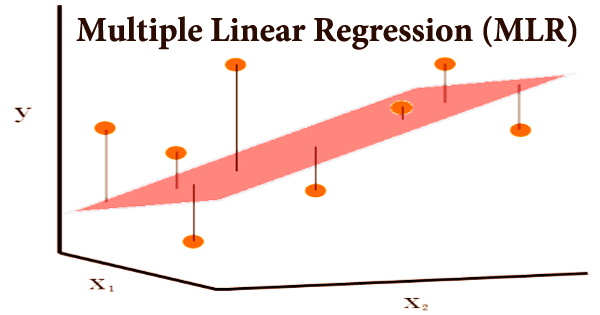
Multiple linear regression (MLR), often known as multiple regression, is a statistical approach for predicting a variable’s outcome based on the values of two or more variables. It’s a particular instance of general linear models with only one dependent variable, and it’s an extension of basic linear regression with more than one independent variable. Because it contains more than one explanatory variable, multiple regression is essentially an extension of ordinary least-squares (OLS) regression.
MLR is widely utilized in econometrics and financial analysis. Each value of the independent variable x has a corresponding value of the dependent variable y. For p explanatory variables x1, x2,…, xp, the population regression line is defined as µy = β0 + β1x1 + β2x2 + … + βpxp. This line shows how the explanatory factors affect the mean response µy. The observed values for µy fluctuate around their means y, and the standard deviation σ is assumed to be the same. The dependent variable is the one we wish to predict, whereas the independent or explanatory variables are the ones we use to forecast the value of the dependent variable.
Almost all real-world regression models include many predictors, and fundamental definitions of linear regression are frequently expressed as a multiple regression model. Analysts can use this method to determine the model’s variation and the proportional contribution of each independent variable to the total variance. There are two types of multiple regression: linear and non-linear regression.
Multiple Linear Regression Formula –
yi = β0 + β1xi1 + β2xi2 +…+ βpxip + ϵ
Where:
- yi is the dependent or predicted variable
- β0 is the y-intercept, i.e., the value of y when both xi and x2 are 0.
- β1 and β2 are the regression coefficients representing the change in y relative to a one-unit change in xi1 and xi2, respectively.
- βp is the slope coefficient for each independent variable
- ϵ is the model’s random error (residual) term.
Simple linear regression is a function that allows a statistician or analyst to generate predictions about one variable based on data about another variable. Linear regression aims to create a straight-line relationship between the two variables. A kind of regression in which the dependent variable has a linear connection with two or more independent variables is known as multiple regression.
Non-linearity occurs when the dependent and independent variables do not follow a straight line. The parameter that is utilized to compute the dependent variable or result is known as the independent variable. Multiple explanatory variables are included in a multiple regression model. Both linear and non-linear regression use two or more variables to visually monitor a specific response. Non-linear regression, on the other hand, is notoriously difficult to implement since it is based on assumptions developed via trial and error.
The coefficient of determination (R-squared) is a statistical tool for determining how much variation in the independent variables can be explained by variance in the result. Even if the predictors are unrelated to the outcome variable, R2 always rises when additional predictors are added to the MLR model. For parameter estimation and inference in linear regression, a wide variety of techniques have been developed.
The computational simplicity of the algorithms, the presence of a closed-form solution, robustness to heavy-tailed distributions, and the theoretical assumptions required to validate desirable statistical properties such as consistency and asymptotic efficiency are all differences between these methods. Multiple linear regression is based on the following assumptions:
- A linear relationship between the dependent and independent variables: The basic assumption of multiple linear regression is that the dependent variable and each of the independent variables have a linear relationship. Making scatterplots and visually inspecting them for linearity is the best approach to verify for linear connections. If the scatterplot shows a non-linear relationship, the analyst must do a non-linear regression or convert the data using statistical software such as SPSS.
- The independent variables are not highly correlated with each other: The data should not show multicollinearity, which occurs when the independent variables (explanatory variables) are highly correlated. When independent variables show multicollinearity, there will be problems figuring out the specific variable that contributes to the variance in the dependent variable. The best method to test for the assumption is the Variance Inflation Factor method.
- The variance of the residuals is constant: The basic assumption of multiple linear regression is that the dependent variable and each of the independent variables have a linear relationship. Making scatterplots and visually inspecting them for linearity is the best approach to verify for linear connections. If the scatterplot shows a non-linear relationship, the analyst must do a non-linear regression or convert the data using statistical software such as SPSS.
- Independence of observation: The model implies that the data are unrelated to each other. Simply expressed, the model implies that the residual values are unrelated. The Durbin Watson statistic is used to test for this assumption. The test will provide results ranging from 0 to 4, with a value of 0 to 2 indicating positive autocorrelation and 2 to 4 indicating negative autocorrelation. There is no autocorrelation at the midpoint, which is a value of 2.
- Multivariate normality: When residuals are regularly distributed, multivariate normality arises. Examine the distribution of residual values to see if this assumption is correct. A histogram with a superimposed normal curve or the Normal Probability Plot technique can also be used to test it.
A multiple regression examines the impact of several explanatory variables on a certain result. When all other factors in the model are held constant, it evaluates the relative influence of these explanatory, or independent, variables on the dependent variable. Only one variable seldom explains a dependent variable. In such circumstances, an analyst will utilize multiple regression, which tries to explain a dependent variable with the help of numerous independent variables.
Information Sources: