Shearography is an optical measurement technique used for non-destructive testing (NDT) and evaluation of structural integrity. It is particularly useful for detecting defects or anomalies in materials and structures.
Shearography obtains object deformation information by obtaining the phase in a manner similar to the conventional optical interference technique. Since the measured object is frequently dynamic in practical applications, the spatial carrier method which can extract the phase information from a single speckle pattern becomes a crucial phase extraction method for the practicalization of shearography.
However, the spatial carrier approach frequently experiences spectrum overlapping as a result of the link between shearing amount and spatial carrier frequency, which has a significant impact on the extracted phase’s quality.
Recently, Prof. Yonghong Wang and his team from Hefei University of Technology, published a research paper in Light: Advanced Manufacturing, entitled “A robust phase extraction method for overcoming spectrum overlapping in shearography.”
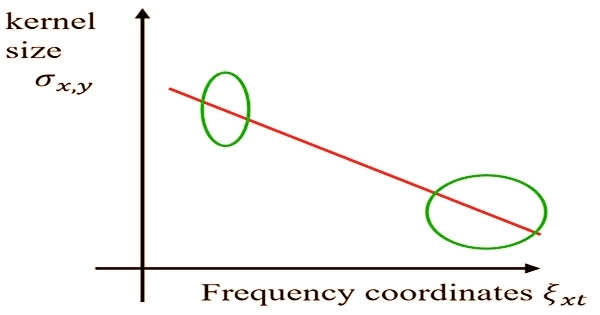
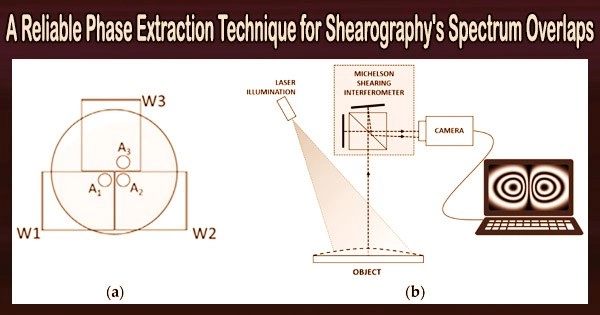
Figure 1
The paper reviews the causes of spectrum overlapping in spatial carrier shearography and proposes a phase extraction method based on an improved windowed Fourier ridge algorithm to achieve high quality phase extraction in spectrum overlapping. To confirm the efficacy of the suggested strategy for various instances, simulations and real-world experiments are carried out.
Spectrum overlapping affects spatial carrier shearography frequently in applications like big deformation or large aera detection. The practical application of shearography will benefit if the phase extraction method can extract a high quality phase in the case of spectrum overlapping.
The windowed Fourier ridge (WFR) is a phase extraction method proposed by Prof. Qian KeMao of NTU mainly for phase extraction of project fringes. However, the constancy of the background light, object light, and conjugate object light spectrum sizes in shearography results in the most problematic spectrum overlapping, which also raises the bar for the parameterization of the WFR method.
The proposed method reduces the running time by analyzing the speckle pattern spectrum using the Hough transform, obtaining the coordinates of the object spectrum’s center point and radius, and roughly determining the window Fourier ridge’s frequency band through the correspondence between the frequency domain coordinates and the spatial coordinates of the camera sensors. Modern optical systems frequently employ circular aperture diaphragms.
Additionally, using a large window for WFR will result in increased speckle size when the spectrum is mixed for the object light spectrum’s regional characteristics, while using a small window will mix zero-order information.
Accordingly, this paper proposes the use of a linearly transformed elliptical window for WFR. As seen in Figure 1, an elliptical window with the long axis parallel to the y-axis direction is used close to zero-frequency and changes linearly to an elliptical window with the long axis parallel to the x-axis direction with a right shift of the frequency scan interval. This maximizes the use of spectrum information and enhances phase extraction quality.
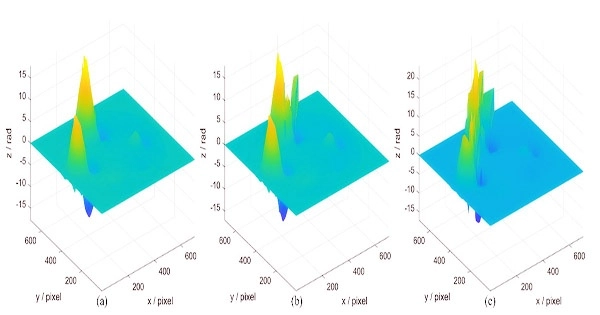
Figure 2. (a) Unwrapped phase map of the method described in this paper, (b) unwrapped phase map of the nonlinear filter, and (c) unwrapped phase map of the binary mask filter.
The researchers used simulation and experiment to obtain the speckle patterns in various scenarios of spectrum overlap, and they also contrasted two other phase extraction techniques.
Taking the measured object as a non-destructive testing standard as an example, Figure 2 shows the real phase of the phase map obtained by the three phase extraction methods after filtering and unwrapping.
Figure 2 shows that the unwrapped phase produced by the suggested approach is extremely smooth, in contrast to the unwrapped phase anomaly produced by the other two ways, which confirms the effectiveness of the proposed method.