In descriptive statistics, the standard deviation is the degree of dispersion or scatter of data points compared to the mean. The standard deviation can assist investors to evaluate how risky an investment is and estimate their minimum necessary return on investment from a financial standpoint. It is determined as the square root of variance by calculating the departure of each data point from the mean. There is a larger variance within the data set if the data points are farther from the mean; hence, the more spread out the data, the higher the standard deviation.
A low standard deviation implies that the values are close to the set’s mean (also known as the anticipated value), whereas a high standard deviation shows that the values are spread out over a larger range. It describes how the values are distributed over the data sample and is a measure of the data points’ deviation from the mean. The square root of the variance is the standard deviation of a sample, statistical population, random variable, data collection, or probability distribution. A volatile stock has a high standard deviation, whereas a steady blue-chip stock has a low standard deviation.
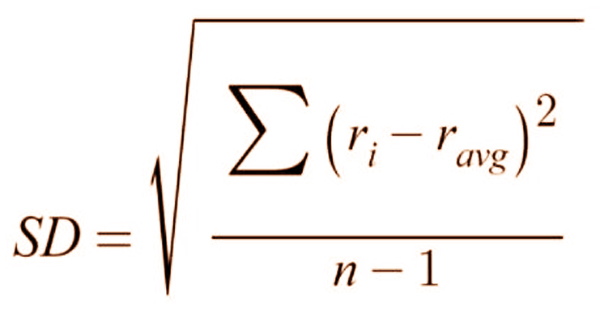
The lower case Greek letter σ, for the population standard deviation, or the Latin letter s, for the sample standard deviation, is most often represented in mathematical literature and equations by the lower case Greek letter sigma σ. On the downside, the standard deviation treats all uncertainty as a risk, even when the investor benefits from it, such as above-average profits. The standard deviation of a collection of data may be calculated using the formula below:

Where:
ri – the return observed in one period (one observation in the data set)
ravg – the arithmetic mean of the returns observed
n – the number of observations in the dataset
Standard deviation is a financial statistical indicator that, when applied to an investment’s yearly rate of return, reveals the investment’s historical volatility. We can also calculate Variance, which is the square of the standard deviation, using the method above. The variance equation is the same as the one before, with the exception that we don’t take the square root. The higher the difference between each price and the mean, the broader the price range.
The square root of the variance is the standard deviation of a random variable, sample, statistical population, data collection, or probability distribution. The sum of squares of departures from the mean, on the other hand, does not appear to be a good measure of dispersion. If the squared differences from the mean have a modest average. The following formula is used to determine the standard deviation:
- By combining all of the data points and dividing by the number of data points, the mean value is determined.
- Each data point’s variance is determined by subtracting the mean from the data point’s value. After that, each of the resultant values is squared, and the results are added together. The result is then divided by one less than the number of data points.
- The square root of the variance result from no. 2 is then used to find the standard deviation.
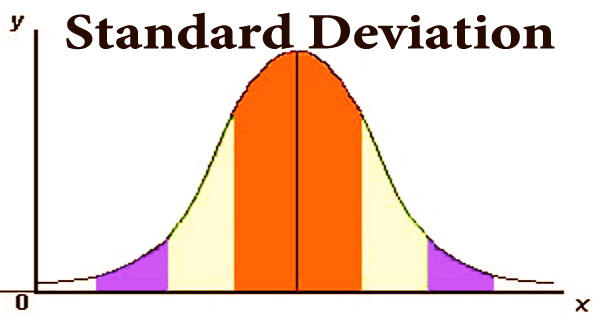
The standard deviation has the advantage of being stated in the same unit as the data, unlike the variance. According to the normal distribution hypothesis, an investment’s long-term returns will lie somewhere along an inverted bell-shaped curve. A standard deviation is a helpful tool in investing and trading techniques since it helps anticipate performance patterns by measuring market and securities volatility.
An index fund, for example, is likely to have a low standard deviation when compared to its benchmark index because the fund’s aim is to mimic the index. As a result, standard deviations are a highly valuable tool for determining the riskiness of an investment. Investors may adapt their investments to their particular risk attitude by actively monitoring and adjusting the standard deviations of their portfolios. Standard deviation estimates fluctuate depending on the data.
The departure of data from its mean or average location is measured by distribution. If the frequency distribution is continuous, the midpoint of each class is used to replace it. The standard deviation is then computed using the same method as for the discrete frequency distribution. More aggressive investors may be comfortable with a strategy that favors higher-than-average volatility vehicles, but more conservative investors may not. The standard deviation can be used to quantify uncertainty.
While the standard deviation does indicate how much average values deviate from the mean, there are additional metrics to consider. Analysts, portfolio managers, and advisers view it as one of the most important basic risk gauges. The standard deviation of mutual funds and other products is reported by investment businesses. Understanding the standard deviation of a collection of numbers has practical applications in determining how much variance there is from the average (mean).
Information Sources:


