Spectrogram
Definition
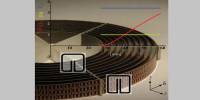
Spectrogram is a visual representation of the Short-Time Fourier Transform. Spectrograms are sometimes called spectral waterfalls, voiceprints, or voicegrams. Spectrograms are commonly used to display frequencies of sound waves produced by humans, machinery, animals, whales, jets, etc., as recorded by microphones. In the seismic world, spectrograms are increasingly being used to look at frequency content of continuous signals recorded by individual or groups of seismometers to help distinguish and characterize different types of earthquakes or other vibrations in the earth.
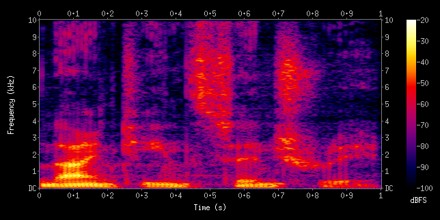
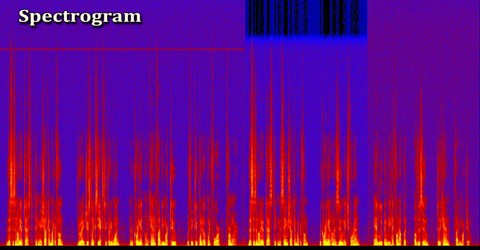
The spectrogram is a 2D visual heat map where the horizontal axis represents the time of the signal and the vertical axis represents the frequency axis. What is visualized is an image where darker colours means that for a particular time point and a particular frequency, the lower in magnitude the frequency component is, the darker the colour. Similarly, the higher in magnitude the frequency component is, the lighter the colour.
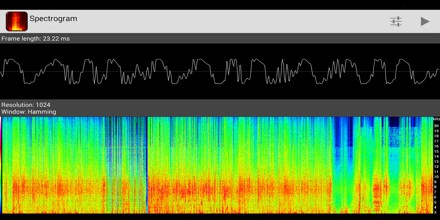
Sometimes the amplitude is represented as the height of a 3D surface instead of color or intensity. The frequency and amplitude axes can be either linear or logarithmic, depending on what the graph is being used for. Audio would usually be represented with a logarithmic amplitude axis, and frequency would be linear to emphasize harmonic relationships, or logarithmic to emphasize musical, tonal relationships.
Applications of Spectrogram
Spectrograms are basically two-dimensional graphs, with a third dimension represented by colors. These are usually created in one of two ways: approximated as a filterbank that results from a series of band-pass filters, which was the only way before the advent of modern digital signal processing, or calculated from the time signal using the Fourier transform.
Spectrograms are useful in assisting in overcoming speech defects and in speech training for the portion of the population that is profoundly deaf. The studies of phonetics and speech synthesis are often facilitated through the use of spectrograms.
By reversing the process of producing a spectrogram, it is possible to create a signal whose spectrogram is an arbitrary image. This technique can be used to hide a picture in a piece of audio and has been employed by several electronic music artists.
Some modern music is created using spectrograms as an intermediate medium; changing the intensity of different frequencies over time, or even creating new ones, by drawing them and then inverse transforming. See Audio timescale-pitch modification and Phase vocoder. It can be used to analyze the results of passing a test signal through a signal processor such as a filter in order to check its performance.