INTRODUCTION
Interaction and interpersonal relationship is the root of the pharmaceutical marketing. A pharmaceutical company can not go without interaction and interpersonal relationship. The success and failure fully depend on the interaction and interpersonal relation among doctors, chemists and pharmaceutical companies. A pharmaceutical company may loose its share from the market due to lack of interaction and interpersonal relation among doctors, chemists and pharmaceutical companies. On the contrary the pharmaceutical company may increase its share by improving the interaction and interpersonal relation among doctors, chemists and pharmaceutical companies.
The Problem Statement: Interaction and interpersonal relationship of pharmaceutical representatives with the physicians and chemists-A perspective of Orion Laboratories Ltd.
Board objectives:
The Board objective of this research is to find out the preference of the customers (doctors and chemists) in accordance with their importance. Through this research, I tried to figure out the expectation of the concerning doctors and chemists from the pharmaceutical.
The specific objectives are as following:
The representatives are cordial or not to the doctors.
The representatives are conscious or not about the doctors’ liking.
The representatives are deal or not with the doctor’s personal necessities.
The representative keeps up relation or not with the doctors out side their profession.
The representatives’ takes more time or not at during visit the doctor.
The confidence of Representative at during detailing with the doctors is very high or not.
They are very conscious or not about delivering the message to the doctors.
The product knowledge of Orion’s Representatives is very depth or not.
Self-confidence to get prescription is whether strong or not from the doctors.
The Chemists are satisfied or not at visit frequency of Orion’s Representative.
The communication between representative and the chemists are good or bed.
The Representatives enter or not the chemists shop at the time of taking order.
Chemists’ gifts are offered very genially by Orion’s Representative.
The representatives are serious or not to return the damage products.
They continue their Commitment very seriously.
The Representative takes order seriously or not in alphabetic order from the chemists.
The Representative checks or not termination of products very often.
They survey or not the prescriptions very frequently form the chemists shop.
They are forceful or not to peruse the OTC products.
Scope of Research:
The analysis of this report has not been done on based in simple statistical calculation.
Since the project of requires data in the research of a particular interaction and interpersonal relationship, the target population had to be the doctors and chemists. The data had been collected from the doctors and chemists working at the hospitals and chemists shops are mentioned below:
ShaheedSuhrawardyHospital, Sher-E Bangla Nagor
DhakaEyeHospital, Mirpur, Dhaka
Busra Clinic, Mirpur
GalaxyHospital, Mirpur-10 Dhaka
Mirpur area for the chemists
Kallayanpur area for the chemists
College gate area for the chemists
Scope and limitation:
In this project we studied the Market study on interaction and interpersonal relationship of pharmaceutical representatives with the physicians and chemists. We have done this study within a short period of time and within limited budget. There had some other limitations regarding data availability and accessibility.
There may have been some biasness among the respondents.
Rationale:
This study will be helpful for the following groups:
The organization will be able to improve the relationship between the doctors and chemist with representative.
The existing companies in this industry
Research design or methodology:
The research methodologies along with the some specifications are given below:
Type of research Descriptive
Sources of data Primary, Secondary and internal
Method of collecting data Questionnaire
Typed of questions asked Closed ended
Average interview time per respondent 10 minutes
Method of administering questionnaire Personal interview
Scaling techniques used Likert Scale
Target population Doctors and Chemists
Sample size (50+50)
Time taken to complete the research 15 days
Sampling techniques used Probability Sampling Method
PHARMACEUTICAL INDUSTRY: AN OVERVIEW
The pharmaceutical company as a sector has been performed relatively well in Bangladesh. It has knowledgeable 11.50 % growth during the year 2008 and is now recognized to have great export potential. This is a highly competitive industry with more than 240 companies and 4,400 products. Though number of products seems to be higher but all of them fall into 425 categories.
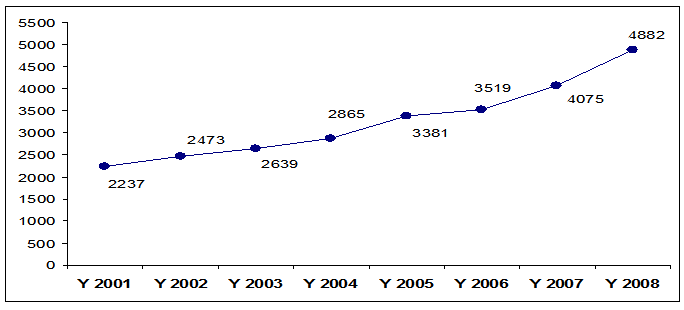
The total market size of Domestic pharmaceutical market was BDT 4882 Cr in 2008. There is a steady growth of domestic market since 1981.
Figure 2.1: Sales trend of Domestic pharmaceutical market (2001-2008)
The industry has thus become a leading growth sector, with some prominent manufacturers operating under ISO certification and producing the finest medicines by internationally accepted standard. Out of some 240 pharmaceuticals, as many as 30 big ones have most sophisticated production plants with a capacity to meet international standard like the United States Food and Drug Administration (USFDA). Among 49 LDCs, Bangladesh has most advanced industries in this sector.
Pharmaceutical market is dominating by top 20 companies with a contribution of as high as 80%. Most notable aspect about Bangladesh pharmaceutical industry is the strong presence of national companies. Incepta, a new local company established in 1999, has shown its remarkable presence in the market and grasped third position among all within eight year beating three multinationals.
Table 2.1.2: Pharmaceutical market of Bangladesh
| Sl | Company | Yearly sale (in Cr) | Share % | Growth % |
| Total | 4882 | 100.00 | 11.50 | |
| 1 | Square | 979 | 20.06 | 17.13 |
| 2 | Incepta Pharma | 376 | 7.69 | 18.16 |
| 3 | Beximco | 362 | 7.41 | 11.72 |
| 4 | Acme | 252 | 5.15 | 4.37 |
| 5 | ACI | 229 | 4.68 | 27.64 |
| 6 | Eskayef | 219 | 4.49 | 7.15 |
| 7 | Opsonin Pharma | 214 | 4.38 | 27.43 |
| 8 | Renata | 208 | 4.27 | 28.33 |
| 9 | Aristopharma | 207 | 4.25 | 16.88 |
| 10 | Drug International | 164 | 3.36 | -8.49 |
| 11 | Sanofi Aventis | 152 | 3.12 | -2.90 |
| 12 | Glaxosmithkline | 119 | 2.44 | 5.62 |
| 13 | Orion Lab. | 88 | 1.80 | -5.92 |
| 14 | Sandoz | 87 | 1.78 | 10.36 |
| 15 | General | 86 | 1.75 | 8.48 |
| 16 | Healthcare Pharma | 82 | 1.69 | 14.20 |
| 17 | Ibn Sina | 72 | 1.48 | 17.16 |
| 18 | Novo Nordisk | 60 | 1.23 | 61.74 |
| 19 | Nuvista Pharma | 55 | 1.13 | 3.79 |
| 20 | Novartis | 49 | 1.00 | 11.01 |
One of the major positive impacts of Drug (Control) Ordinance is the rapid development of local manufacturing capabilities. Almost all types of possible dosage forms include tablets, capsules, oral and external liquids (solutions, suspensions, emulsions1), ointments, creams, injections (small volume ampoules/dryfill vials/suspensions and large volume IV fluids), and aerosol inhalers are now produced in the country. In recent years, the country has achieved self-sufficiency in large volume parenterals, some quantities of which are also exported to other countries.
PHARMACEUTICAL EXPORT SCENARIO:
Bangladesh has been trying to fulfill the national aspiration of turning its pharmaceutical industry into an exporter of quality medicines. In mid 90’s a few companies took initiatives to export pharmaceuticals from Bangladesh. Today, Bangladesh is exporting its pharmaceuticals from Bangladesh. Today, Bangladesh is exporting its pharmaceuticals to various countries like Singapore, Russia, Ukraine, Georgia, Pakistan, Myanmar, Vietnam, Sri Lanka, Nepal, Kenya, Germany, Yemen, Malaysia, Iran, Philippines, Sudan, South Korea, Bhutan and Hong Kong. It is worth mentioning that the world renowned hospitals & institutions like, KK Women & Children Hospital and Raffles Hospital of Singapore, MEDS of Kenya and Zinnah Hospital of Pakistan have been using the pharmaceutical products of Bangladesh. Apart from exporting tablet, capsule, syrup, suspension, ointment etc., it also exports ‘High Tech and Specialized products’ like Metered Dose Inhalers (MDIs), Nasal Sprays, Suppositories, Large Volume Potentials (LVP) and small Volume Potentials (SVP).
Bangladesh has the potential to export more than Tk 10,000 crore worth of drugs a year, according to Bangladesh Association of Pharmaceutical Industry (BAPI).
The pharmaceutical sector in Bangladesh, one of the fastest growing sectors of the economy, is poised to transform the country into a global hub of quality medicines.
The $700 million sector with more than 230 manufacturers is continuously expanding with new products to new international destinations.
The export value of pharmaceuticals is small but growing at 50 percent per year. Exports increased from $8.2 million in 2004 to $28.3 million in 2007, while export destinations climbed from 37 countries to 72 during the period.
Mn. US$ Export Performance for 2007-08 : 43.00
Export performance for July-January, 2007-08 : 26.45
Export target for 2008-09 : 53.75
Strategic export target for July-January, 2008-09 : 30.25
Export performance for July-January, 2008-09 : 21.56
Ref: http://www.epb.gov.bd
The industry’s inception dates back to the 1950s when a few multinationals and local entrepreneurs started with manufacturing facilities in the then East Pakistan. By 1982, many top ranking multinationals established their manufacturing facilities in this part of the world. Prominent among them were Pfizer (NYSE:PFE), Glaxo, Fisons, Squibb, Hoechst, ICI, May & Baker and Organon. Pharmaceutical industries in Bangladesh are gifted with unparalleled potential to grow in the days ahead as they enjoy a number of competitive advantages.
The industry’s ability to comply with guidelines of quality assurance has put it on a solid base. Almost all companies are equipped with World Health Organization (WHO) Good Manufacturing Practice (GMP) standards.
Bangladesh’s ability to face competition from developing countries like India, China, Brazil and Turkey in its export markets is due to Bangladesh pharmaceutical’s strict quality compliance. The most important indicator is the capability of the industry to achieve excellence and go beyond general international standards. The government of Bangladesh emphasizes on its national drug policy that all the pharmaceutical manufacturers must strictly comply with thee standards. The Current Good Manufacturing Practice (cGMP) is a term recognized worldwide as a holistic approach for the control and management of manufacturing and quality control testing of food and pharmaceutical products.
Bangladeshi pharmaceutical industries are expanding exportable items quite fast. Bangladesh is now exporting wide range of pharmaceutical products covering all major therapeutic classes and dosage forms like tablets, capsules and syrups. Bangladesh is also exporting high-tech specialized products like, HFA, inhalers, suppositories, hormones, steroids, oncology, immunosuppressant products, nasal sprays, injectibles and IV infusions. Increased affordability and availability of medicines have contributed to this achievement. Growth in local demand will naturally follow increases in per capita income. Per capita consumption of medicines is one of the lowest in South Asia.
The industry welcomed over 50 new factories in the last three years, of which about two dozen started marketing with an aggressive sales and promotion strategy during 2008. Out of 230 companies, 200 have their own manufacturing facilities of which five are multinationals.
The sector is active in API (active pharmaceutical ingredients). Twenty-one different companies now locally manufacture 41 API’s. However, compared to huge local demand, more API industries need to be set up. Pharmaceutical industries’ potential has multiplied with the recently approved API industrial park in Munshigonj at a cost of $30 billion. The APIPark will inject fresh momentum into the pharmaceutical industry. The country can save at least 70 percent of the amount and the park is expected to transform the industry as a major export earner with the potential to export products worth $750 million per year within the next five years.
A good number of skilled professionals from home and abroad are joining the industry’s human resources pool every year.
Bangladesh can continue with the patented products up to 2015 as per trade related intellectual property rights (TRIPS). Pharmaceutical industries are now legally allowed to reverse engineer, manufacture and sell generic versions of on-patent pharmaceutical products for domestic consumption as well as for export to other LDCs. This has created a big opportunity to make Bangladesh as a new chemical entity. With about 45 years of experience in pharmaceutical formulation and marketing Bangladesh is in a position to share those with both LDCs and developing countries where needed. It is estimated that over $250 million have been invested in this sector over the last couple years in terms of facility modernization as well as new facilities.
Needless to mention that all of these investments were directed towards developing full cGMP compliant facilities, which can meet stringent regulatory requirement of any country of the world. Such investment has already started paying off as most of these companies have either already received certification or are on the verge of getting approval from world toughest regulatory bodies like U.S. FDA, U.K. MHRA, TGA Australia and European Union.
This has opened up wider range of opportunities for the industry whereby these Bangladeshi companies can now export pharmaceutical products to any part of the globe capitalizing on the $600 billion plus global pharmaceutical market.
ORION LABORATORIES LTD: AN OVERVIEW:
Orion Laboratories Limited, a member of Orion group was founded as a pharmaceutical manufacturing company in 1965. In the huge severely aggressive pharmaceutical market, Orion has erected titan treads to settle firmly itself as one of the foremost pharmaceutical industries in Bangladesh, from the time of its submissive commencement on 1965. As go along with hallucination, Orion has been proficient to make its incredibly strapping principled presence felt in the society, consequently, Orion Laboratories Limited get hold of solemn promise of ascribing obligations in assembling as well as marketing effective, modern and life saving medicines including products related to health care for the calamity and adversity of humankind of the state, in order to not only diminish the undergoing and distress of disgusted people but also to accommodate to the requires of health care of the community and recovered future for the country, whereas, in each stride, from the procurement of raw material to the manufacturing of finished goods, the company chases, imitate and support the latest World Health Organization (WHO) permitted all principles of Good Manufacturing Practices (GMP).
The yearly sale of Orion Laboratories Ltd was 105 Cr in 2006 with a growth rate of 5 percent and a market share of 2.26 percent.
Table: Domestic Sales trend of Orion
Year | Sales in Cr | Growth% | Market Share % |
2006 | 105 | 5.0 | 2.26 |
2005 | 100 | 53.42 | 2.51 |
2004 | 65 | 12.81 | 2.43 |
2003 | 58 | 16.80 | 2.12 |
2002 | 49 | 40.86 | 1.82 |
PRODUCT OFFERINGS:
Orion offers a wide range of pharmaceutical portfolio of different therapeutic segments of more than 100 generics in more than 150 presentations. Moreover, Orion has gained a leading edge in many therapeutic groups like Anticancer, Antibiotic, Cardiovascular, Antipsychotic, Vitamins and Minerals, Antidiabetics, Antiallergies, Antioxidents, Haematinics, NSAIDs, Antiulcerants and so on. To remain at the forefront of challenging pharma field, Orion is also headed towards the launching of new and innovative molecules.
TOP TEN PRODUCTS OF ORION LABORATORIES LIMITED
Rank Brand
1 Ractin 4 mg Tablet
2 Procap-20 mg
3 Deslor Tablet
4 Frulac 20 mg Tablet
5 Onium Tablet
6 EC-plus Tablet
7 Vertex 1 mg IV Injection
8 Clognil Plus Tablet
9 Maprocin 500 mg
10 Azalid 500 Tablet
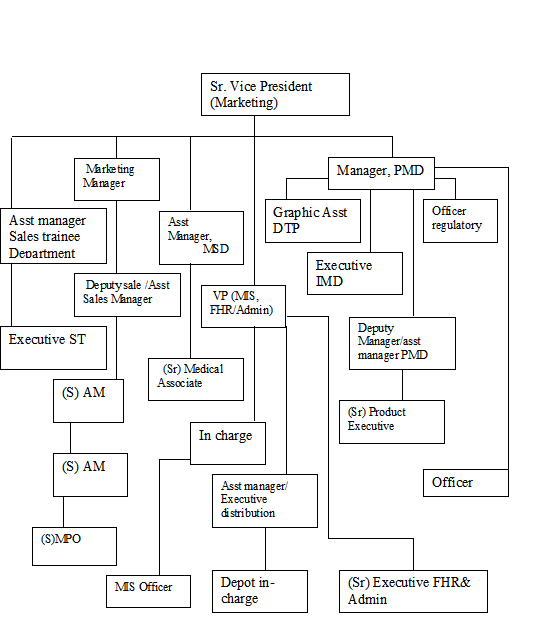
OPERATIONAL NETWORK OF OLL :
VISIONS, MISSION AND VALUES:
Vision: To be regarded as a world-class pharmaceutical company through products and services
Mission: Our mission is to provide health care service to the ailing humanity round the globe by:
Continuous development of people competence
Recognizing individual contribution
Introducing new as well as innovative products and technologies
Assuring quality products from advanced manufacturing facilities
Exceeding customer satisfaction and gaining trust through quality services
Expanding the export market
Values: In order to achieve its aspired vision, Orion Laboratories Limited subscribes the following values:
Quality in everything we do
Live up to our commitments
Transparent and fair in all our dealings
Take initiative to exceed standards
Trust and respect for each other
Work as a team
Share social responsibility
ROLE OF DOCTORS, CHEMISTS WITH MEDICAL REPRESENTATIVES IN PHARMACEUTICAL MARKETING:
The Medical Promotion Offer also called Medical Representatives are the front line sales forces for pharmaceutical firms. They play a vital role in the promotion of products and the success of a firm substantially depends on their expertise and qualities. The role of doctor is to prescribe the medicine after diagnosis the disease. They take some samples from the representative. Every doctor sees the quality of medicine of any pharmaceutical company. And then they measure which medicine is perfect for the patient. After then the doctor mention the product in his /her prescription. Some of the doctor becomes biasness of any company. When a doctor becomes biasness he does not measure the quality the product. Those doctors mention the selective company’s products if it is not fit for the patient. Some of doctors do not like the biasness. They only mention the perfect medicine for the patient of any company. Sometime the doctors take experiment to the patient of a new product. The role of representative is to give the promotional tool (like sample, gift), take more time from the doctors; the medical promotion officer deliver new massage to the doctors. They also survey the prescription from the chemist shop; they go to the chemists chop very frequently for taking order, they also check expiry data of product and communicate very heartily to the doctors and chemists. The role of chemists is to sale the product according to the doctor’s prescription. They can sale the OTC product without prescription. The doctors and the chemists know only the representative of a company.
INTERACTION AND INTERPERSONAL RELATIONSHIP IN PHARMACEUTICAL BUSINESS WITH DOCTORS AND CHEMISTS:
Interaction is a way of framing the relationship between people to build up communication. Interaction is a key aspect of function, and function is a key aspect of communication.
The interaction of doctors and pharmaceutical companies isextremely consequential for patients, doctors, and the largersociety. The pharmaceutical industry manufactures, distributes, and publicizespowerful chemical and biologic agents that have proven benefitsand that physician sometimes fail to use as often as they should,or in sufficient doses. The Medical Promotion Officer interacts with the doctors to achieve their desired business goal. During the interaction with the doctors, Medical Promotion Officer uses the pharmaceutical tools. The Medical Promotion Officer offer launch product to the doctors. The Medical Promotion Officer discuss about their product getup. And then the doctors mention the medicine in his prescription. By this way the doctors share the interaction with the Medical Promotion Officer. We can find out the depth interaction of doctors and Medical Promotion Officers.
During the interaction with the chemists, the Medical Promotion Officer uses the chemists’ gift. They offer pen, pad to the chemists. The Medical Promotion Officer goes to the chemists shop very frequently for taking order. At the time of taking order the Medical Promotion Officer are very gently to the chemists. By the way we can find out the depth interaction of Medical Promotion Officer to the chemists. If the interaction will good, the business will be better.
An interpersonal relationship is a relatively long-term association between two or more people. This association may be based on emotions like love and liking, regular business interactions, or some other type of social commitment. Interpersonal relationships take place in a great variety of contexts, such as family, friends, marriage, acquaintances, work, clubs, neighborhoods, and churches. They may be regulated by law, custom, or mutual agreement, and are the basis of social groups and society as a whole. Although humans are fundamentally social creatures, interpersonal relationships are not always healthy. Examples of unhealthy relationships include abusive relationships and codependence.
These relationships usually involve some level of interdependence. People in a relationship tend to influence each other, share their thoughts and feelings, and engage in activities together. Because of this interdependence, most things that change or impact one member of the relationship will have some level of impact on the other member.
For the period of interpersonal relationship with the doctors, the Medical Promotion Officer uses the pharmaceutical tools. The Medical Promotion Officer offer launch product to the doctors. The Medical Promotion Officer discuss about their product getup and quality of the product. And then the doctors mention the medicine in his prescription. By this way the doctors share the interpersonal relationship with the Medical Promotion Officer. We can find out the depth interpersonal relationship of doctors and Medical Promotion Officers.
During the interpersonal relationship with the chemists, the Medical Promotion Officer uses the chemists’ gift. They offer pen, pad to the chemists. The Medical Promotion Officer goes to the chemists shop very frequently for taking order. The Medical Promotion Officer discusses various problems with the chemists about their products. They also try to solve the problem as soon as possible. At the time of taking order the Medical Promotion Officer are very gently to the chemists. By the way we can find out the depth interaction of Medical Promotion Officer to the chemists. If the interaction will good, the business will be better.
Interaction and interpersonal relationship of representatives with the physicians and chemists is tremendously important in any pharmaceutical company. It is said that the representative are the root of all pharmaceutical business. Interaction and Interpersonal relationship is fully depends on the Medical Promotion Officers. If the interaction and interpersonal relationship of Medical Promotion officers, doctors and chemists is good, the business will be better. If the interaction and interpersonal relationship, the doctor will mention the medicine is his prescription. And if the doctors prescribe then the medicine will must sale. The more interaction and interpersonal relationship the pharmaceutical company will more develop. So we can say doctors and representatives are the parts and parcel of the pharmaceutical companies.
As a final point we can say the representatives have to make friendship relation with the doctors and the chemists to develop the pharmaceutical marketing.
DATA COLLECTED FROM DOCTORS:
Doctors:
| Categories | Frequency | Percentage |
| Specialists | 20 | 40 |
| General practitioners | 18 | 36 |
| Others | 12 | 24 |
| Total | 50 | 100 |
Chemists:
| Categories | Frequency | Percentage |
| Whole sellers | 8 | 16 |
| Retailers | 30 | 60 |
| Chemist com doctors | 12 | 24 |
| Total | 50 | 100 |
Q: 1. (The Representative of Orion’s is very cordial to you.)
Frequency table: 4.1.1
| Score | Frequency | Percent | Cumulative Percent | |
| 2.00 | 1 | 2.0 | 2.0 | |
| 3.00 | 1 | 2.0 | 4.0 | |
| 4.00 | 21 | 42.0 | 46.0 | |
| 5.00 | 27 | 54.0 | 100.0 | |
| Total | 50 | 100.0 | ||
Q: 2. (Orion’s representative is well aware about your likings.)
Frequency table: 4.1.2
| Score | Frequency | Percent | Cumulative Percent | |
| 1.00 | 2 | 4.0 | 4.0 | |
| 2.00 | 3 | 6.0 | 10.0 | |
| 3.00 | 21 | 42.0 | 52.0 | |
| 4.00 | 21 | 42.0 | 94.0 | |
| 5.00 | 3 | 6.0 | 100.0 | |
| Total | 50 | 100.0 | ||
Q: 3. (Your personal requirements are seriously addressed by Orion’s Representative.)
Frequency table: 4.1.3
| Score | Frequency | Percent | Cumulative Percent | |
| 1.00 | 2 | 4.0 | 4.0 | |
| 2.00 | 7 | 14.0 | 18.0 | |
| 3.00 | 17 | 34.0 | 52.0 | |
| 4.00 | 21 | 42.0 | 94.0 | |
| 5.00 | 3 | 6.0 | 100.0 | |
| Total | 50 | 100.0 | ||
Q: 4. (Orion’s representative maintains relation with you outside your personal.)
Frequency table: 4.1.4
| Score | Frequency | Percent | Cumulative Percent | |
| 1.00 | 5 | 10.0 | 10.0 | |
| 2.00 | 11 | 22.0 | 32.0 | |
| 3.00 | 16 | 32.0 | 64.0 | |
| 4.00 | 17 | 34.0 | 98.0 | |
| 5.00 | 1 | 2.0 | 100.0 | |
| Total | 50 | 100.0 | ||
Q: 5. (During visit the Representative of Orion takes more time from you.)
Frequency table: 4.1.5
| Score | Frequency | Percent | Cumulative Percent | |
| 1.00 | 2 | 4.0 | 4.0 | |
| 2.00 | 6 | 12.0 | 16.0 | |
| 3.00 | 20 | 40.0 | 56.0 | |
| 4.00 | 19 | 38.0 | 94.0 | |
| 5.00 | 3 | 6.0 | 100.0 | |
| Total | 50 | 100.0 | ||
Q: 6. (Confidence of Orion’s representative during detailing is very high.)
Frequency table: 4.1.6
| Score | Frequency | Percent | Cumulative Percent | |
| 1.00 | 1 | 2.0 | 2.0 | |
| 2.00 | 5 | 10.0 | 12.0 | |
| 3.00 | 12 | 24.0 | 36.0 | |
| 4.00 | 31 | 62.0 | 98.0 | |
| 5.00 | 1 | 2.0 | 100.0 | |
| Total | 50 | 100.0 | ||
Q: 7. (Orion’s representative is very careful in delivering the message to you.)
Frequency table: 4.1.7
| Score | Frequency | Percent | Cumulative Percent | |
| 1.00 | 1 | 2.0 | 2.0 | |
| 2.00 | 1 | 2.0 | 4.0 | |
| 3.00 | 10 | 20.0 | 24.0 | |
| 4.00 | 15 | 30.0 | 54.0 | |
| 5.00 | 23 | 46.0 | 100.0 | |
| Total | 50 | 100.0 | ||
Q: 8. (The product knowledge of Orion’s Representative is very high.)
Frequency table: 4.1.8
| Score | Frequency | Percent | Cumulative Percent | |
| 2.00 | 1 | 2.0 | 2.0 | |
| 3.00 | 6 | 12.0 | 14.0 | |
| 4.00 | 18 | 36.0 | 50.0 | |
| 5.00 | 25 | 50.0 | 100.0 | |
| Total | 50 | 100.0 | ||
Q: 9. (The Representative of Orion is very assertive to get prescription from you.)
Frequency table: 4.1.9
| Score | Frequency | Percent | Cumulative Percent | |
| 2.00 | 2 | 4.0 | 4.0 | |
| 3.00 | 19 | 38.0 | 42.0 | |
| 4.00 | 27 | 54.0 | 96.0 | |
| 5.00 | 2 | 4.0 | 100.0 | |
| Total | 50 | 100.0 | ||
Q: 10. (Orion’s Representative is very serious to the reference of your query.)
Frequency table: 4.1.10
| Score | Frequency | Percent | Cumulative Percent | |
| 1.00 | 3 | 6.0 | 6.0 | |
| 2.00 | 9 | 18.0 | 24.0 | |
| 3.00 | 17 | 34.0 | 58.0 | |
| 4.00 | 18 | 36.0 | 94.0 | |
| 5.00 | 3 | 6.0 | 100.0 | |
| Total | 50 | 100.0 | ||
Data collected form the chemists:
Q: 1. (Visit frequency of Orion’s Representative is satisfactory.)
Frequency table: 4.2.11
| Score | Frequency | Percent | Cumulative Percent | |
| 2.00 | 3 | 6.0 | 6.0 | |
| 3.00 | 3 | 6.0 | 12.0 | |
| 4.00 | 6 | 12.0 | 24.0 | |
| 5.00 | 38 | 76.0 | 100.0 | |
| Total | 50 | 100.0 | ||
Q: 2. (Orion’s Representative communicates very heartily to you.)
Frequency table: 4.1.13
| Score | Frequency | Percent | Cumulative Percent | |
| 1.00 | 3 | 6.0 | 6.0 | |
| 2.00 | 1 | 2.0 | 8.0 | |
| 3.00 | 1 | 2.0 | 10.0 | |
| 4.00 | 12 | 24.0 | 34.0 | |
| 5.00 | 33 | 66.0 | 100.0 | |
| Total | 50 | 100.0 | ||
Q: 3. (While taking order Orion’s Representative enter into your shop.)
Frequency table: 4.1.13
| Score | Frequency | Percent | Cumulative Percent | |
| 1.00 | 2 | 4.0 | 4.0 | |
| 2.00 | 19 | 38.0 | 42.0 | |
| 3.00 | 14 | 28.0 | 70.0 | |
| 4.00 | 14 | 28.0 | 98.0 | |
| 5.00 | 1 | 2.0 | 100.0 | |
| Total | 50 | 100.0 | ||
Q: 4. (Chemist’s gifts are offered very cordially by Orion’s Representative.)
Frequency table: 4.1.14
| Score | Frequency | Percent | Cumulative Percent | |
| 1.00 | 3 | 6.0 | 6.0 | |
| 2.00 | 13 | 26.0 | 32.0 | |
| 3.00 | 11 | 22.0 | 54.0 | |
| 4.00 | 15 | 30.0 | 84.0 | |
| 5.00 | 8 | 16.0 | 100.0 | |
| Total | 50 | 100.0 | ||
Q :5. (Orion’s Representative is very serious to return the damage products.)
Frequency table: 4.1.15
| Score | Frequency | Percent | Cumulative Percent | |
| 1.00 | 3 | 6.0 | 6.0 | |
| 2.00 | 16 | 32.0 | 38.0 | |
| 3.00 | 11 | 22.0 | 60.0 | |
| 4.00 | 10 | 20.0 | 80.0 | |
| 5.00 | 10 | 20.0 | 100.0 | |
| Total | 50 | 100.0 | ||
Q: 6. (Commitment is maintain very seriously by Orion’s Representative.)
Frequency table: 4.1.16
| Score | Frequency | Percent | Cumulative Percent | |
| 1.00 | 3 | 6.0 | 6.0 | |
| 2.00 | 4 | 8.0 | 14.0 | |
| 3.00 | 9 | 18.0 | 32.0 | |
| 4.00 | 26 | 52.0 | 84.0 | |
| 5.00 | 8 | 16.0 | 100.0 | |
| Total | 50 | 100.0 | ||
Q: 7. (Orion’s Representative takes order very seriously in alphabetic order from you.)
Frequency table: 4.1.17
| Score | Frequency | Percent | Cumulative Percent | |
| 1.00 | 2 | 4.0 | 4.0 | |
| 2.00 | 1 | 2.0 | 6.0 | |
| 3.00 | 1 | 2.0 | 8.0 | |
| 4.00 | 16 | 32.0 | 40.0 | |
| 5.00 | 30 | 60.0 | 100.0 | |
| Total | 50 | 100.0 | ||
Q: 8. (The expiry date of products is checked very often by Orion’s Representative.)
Frequency table: 4.1.18
| Score | Frequency | Percent | Cumulative Percent | |
| 1.00 | 1 | 2.0 | 2.0 | |
| 2.00 | 8 | 16.0 | 18.0 | |
| 3.00 | 9 | 18.0 | 36.0 | |
| 4.00 | 17 | 34.0 | 70.0 | |
| 5.00 | 15 | 30.0 | 100.0 | |
| Total | 50 | 100.0 | ||
Q:9. (Prescription is surveyed very frequently by the Orion’s Representative.)
Frequency table: 4.1.19
| Score | Frequency | Percent | Cumulative Percent | |
| 1.00 | 1 | 2.0 | 2.0 | |
| 2.00 | 3 | 6.0 | 8.0 | |
| 3.00 | 2 | 4.0 | 12.0 | |
| 4.00 | 19 | 38.0 | 50.0 | |
| 5.00 | 25 | 50.0 | 100.0 | |
| Total | 50 | 100.0 | ||
Q: 10. (Orion’s Representative is very assertive to peruse the OTC products.)
Frequency table: 4.1.20
| Score | Frequency | Percent | Cumulative Percent | |
| 1.00 | 3 | 6.0 | 6.0 | |
| 2.00 | 6 | 12.0 | 18.0 | |
| 3.00 | 3 | 6.0 | 24.0 | |
| 4.00 | 20 | 40.0 | 64.0 | |
| 5.00 | 18 | 36.0 | 100.0 | |
| Total | 50 | 100.0 | ||
Descriptive statistic for the Doctors
Table: 4.2.1
N | Minimum | Maximum | Mean | Std. Deviation | |
| Q1 | 50 | 2.00 | 5.00 | 4.4800 | .64650 |
| Q2 | 50 | 1.00 | 5.00 | 3.4000 | .85714 |
| Q3 | 50 | 1.00 | 5.00 | 3.3200 | .93547 |
| Q4 | 50 | 1.00 | 5.00 | 2.9600 | 1.02936 |
| Q5 | 50 | 1.00 | 5.00 | 3.3000 | .90914 |
| Q6 | 50 | 1.00 | 5.00 | 3.5200 | .78870 |
| Q7 | 50 | 1.00 | 5.00 | 4.1600 | .95533 |
| Q8 | 50 | 2.00 | 5.00 | 4.3400 | .77222 |
| Q9 | 50 | 2.00 | 5.00 | 3.5800 | .64175 |
| Q10 | 50 | 1.00 | 5.00 | 3.1800 | 1.00387 |
| Valid N (listwise) | 50 |
Descriptive Statistics for the Chemists
Table: 4.2.2
N | Minimum | Maximum | Mean | Std. Deviation | |
| Q1 | 50 | 1.00 | 5.00 | 4.4200 | 1.07076 |
| Q2 | 50 | 2.00 | 5.00 | 4.5800 | .85928 |
| Q3 | 50 | 1.00 | 5.00 | 2.8600 | .94782 |
| Q4 | 50 | 1.00 | 5.00 | 3.2400 | 1.18769 |
| Q5 | 50 | 1.00 | 5.00 | 3.1600 | 1.25129 |
| Q6 | 50 | 1.00 | 5.00 | 3.6400 | 1.04511 |
| Q7 | 50 | 1.00 | 5.00 | 4.4200 | .94954 |
| Q8 | 50 | 1.00 | 5.00 | 3.7400 | 1.12141 |
| Q9 | 50 | 1.00 | 5.00 | 4.2800 | .94847 |
| Q10 | 50 | 1.00 | 5.00 | 3.8800 | 1.20611 |
| Valid N (listwise) | 50 |
DATA INTERPRETATION OF DOCTORS :
Question No 1: The representative of Orion is very cordial to you.
(Rank 1=strongly agree and rank 5= strongly disagree)
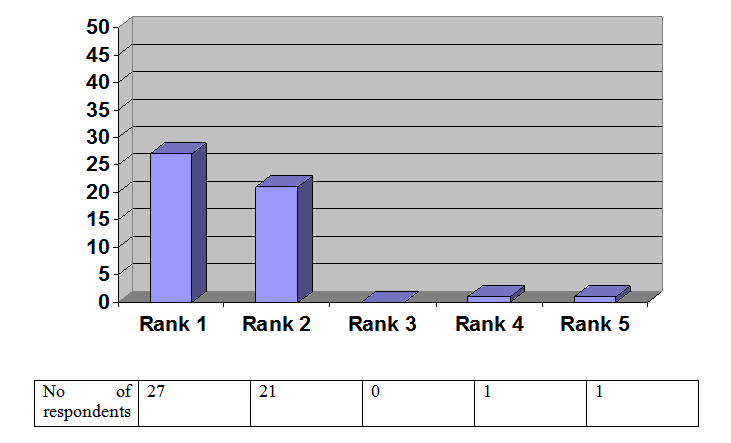
From the above chart (figure 4.1.1), we can see that 27 out of 50 Doctors (56%) are very cordial to the representative as the first indication.
From the above chart (figure 4.1.1), we can see that 21 out of 50 Doctors (42%) are cordial to the representative in the second indication.
From the above chart (figure 4.1.1), we can see that 0 out of 50 Doctors (0%) are not response to the representative in the third indication.
From the above chart (figure 4.1.1), we can see that 1 out of 50 Doctors (2%) are less cordial to the representative in the forth indication.
From the above chart (figure 4.1.1), we can see that 1 out of 50 Doctors (2%) are not cordial to the representative in the fifth indication.
Question No 2. Orion representative is well aware about your likings.
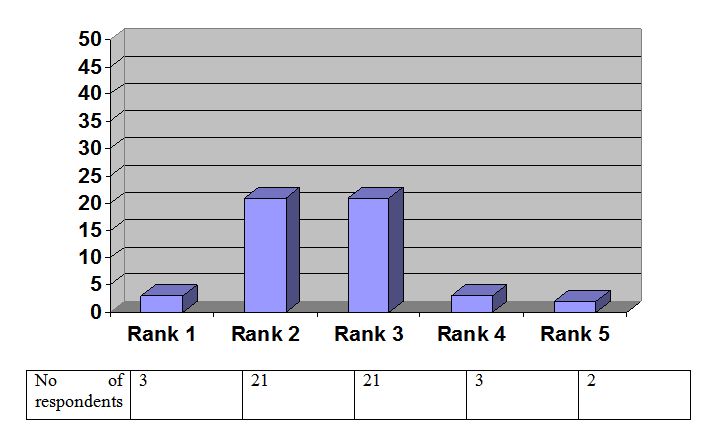
From the Above chart (figure 4.1.2), we can see that 3 out of 50 Doctors (6%) are very aware about likings to the representative as the first indication.
From the above chart (figure 4.1.2), we can see that 21 out of 50 Doctors (42%) are aware about likings to the representative in the second indication.
From the above chart (figure 4.1.2), we can see that 21 out of 50 Doctors (42%) are not given any response of their likings to the representative in the third indication.
From the above chart (figure 4.1.2), we can see that 3 out of 50 Doctors (6%) are disagree to the representative to the above in the forth indication.
From the above chart (figure 4.1.2), we can see that 2 out of 50 Doctors (4%) are strongly disagree to the representative in the fifth indication.
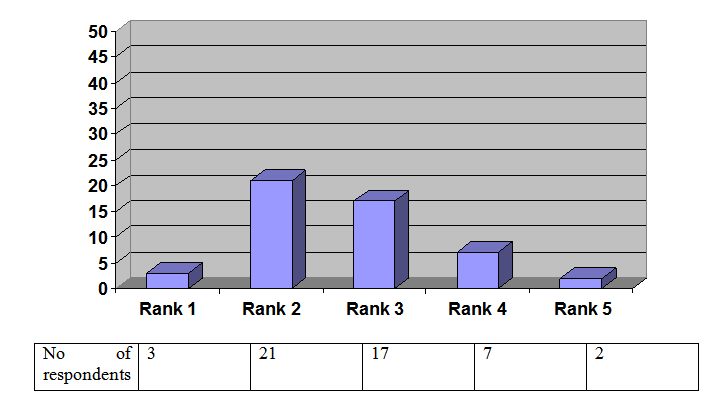
From the above chart (figure 4.1.3), we can see that 3 out of 50 Doctors (6%) are very seriously addressed by the representative as the first indication.
From the above chart (figure 4.1.3), we can see that 21 out of 50 Doctors (42%) are seriously addressed by the representative in the second indication.
From the above chart (figure 4.1.3), we can see that 17 out of 50 Doctors (34%) are not given any response in the third indication.
From the above chart (figure 4.1.3), we can see that 7 out of 50 Doctors (14%) are not addressed by the representative in the forth indication.
From the above chart (figure 4.1.3), we can see that 2 out of 50 Doctors (4%) are not strongly addressed by the representative in the fifth indication.
From the above chart (figure 4.1.4), we can see that 1 out of 50 Doctors (2%) are very seriously maintains relation outside their profession by the representative as the first indication.
From the above chart (figure 4.1.4), we can see that 17 out of 50 Doctors (34%) are seriously maintains relation outside their profession by the representative in the second indication.
From the above chart (figure 4.1.4), we can see that 16 out of 50 Doctors (32%) are not given any response in the third indication.
From the above chart (figure 4.1.4), we can see that 11 out of 50 Doctors (22%) are not maintains relation outside their profession by the representative in the forth indication.
From the above chart (figure 4.1.4), we can see that 5 out of 50 Doctors (10%) are not strongly maintains relation outside their profession by the representative in the fifth indication.
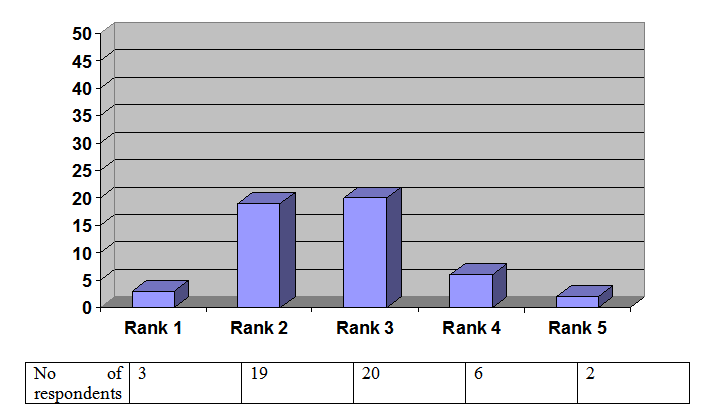
From the above chart (figure 4.1.5), we can see that 3 out of 50 Doctors (6%) are give more time to the representative in the first indication.
From the above chart (figure 4.1.5), we can see that 19 out of 50 Doctors (38%) are give time to the representative in the second indication.
From the above chart (figure 4.1.5), we can see that 20 out of 50 Doctors (40%) are not give any response during the visit in the third indication.
From the above chart (figure 4.1.5), we can see that 6 out of 50 Doctors (12%) are not give time to the representative during the visit in the forth indication.
From the above chart (figure 4.1.5), we can see that 2 out of 50 Doctors (4%) are strongly disagree to give time to the representative in the fifth indication.
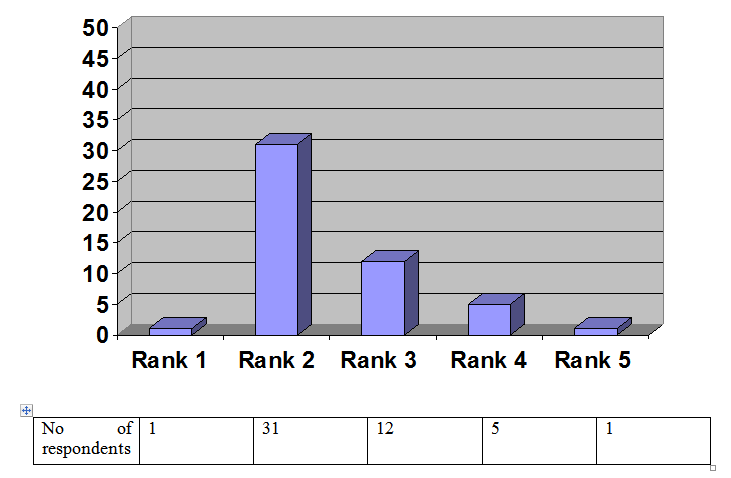
From the above chart (figure 4.1.6), we can see that 1 out of 50 Doctors (2%) are very confidence to the representative in the first indication.
From the above chart (figure 4.1.6), we can see that 31 out of 50 Doctors (62%) are confidence to the representative in the second indication.
From the above chart (figure 4.1.6), we can see that 12 out of 50 Doctors (24%) are not give any response in confidence to the representative in the third indication.
From the above chart (figure 4.1.6), we can see that 5 out of 50 Doctors (10%) are not confident by the representative during detailing in the forth indication.
From the above chart (figure 4.1.6), we can see that 1 out of 50 Doctors (2%) are not giving any confident to the representative in the fifth indication.
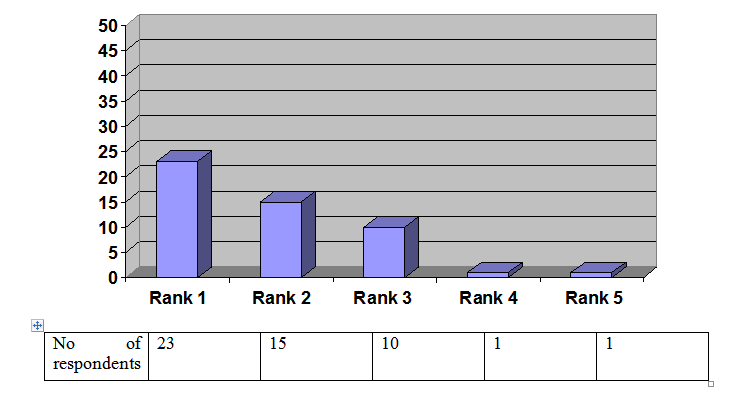
From the above chart (figure 4.1.7), we can see that 23 out of 50 Doctors (46%) are strongly get message by the representative in the first indication.
From the above chart (figure 4.1.7), we can see that 15 out of 50 Doctors (30%) are get message by the representative in the second indication.
From the above chart (figure 4.1.7), we can see that 10 out of 50 Doctors (20%) are not give any response to get message by the representative in the third indication.
From the above chart (figure 4.1.7), we can see that 1 out of 50 Doctors (2%) are not get message by the representative during detailing in the forth indication.
From the above chart (figure 4.1.7), we can see that 1 out of 50 Doctors (2%) are not strongly getting any message by the representative in the fifth indication.
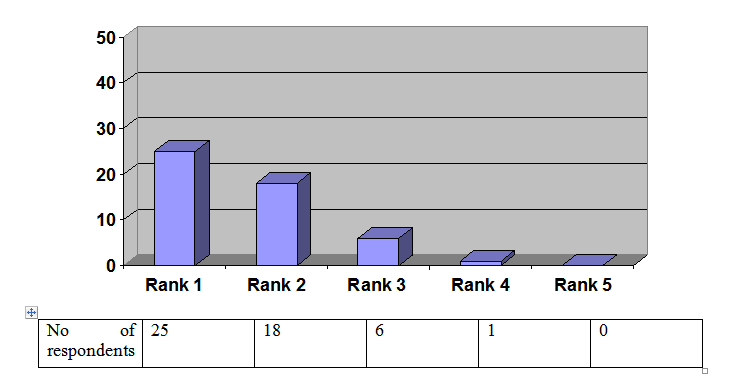
From the above chart (figure 4.1.8), we can see that 25 out of 50 Doctors (50%) are known that the representative have enough knowledge about the product in the first indication.
From the above chart (figure 4.1.8), we can see that 18 out of 50 Doctors (36%) are known that the representative have product knowledge in the second indication.
From the above chart (figure 4.1.8), we can see that 6 out of 50 Doctors (12%) are not give any response about the product knowledge of the representative in the third indication.
From the above chart (figure 4.1.8), we can see that 1 out of 50 Doctors (2%) are known that there is no product knowledge in the forth indication.
From the above chart (figure 4.1.8), we can see that 0 out of 50 Doctors (0%) are known that there is no any product knowledge of the representative in the fifth indication.
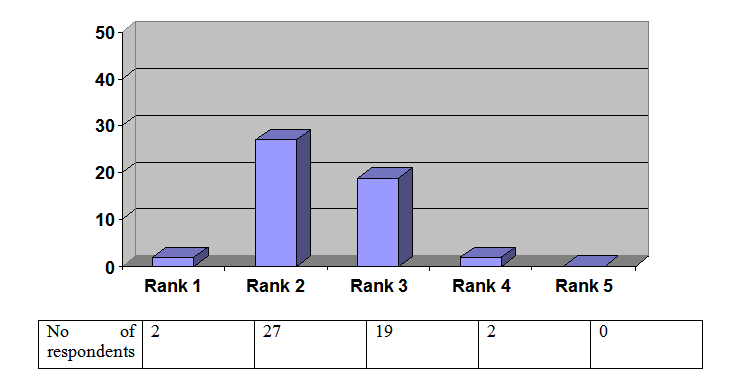
From the above chart (figure 4.1.9), we can see that 2 out of 50 Doctors (4%) are known that the representative is very assertive to get prescription from the doctor in the first indication.
From the above chart (figure 4.1.9), we can see that 27 out of 50 Doctors (54%) are known that the representative is assertive to get prescription from the doctor in the second indication.
From the above chart (figure 4.1.9), we can see that 19 out of 50 Doctors (38%) are not give any response to get prescription from the doctor in the third indication.
From the above chart (figure 4.1.9), we can see that 2 out of 50 Doctors (4%) are known that the representatives are not assertive to get prescription from the doctor in the forth indication.
From the above chart (figure 4.1.9), we can see that 0 out of 50 Doctors (0%) are known that the representatives are not very assertive to get prescription from the doctor fifth indication.
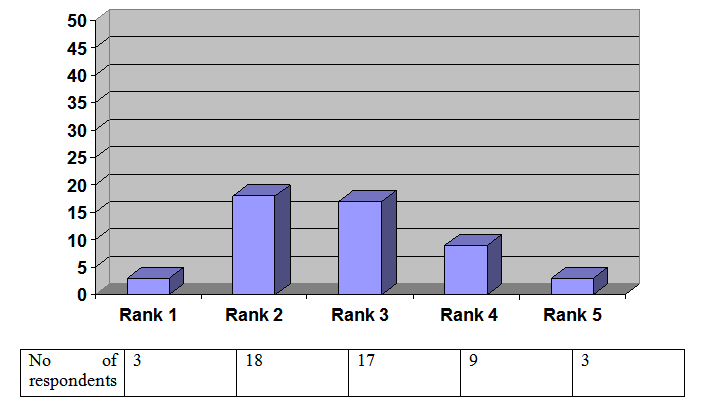
From the above chart (figure 4.1.10), we can see that 3 out of 50 Doctors (6%) are known that the representative is very serious to the reference of the doctor’s query in the first indication.
From the above chart (figure 4.1.10), we can see that 18 out of 50 Doctors (36%) are known that the representative is serious to the reference of the doctor’s query in the second indication.
From the above chart (figure 4.1.10), we can see that 17 out of 50 Doctors (34%) are not give any response to the above question in the third indication.
From the above chart (figure 4.1.10), we can see that 9 out of 50 Doctors (18%) are
Known that the representatives are not serious to the reference of the doctor’s query in the forth indication.
From the above chart (figure4.1.0), we can see that 3 out of 50 Doctors (6%) are known that the representatives are not very serious to the reference of the doctor’s query fifth indication.
DATA INTERPRETATION OF CHEMISTS :
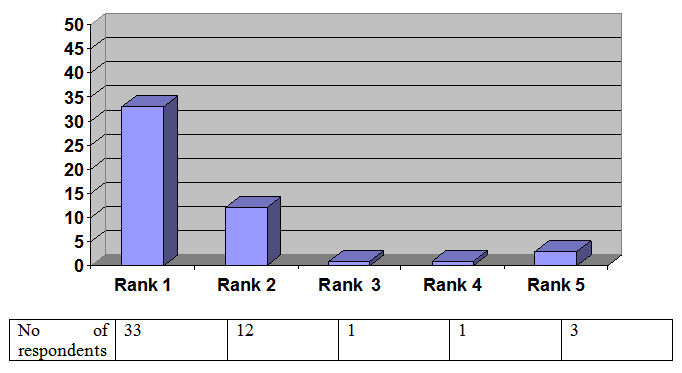
From the above chart (figure 4.1.11), we can see that 33 out of 50 Chemists (66%) are strongly satisfied the visit of Representative in the first indication.
From the above chart (figure 4.1.11), we can see that 12 out of 50 Chemist (24%) are satisfied the visit of representative in the second indication.
From the above chart (figure 4.1.11), we can see that 1 out of 50 Chemists (2%) are not give any response to the above question in the third indication.
From the above chart (figure 4.1.11), we can see that 1out of 50 Chemists (2%) are not satisfied the visit of representative in the forth indication.
From the above chart (figure 4.1.11), we can see that 3 out of 50 Chemists (6%) are not found any respondent in fifth indication.
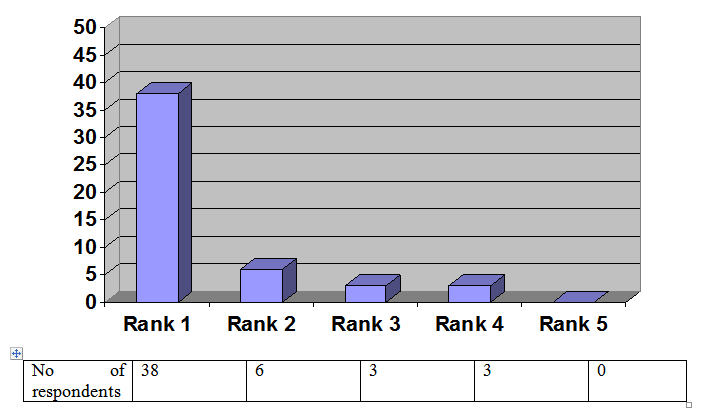
From the above chart (figure 4.1.12), we can see that 38 out of 50 Chemists (76%) are strongly agree that the representatives are heartily of them in the first indication.
From the above chart (figure 4.1.12), we can see that 6 out of 50 Chemist (12%) are agree that the representatives are heartily of them in the second indication.
From the above chart (figure 4.1.12), we can see that 3 out of 50 Chemists (6%) are not give any response to the above question in the third indication.
From the above chart (figure 4.1.12), we can see that 3 out of 50 Chemists (6%) are not satisfied the communication of Representative in the forth indication.
From the above chart (figure 4.1.12), we can see that 0 out of 50 Chemists (0%) are not strongly heartily to the representative in fifth indication.
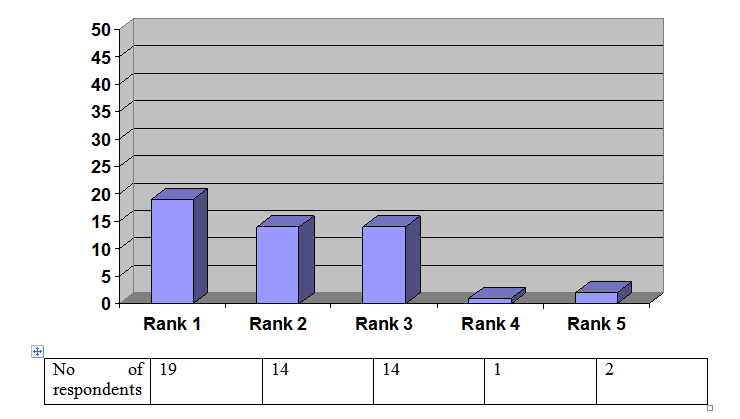
From the above chart (figure 4.1.13), we can see that 19 out of 50 Chemists (38%) are strongly agree to entering into the shop in the first indication.
From the above chart (figure 4.1.13), we can see that 14 out of 50 Chemist (28%) are agree to entering into their shop in the second indication.
From the above chart (figure 4.1.13), we can see that 14 out of 50 Chemists (28%) are not give any response to the above question in the third indication.
From the above chart (figure 4.1.13), we can see that 1 out of 50 Chemists (2%) are dissatisfied to entering the shop of Representative in the forth indication.
From the above chart (figure 4.1.13), we can see that 2 out of 50 Chemists (4%) are strongly dissatisfied to entering heartily to the representative in fifth indication.
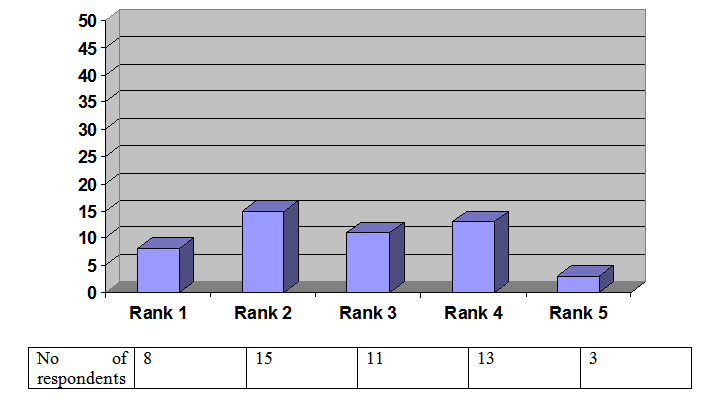
From the above chart (figure 4.1.14), we can see that 8 out of 50 Chemists (16%) are offered very cordially chemist’s gift by the representative in the first indication.
From the above chart (figure 4.1.14), we can see that 15 out of 50 Chemist (30%) are offered chemist’s gift by the representative in the second indication.
From the above chart (figure 4.114), we can see that 11 out of 50 Chemists (22%) are not give any response to the above question in the third indication.
From the above chart (figure 4.1.14), we can see that 13 out of 50 Chemists (26%) are not offered any chemist’s gift by representative in the forth indication.
From the above chart (figure 4.1.14), we can see that 3 out of 50 Chemists (6%) are never offered any chemist’s gift by the representative in fifth indication.
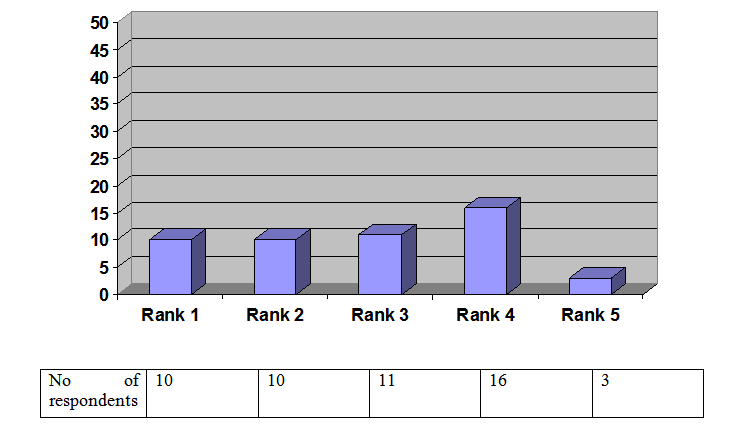
From the above chart (figure 4.1.15), we can see that 10 out of 50 Chemists (20%) are return the damage product very seriously to the representative in the first indication.
From the above chart (figure 4.1.15), we can see that 10 out of 50 Chemist (20%) are return the damage product in the second indication.
From the above chart (figure 4.1.15), we can see that 11 out of 50 Chemists (22%) are not give any response to the above question in the third indication.
From the above chart (figure 4.1.15), we can see that 16 out of 50 Chemists (32%) say that the representative do not take return any damage products in the forth indication.
From the above chart (figure 4.1.15), we can see that 3 out of 50 Chemists (6%) say that the representative never takes return any product from the chemists in fifth indication.
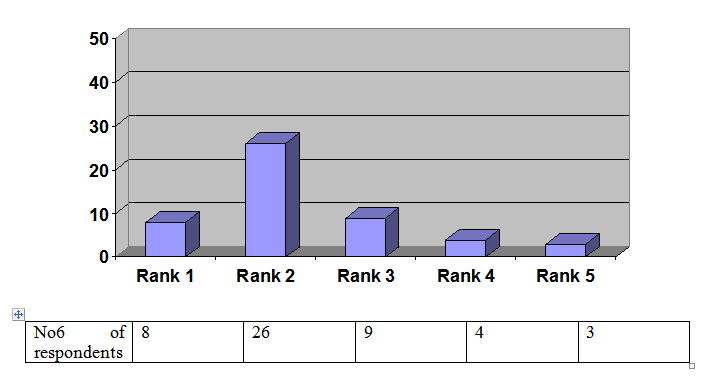
From the above chart (figure 4.1.16), we can see that 8 out of 50 Chemists (16%) say that the commitment is maintained very seriously by the representative in the first indication.
From the above chart (figure 4.1.16), we can see that 26 out of 50 Chemist (52%) say that the commitment is maintained by the representative in the second indication.
From the above chart (figure 4.1.16), we can see that 9 out of 50 Chemists (18%) are not give any response to the above question in the third indication.
From the above chart (figure 4.1.16), we can see that 4 out of 50 Chemists (8%) say that the representative do not maintain their commitment in the forth indication.
From the above chart (figure 4.1.16), we can see that 3 out of 50 Chemists (6%) say that the representatives never maintain their commitment in fifth indication.
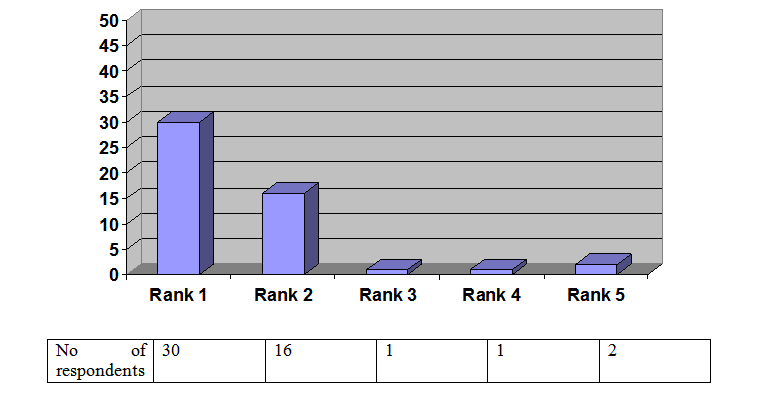
From the above chart (figure 4.1.17), we can see that 30 out of 50 Chemists (60%) say that the representative takes order very seriously in alphabetic order from the chemists in the first indication.
From the above chart (figure 4.1.17), we can see that 16 out of 50 Chemist (32%) say that the representative takes order in alphabetic order from the chemists in the second indication.
From the above chart (figure 4.1.17), we can see that 1 out of 50 Chemists (2%) are not give any response to the above question in the third indication.
From the above chart (figure 4.1.17), we can see that 1 out of 50 Chemists (2%) say that the representative do not takes order in alphabetic order from the chemists in the forth indication.
From the above chart (figure 4.2.17), we can see that 2 out of 50 Chemists (4%) say that the representatives never take order in alphabetic order from the chemists in fifth indication.
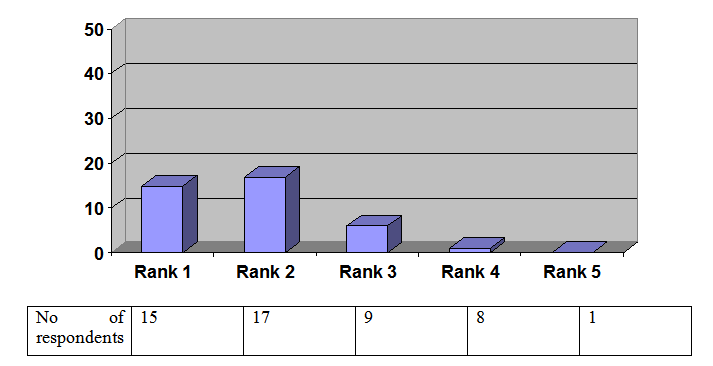
From the above chart (figure 4.1.18), we can see that 15 out of 50 Chemists (30%) say that the representative checked the expiry data of products in the chemist shop in the first indication.
From the above chart (figure 4.1.18), we can see that 17 out of 50 Chemist (34%) say that the representative checked the expiry data of products in the chemist shop in the second indication.
From the above chart (figure 4.1.18), we can see that 9 out of 50 Chemists (18%) are not give any response to the above question in the third indication.
From the above chart (figure 4.1.18), we can see that 8 out of 50 Chemists (16%) say that the representative do not checked the expiry data of products in the chemist shop in the forth indication.
From the above chart (figure 4.1.18), we can see that 1 out of 50 Chemists (2%) say that the representatives never checked the expiry data of products in the chemist shop in fifth indication.
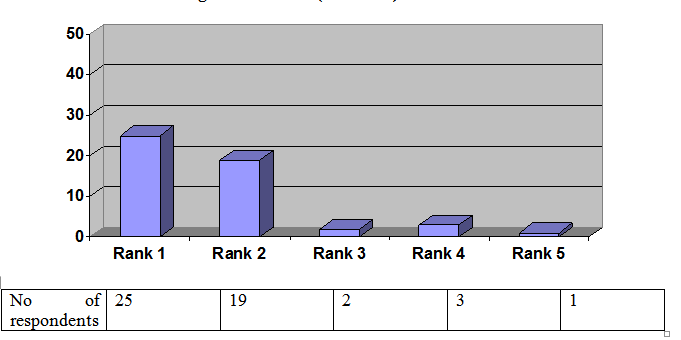
From the above chart (figure 4.1.19), we can see that 25 out of 50 Chemists (50%) say that the representative survey the prescription very frequently in chemist shop in the first indication.
From the above chart (figure 4.1.19), we can see that 19 out of 50 Chemist (38%) say that the representative survey the prescription frequently in the chemist shop in the second indication.
From the above chart (figure 4.1.19), we can see that 2 out of 50 Chemists (4%) do not give any response to the above question in the third indication.
From the above chart (figure 4.1.19), we can see that 3 out of 50 Chemists (6%) say that the representative do not survey the prescription frequently in the chemist shop in the forth indication.
From the above chart (figure 4.1.19), we can see that 1 out of 50 Chemists (2%) say that the representatives never survey the prescription frequently in the chemist shop in fifth indication.
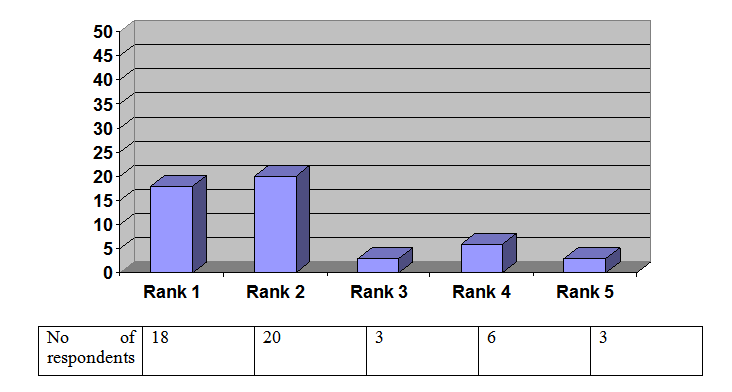
From the above chart (figure 4.1.20), we can see that 18 out of 50 Chemists (36%) say that the representatives are very assertive to pursue the OTC product in chemist shop in the first indication.
From the above chart (figure 4.1.20), we can see that 20 out of 50 Chemist (40%) say that the representatives are assertive to pursue the OTC product in the chemist shop in the second indication.
From the above chart (figure 4.1.20), we can see that 3 out of 50 Chemists (6%) do not give any response to the above question in the third indication.
From the above chart (figure 4.1.20), we can see that 6 out of 50 Chemists (12%) say that the representatives are not assertive to pursue the OTC product in the chemist shop in the forth indication.
From the above chart (figure 4.1.20), we can see that 3 out of 50 Chemists (6%) say that the representatives never assertive to pursue the OTC product in the chemist shop in fifth indication.
FINDINGS ANALYSIS AND INTERPRETATION
Relation with the doctors:
Table 4.2.1: Frequency Table of Question No.1
| N | Minimum | Maximum | Mean | Std |
DeviationQ1502.005.004.4800.64650
Table 4.1.1: Frequency Distribution table of question No. 1 (The Representative of Orion’s is very cordial to you.)
Frequency | Percent | Cumulative Percent | ||
| Valid | 2.00 | 1 | 2.0 | 2.0 |
| 3.00 | 1 | 2.0 | 4.0 | |
| 4.00 | 21 | 42.0 | 46.0 | |
| 5.00 | 27 | 54.0 | 100.0 | |
| Total | 50 | 100.0 | ||
The relation of Medical Promotion Officer of Orion with doctors seems to be very good. In Likart scale the mean of the response in questionnaire 1 (The Representative of Orion’s is very cordial to you) is 4.48 indicating that the doctors’ believe the Medical Promotion Officer of Orion is very cordial to the doctors. The low standard deviation (.64650) among the respondents’ response reveals that the reliability of mean and few doctors think that the Medical Promotion Officer of Orion are not cordial. From the frequency table we can see 96% of the doctors think that the Medical Promotion Officer of Orion is very cordial. The representative will continue by the way. And only 4% (2 out of 50) doctors disagree that they are cordial. Therefore the overall rating of doctors is “The Medical Promotion Officer of Orion is cordial”. The representative will go ahead by the way.
Doctor profile:
Table 4.2.2: Frequency Table of Question No. 2
| N | Minimum | Maximum | Mean | Std deviation | |
| Q2 | 50 | 1.00 | 5.00 | 3.4000 | .85714 |
Table 4.1.2: Frequency distribution table of question No. 2 (Orion’s representative is well aware about your likings.)
| Score | Frequency | Percent | Cumulative Percent | |
| 1.00 | 2 | 4.0 | 4.0 | |
| 2.00 | 3 | 6.0 | 10.0 | |
| 3.00 | 21 | 42.0 | 52.0 | |
| 4.00 | 21 | 42.0 | 94.0 | |
| 5.00 | 3 | 6.0 | 100.0 | |
| Total | 50 | 100.0 | ||
Orion Medical Promotion Officers are well aware about doctor’s profile. In Likart scale the mean of the response of question 2 (Orion’s representative is well aware about your likings) is 3.480 indicating that the doctors’ believe the Medical Promotion Officer of Orion are well aware about their liking. The low standard deviation (.85714) among the respondents’ response reveals that the reliability of mean and maximum doctors think that the Medical Promotion Officer of Orion are not well aware about their liking. From the frequency table we can see 48% of the doctors think that the Medical Promotion Officers of Orion are well aware of their liking. Only 10% doctors think that Medical Promotion Officer are not well aware their likings. Therefore the overall rating of doctors is “The Medical Promotion Officer of Orion is not well aware of their liking.”
Fulfill of requirement:
Table 4.2.3: Frequency Table of Question No. 3
| N | Minimum | Maximum | Mean | Std |
DeviationQ3501.005.003.3200.93547
Table 4.1.3: Frequency Distribution table of question No. 3 (Your personal requirements are seriously addressed by Orion’s Representative.)
| Score | Frequency | Percent | Cumulative Percent | |
| 1.00 | 2 | 4.0 | 4.0 | |
| 2.00 | 7 | 14.0 | 18.0 | |
| 3.00 | 17 | 34.0 | 52.0 | |
| 4.00 | 21 | 42.0 | 94.0 | |
| 5.00 | 3 | 6.0 | 100.0 | |
| Total | 50 | 100.0 | ||
In Likart scale the mean of the response is 3.3200 indicating that the doctors’ believe the Medical Promotion Officers of Orion are normally address their requirement. The low standard deviation (.93547) among the respondents’ response reveals that the reliability of mean. From the frequency table we can see 48% of the doctors think that the Medical Promotion Officers of Orion are address seriously.
But at the same time we find from the above table that 18% of doctor responded that the Medical Promotion Officers are not fulfilling their needs properly.
Informal relation with doctors:
Table 4.2.4: Frequency Table of Question No. 4
| N | Minimum | Maximum | Mean | Std |
DeviationQ4501.005.002.96001.02936
Table 4.1.4: Frequency Distribution table of question No. 4(Orion’s representative maintains relation with you outside your personal.)
| Score | Frequency | Percent | Cumulative Percent | |
| 1.00 | 5 | 10.0 | 10.0 | |
| 2.00 | 11 | 22.0 | 32.0 | |
| 3.00 | 16 | 32.0 | 64.0 | |
| 4.00 | 17 | 34.0 | 98.0 | |
| 5.00 | 1 | 2.0 | 100.0 | |
| Total | 50 | 100.0 | ||
The informal relations of Medical Promotion Officer with the doctors are not very good. In Likart scale the mean of the response is 2.9600 indicating that the doctors’ believe the Medical Promotion Officer of Orion are not maintain relation out their profession.
The high standard deviation (1.02936) indicates that significant doctors believe that they have good informal relation with the Medical Promotion Officer. We find that 36% of doctors believe that they have good informal relation with the Orion’s Medical Promotion Officer.
Duration of sales call:
Table 4.2.5: Frequency Table of Question No. 5
| N | Minimum | Maximum | Mean | Std |
DeviationQ5501.005.003.3000.90914
Table 4.1.5: Frequency Distribution table of question No. 5. (During visit the Representative of Orion takes more time from you.)
| Score | Frequency | Percent | Cumulative Percent | |
| 1.00 | 2 | 4.0 | 4.0 | |
| 2.00 | 6 | 12.0 | 16.0 | |
| 3.00 | 20 | 40.0 | 56.0 | |
| 4.00 | 19 | 38.0 | 94.0 | |
| 5.00 | 3 | 6.0 | 100.0 | |
| Total | 50 | 100.0 | ||
Orion’s Medical Promotion Officers takes more time then average from the doctors while making sales call. In Likart scale the mean of the response is 3.3000 indicating that the doctors’ believe the Medical Promotion Officer of Orion are take more time from the doctors. The low standard deviation (.90914) among the respondents’ response reveals that the reliability of mean and maximum doctors thinks that the Medical Promotion Officer of Orion take more time from the doctors.
Confidence level of Medical Promotion Officer:
Table 4.2.6: Frequency Table of Question No. 6
| N | Minimum | Maximum | Mean | Std |
DeviationQ6501.005.003.5200.78870
Table 4.1.6: Frequency Distribution table of question No. 6 (Confidence of Orion’s representative during detailing is very high.)
| Score | Frequency | Percent | Cumulative Percent | |
| 1.00 | 1 | 2.0 | 2.0 | |
| 2.00 | 5 | 10.0 | 12.0 | |
| 3.00 | 12 | 24.0 | 36.0 | |
| 4.00 | 31 | 62.0 | 98.0 | |
| 5.00 | 1 | 2.0 | 100.0 | |
| Total | 50 | 100.0 | ||
The confidence level of Orion’s Medical Promotion Officer found more then average. In Likart scale the mean of the response is 3.5200 indicating that the doctors’ believe the Medical Promotion Officer of Orion are Confidence during detailing. The low standard deviation (.78870) among the respondents’ response reveals that the reliability of mean. From the frequency table we can see 64% of the doctors think that the Confidence of Orion’s representative during detailing is high. But 12% (6 out of 50) of doctors think that Medical Promotion Officers of Orion are not confident enough.
Detailing skills:
Table 4.2.7: Frequency Table of Question No. 7
| N | Minimum | Maximum | Mean | Std |
deviationQ7501.005.004.1600.95533
Table 4.1.7: Frequency Distribution table of question No. 7 (Orion’s representative is very careful in delivering the message to you.)
| Score | Frequency | Percent | Cumulative Percent | |
| 1.00 | 1 | 2.0 | 2.0 | |
| 2.00 | 1 | 2.0 | 4.0 | |
| 3.00 | 10 | 20.0 | 24.0 | |
| 4.00 | 15 | 30.0 | 54.0 | |
| 5.00 | 23 | 46.0 | 100.0 | |
| Total | 50 | 100.0 | ||
We found Medical Promotion Officer of Orion have very high detailing skills. The mean of doctors rating is 4.16, in detailing that the doctors think the Medical Promotion Officers of Orion detail the products very well during sale call. From the frequency table we can see 76% of the doctors think that the representative of Orion is very careful in delivering the message to the doctors. Only 4% (2out of 50) of doctors disagree that the Orion Medical Promotion Officer are not very careful in delivering the message to the doctors.
Product Knowledge:
Table: 4.2.8: Frequency Table of Question No. 8
| N | Minimum | Maximum | Mean | Std |
DeviationQ8501.005.004.3400.77222
Table 4.1.8: Frequency Distribution table of question No. 8 (The product knowledge of Orion’s Representative is very high.)
| Score | Frequency | Percent | Cumulative Percent | |
| 2.00 | 1 | 2.0 | 2.0 | |
| 3.00 | 6 | 12.0 | 14.0 | |
| 4.00 | 18 | 36.0 | 50.0 | |
| 5.00 | 25 | 50.0 | 100.0 | |
| Total | 50 | 100.0 | ||
According to the doctors rating Orion’s Medical Promotion Officer have very sound knowledge about their products. The doctors rating average regarding Medical Promotion Officer Product Knowledge is 4.34 revel that they agree about the statement “The product knowledge of Orion’s Representative is very high”. From the frequency table we can see 86% of the doctors think that the product knowledge of Orion’s Representative is very high. Only 2% (1out of 50) doctors think that Medical Promotion Officer do not have sufficient product.
Aggressiveness:
Table 4.2.9: Frequency Table of Question No. 9
| N | Minimum | Maximum | Mean | Std. Deviation | |
| Q9 | 50 | 2.00 | 5.00 | 3.5800 | .64175 |
Table 4.1.9: Frequency Distribution table of question No. 9 (The Representative of Orion is very assertive to get prescription from you.)
| Score | Frequency | Percent | Cumulative Percent | |
| 2.00 | 2 | 4.0 | 4.0 | |
| 3.00 | 19 | 38.0 | 42.0 | |
| 4.00 | 27 | 54.0 | 96.0 | |
| 5.00 | 2 | 4.0 | 100.0 | |
| Total | 50 | 100.0 | ||
Orion Medical Promotion Officers are quite aggressive in their job. In Likart scale the mean of the doctors’ response is 3.5800 indicating that the doctors’ believe the Orion’s Medical Promotion Officer are assertive to get prescription from the doctors. The low standard deviation (.64175) among the respondents’ response reveals that the reliability of mean. From the frequency table we can see 58% of the doctors think that the Orion’s representative is very assertive to get prescription from the doctors. Only 4% (2 out of 50) doctors think that Medical Promotion Officer are not very much aggressive.
Technical Service:
Table 4.2.10: Frequency Table of Question No. 10
N | Minimum | Maximum | Mean | Std. Deviation | |
| Q10 | 50 | 1.00 | 5.00 | 3.1800 | 1.00387 |
Table 4.1.10: Frequency Distribution table of question No.10 (Orion’s Representative is very serious to the reference of your query.)
| Score | Frequency | Percent | Cumulative Percent | |
| 1.00 | 3 | 6.0 | 6.0 | |
| 2.00 | 9 | 18.0 | 24.0 | |
| 3.00 | 17 | 34.0 | 58.0 | |
| 4.00 | 18 | 36.0 | 94.0 | |
| 5.00 | 3 | 6.0 | 100.0 | |
| Total | 50 | 100.0 | ||
In providing doctors reference Orion Medical Promotion Officer are bit better then average. 42% doctors respondent that Orion Medical Promotion Officer provide the reference on their queries promptly. But at the same time 24% of the doctors told that Orion Medical Promotion Officer do not very serious about providing the reference they as kind for.
FINDINGS ANALYSIS AND INTERPRETATION
Chemist coverage:
Table 4.2.11: Frequency Table of Question No. 1
N | Minimum | Maximum | Mean | Std. Deviation | |
| Q1 | 50 | 1.00 | 5.00 | 4.4200 | 1.07076 |
Table 4.1.11: Frequency Distribution table of question No.1 (Visit frequency of Orion’s Representative is satisfactory.)
| Score | Frequency | Percent | Cumulative Percent | |
| 2.00 | 3 | 6.0 | 6.0 | |
| 3.00 | 3 | 6.0 | 12.0 | |
| 4.00 | 6 | 12.0 | 24.0 | |
| 5.00 | 38 | 76.0 | 100.0 | |
| Total | 50 | 100.0 | ||
Orion Medical Promotion Officers have very good chemist coverage. In our survey we found 88% of chemists were satisfied with the frequency of visit by Orion Medical Promotion Officer. In Likart scale the mean of the chemist response in Q 1 (Visit frequency of Orion’s Representative is satisfactory) is 4.4200 indicating that the Chemists’ believe the Orion’s Medical Promotion Officer Visits frequency is satisfactory.
Relationship with chemist:
Table 4.2.12: Frequency Table of Question No. 2
N | Minimum | Maximum | Mean | Std. Deviation | |
| Q2 | 50 | 2.00 | 5.00 | 4.5800 | .85928 |
Table 4.1.12: Frequency Distribution table of question No. 2 (Orion’s Representative communicates very heartily to you.)
| Score | Frequency | Percent | Cumulative Percent | |
| 1.00 | 3 | 6.0 | 6.0 | |
| 2.00 | 1 | 2.0 | 8.0 | |
| 3.00 | 1 | 2.0 | 10.0 | |
| 4.00 | 12 | 24.0 | 34.0 | |
| 5.00 | 33 | 66.0 | 100.0 | |
| Total | 50 | 100.0 | ||
Orion Medical Promotion Officer maintains a very good relationship with their chemists. 90% chemists’ responded that Medical Promotion Officers are very communicative and cordial. In Likart scale the mean of the chemist response in Q 2(Orion’s Representative communicates very heartily to you.) is 4.5800 indicating that the Chemists’ believe the Orion’s Representatives communicates very heartily to the chemists.
Order booking skills:
Table 4.2.13: Frequency Table of Question No. 3
N | Minimum | Maximum | Mean | Std. Deviation | |
| Q9 | 50 | 1.00 | 5.00 | 4.2800 | .94847 |
Table 4.1.13: Frequency Distribution table of question No.3 (While taking order Orion’s Representative enter into your shop.)
| Score | Frequency | Percent | Cumulative Percent | |
| 1.00 | 1 | 2.0 | 2.0 | |
| 2.00 | 3 | 6.0 | 8.0 | |
| 3.00 | 2 | 4.0 | 12.0 | |
| 4.00 | 19 | 38.0 | 50.0 | |
| 5.00 | 25 | 50.0 | 100.0 | |
| Total | 50 | 100.0 | ||
The order booking skills of Orion Medical Promotion Officer are very good. The mean of the response of question No 3: (While taking order Orion’s Representative enter into your shop.) is revealed that the Medical Promotion Officer have very good skills on order booking. 88% of chemists responded that Orion’s Medical Promotion Officer book order in a very systemic way (alphabetic order).
Chemist Promotion:
Table 4.2.14: Frequency Table of Question No. 4
N | Minimum | Maximum | Mean | Std. Deviation | |
| Q4 | 50 | 1.00 | 5.00 | 3.2400 | 1.18769 |
Table 4.1.14: Frequency Distribution table of question No.4 (Chemist’s gifts are offered very cordially by Orion’s representative.)
| Score | Frequency | Percent | Cumulative Percent | |
| 1.00 | 3 | 6.0 | 6.0 | |
| 2.00 | 13 | 26.0 | 32.0 | |
| 3.00 | 11 | 22.0 | 54.0 | |
| 4.00 | 15 | 30.0 | 84.0 | |
| 5.00 | 8 | 16.0 | 100.0 | |
| Total | 50 | 100.0 | ||
We found Orion has an average promotion in chemist front. 46% chemists responded that Orion Medical Promotion Officer Offer gift to them very cordially while a significant percentage (32%) responded reversely. In Likart scale the mean of the chemists response is 3.2400 indicating that the Chemists’ believe the Orion’s Medical Promotion Officer offer few chemist’s gifts very cordially. So there is a lot of scope to develop the chemist’s promotion.
Policy on damage product:
Table 4.2.15: Frequency Table of Question No. 5
N | Minimum | Maximum | Mean | Std. Deviation | |
| Q5 | 50 | 1.00 | 5.00 | 3.1600 | 1.25129 |
Table 4.1.15: Frequency Distribution table of question No. 5 (Orion’s Representative is very serious to return the damage products.)
| Score | Frequency | Percent | Cumulative Percent | |
| 1.00 | 3 | 6.0 | 6.0 | |
| 2.00 | 16 | 32.0 | 38.0 | |
| 3.00 | 11 | 22.0 | 60.0 | |
| 4.00 | 10 | 20.0 | 80.0 | |
| 5.00 | 10 | 20.0 | 100.0 | |
| Total | 50 | 100.0 | ||
We found a mixed response from chemist about the damaged product return policy of Orion. 40% of chemists told that Medical Promotion Officers are very serious on damage product while 36% of chemist responded reversely. In Likart scale the mean of the chemist response in Q (Orion’s Representative is very serious to return the damage products.) is 3.1600 indicating that the Chemists’ believe the Orion’s Medical Promotion Officer are not serious to return the damage products. There is a lot of scope to increase the return the damage products. The Orion’s Representatives have a chance to be more serious to return the damage products.
Commitment to the customer:
Table 4.2.16: Frequency Table of Question No. 6
N | Minimum | Maximum | Mean | Std. Deviation | |
| Q6 | 50 | 1.00 | 5.00 | 3.6400 | 1.04511 |
Table 4.1.16: Frequency Distribution table of question No.6 (Commitment is maintained very seriously by Orion’s representative.)
| Score | Frequency | Percent | Cumulative Percent | |
| 1.00 | 3 | 6.0 | 6.0 | |
| 2.00 | 4 | 8.0 | 14.0 | |
| 3.00 | 9 | 18.0 | 32.0 | |
| 4.00 | 26 | 52.0 | 84.0 | |
| 5.00 | 8 | 16.0 | 100.0 | |
| Total | 50 | 100.0 | ||
We found Orion has maintained the commitment of the customer. In our survey we found 68% of chemists think that the Orion’s Representatives maintain their commitment very seriously. In Likart scale the mean of the response in Q 6(Commitment is maintained very seriously by Orion’s representative) is 3.6400 indicating that the Chemists’ believe the Orion’s Medical Promotion Officer are try to maintain their commitment very seriously.
So there is a lot of scope to maintain their commitment. The Orion’s Representatives have a chance to maintain their commitment very seriously.
Commitment to the customer:
Table 4.2.17: Frequency Table of Question No. 7
N | Minimum | Maximum | Mean | Std. Deviation | |
| Q7 | 50 | 1.00 | 5.00 | 4.4200 | .94954 |
Table 4.1.17: Frequency Distribution table of question No. 7 (Orion’s representative takes order very seriously in alphabetic order from you.)
| Score | Frequency | Percent | Cumulative Percent | |
| 1.00 | 2 | 4.0 | 4.0 | |
| 2.00 | 1 | 2.0 | 6.0 | |
| 3.00 | 1 | 2.0 | 8.0 | |
| 4.00 | 16 | 32.0 | 40.0 | |
| 5.00 | 30 | 60.0 | 100.0 | |
| Total | 50 | 100.0 | ||
The order booking skills of Orion Medical Promotion Officer are very good. The mean of the response of question No 7: (Orion’s representative takes order very seriously in alphabetic order from you) revealed that the Medical Promotion Officers have very good skills on order booking. 92% of chemists responded that Orion’s Medical Promotion Officer Book order in a very systemic way.
Seriousness about product expiry:
Table 4.2.18: Frequency Table of Question No. 8
N | Minimum | Maximum | Mean | Std. Deviation | |
| Q8 | 50 | 1.00 | 5.00 | 3.7400 | 1.12141 |
Table 4.1.18: Frequency Distribution table of question No.8 (The expiry date of products is checked very often by Orion’s representative).
| Score | Frequency | Percent | Cumulative Percent | |
| 1.00 | 1 | 2.0 | 2.0 | |
| 2.00 | 8 | 16.0 | 18.0 | |
| 3.00 | 9 | 18.0 | 36.0 | |
| 4.00 | 17 | 34.0 | 70.0 | |
| 5.00 | 15 | 30.0 | 100.0 | |
| Total | 50 | 100.0 | ||
Orion’s Medical Promotion Officers are quite serious about the product expiry and shelving out of the product from the chemists shelves. But at the same time the high standard deviation indicate that still some chemist believe that Medical Promotion Officer are not very serious about expiry date of the products.
Prescription survey:
Table 4.2.19: Frequency Table of Question No. 9
N | Minimum | Maximum | Mean | Std. Deviation | |
| Q9 | 50 | 1.00 | 5.00 | 4.2800 | .94847 |
Table 4.1.19: Frequency Distribution table of question No.9 (Prescription is surveyed very frequently by the Orion’s Representative.)
| Score | Frequency | Percent | Cumulative Percent | |
| 1.00 | 1 | 2.0 | 2.0 | |
| 2.00 | 3 | 6.0 | 8.0 | |
| 3.00 | 2 | 4.0 | 12.0 | |
| 4.00 | 19 | 38.0 | 50.0 | |
| 5.00 | 25 | 50.0 | 100.0 | |
| Total | 50 | 100.0 | ||
Orion’s Medical Promotion Officers are very aggressive in prescription generation and survey. The mean of the response in question No 9(Prescription is surveyed very frequently by the Orion’s Representative) is 4.2 indicating that Medical Promotion Officer are serving prescription very frequently. 88% of the chemists responded that Medical Promotion Officer of Orion surveyed prescription very frequently in front of their shops. This indicates that the Medical Promotion Officers are very aggressive on prescription.
10. OTC Sales:
Table 4.2.4: Frequency Table of Question No. 10
N | Minimum | Maximum | Mean | Std. Deviation | |
| Q10 | 50 | 1.00 | 5.00 | 3.8800 | 1.20611 |
Table 4.1.20: Frequency Distribution table of question No.10 (Orion’s Representative is very assertive to pursue the OTC products).
| Score | Frequency | Percent | Cumulative Percent | |
| 1.00 | 3 | 6.0 | 6.0 | |
| 2.00 | 6 | 12.0 | 18.0 | |
| 3.00 | 3 | 6.0 | 24.0 | |
| 4.00 | 20 | 40.0 | 64.0 | |
| 5.00 | 18 | 36.0 | 100.0 | |
| Total | 50 | 100.0 | ||
Orion Medical Promotion Officers are quite good to purpose OTC product to chemist shelve. Although Orion offer special price for OTC product in very few cause, bent with the help of good relation with chemists Orion’s Medical Promotion Officer could manage the order of OTC products from chemists.
CONCLUSION:
From the interpretation of collected data, we have found the following good things which should be continued:
- The relation of Medical Promotion Officer of Orion with doctors seems to be very good. We can see 96% of the doctors think that the Medical Promotion Officer of Orion is very cordial.
- Orion’s Medical Promotion Officer could take more time then average from the doctors while making sales call. These indicate that they have a good rapport with the doctors compared to the average.
- From the frequency table we can see doctors think that the Confidence of Orion’s representative during detailing is high. We found Medical Promotion Officer of Orion have very high detailing skills.
- From the frequency table we can see doctors think that the representative of Orion is very careful in delivering the message to the doctors.
- Orion’s Medical Promotion Officers are quite aggressive in their job. From the frequency table we can see doctors think that the Orion’s representative is very assertive to get prescription from the doctors.
- rvey we found 88% of chemists were satisfied with the frequency of visit by Orion Medical Promotion Officer.
- Orion’s Medical Promotion Officer maintains a very good relationship with their chemists. Most of the chemists’ responded that Medical Promotion Officers are very communicative and cordial.
- The order booking skills of Orion’s Medical Promotion Officer are very good. Orion’s Medical Promotion Officer Book order in a very systemic way (alphabetic order).
- Orion’s Medical Promotion Officers are very aggressive in prescription generation and survey. 88% of the chemists responded that Medical Promotion Officer of Orion surveyed prescription very frequently in front of their shops.
- Orion’s Medical Promotion Officers are quite good to purpose OTC product to chemist shelve.
There are some areas where Medical Promotion Officers of Orion have very good opportunity for improvements.
These are:
- The informal relation with the doctors should be developed more.
- The reference papers or other related requirements should be fulfilled more promptly..
- Chemists gifts should be increased a bit more to build the relationship with chemist stronger.
- Damage and Data expired product should be replaced immediately to the chemists.
Finally we can say the representatives have to make friendship relation with the doctors and the chemists to develop the pharmaceutical marketing.
