Growth Performance
Tree effect
Plant height of tomato was significantly influenced by different tree species irrespective of days after transplant (DAT). Tomato plants cultivated under tree grew more vigorously than those grew in the open field. Significantly the tallest plant height (32.50, 62.17 and 77.25 cm) was observed under O. europea based agroforestry system at 30, 60 days and at harvest time respectively. No significant variation was found when tomato cultivated under M. indica based agroforestry system irrespective of days after transplant (30, 60 days and at harvest time). The shortest plant height was recorded in the control tomato plot in all sampling dates (25.42, 45.75 and 56.08 cm at 30, 60 days and at harvest time respectively) which was statistically similar to tomato cultivated under C. acuminata based agroforestry system. Significant variation was found when tomato cultivated under P. guajava based agroforestry system (53.85 and 66.74 cm at 60 days and at harvest time respectively) as compared to O. europea. Plant grew under tree was found to be more epically dominant than those grew under full sunlight resulting taller plant under shade (Hillman, 1984). Ali (1999) also found significant results with the tallest plant under shaded condition in okra.
Distance effect
Plant height of tomato was not significantly influenced by the effect of distance from tree base at 30 day after transplant . Numerically the tallest plant height (31.00 cm) was observed at D1 distance which was statistically similar to the D2 (29.33 cm), D3 (28.00 cm) and D4 (28.27 cm) distances. Significantly the tallest plant height of tomato was observed at D1 distance irrespective of all sampling dates (31.00, 54.33 and 68.20 cm at 30, 60 days and at harvest time respectively). The shortest plant height of tomato was recorded at D4 distance (28.27, 45.53 and 53.47 cm at 30, 60 days and at harvest time respectively). No significant variation was recorded when tomato cultivation at D3 and D2 distances from tree base at 60 days after transplant. A significant variation was found when tomato cultivated at D2 and D3 distance from tree base at harvest time. However, height of the tomato plant increases with decrease of distance from tree base. Above ground competition for light and below ground competition for nutrient and soil were the evident, based on tomato height from shaded rows to near tree rows. Coffee plants in agroforestry system had higher plant height than plants in monoculture system (Monica et al., 2004).
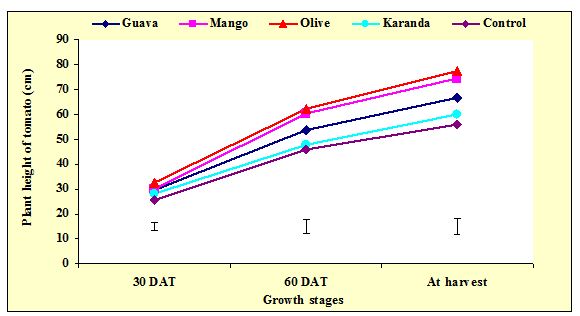
Figure Plant height of tomato at different growth stage affected as a function of associated tree species
The combined effect of tree species and distance from tree base
The combined effect of tree species and distance from tree base on the plant height of tomato clearly stated that all the treatment combination significantly influenced the plant height irrespective of sampling dates (Table 2).
Under O. europea species, D1 distance produced significantly the highest plant (38.67, 65.00 and 76.00 cm) at 30, 60 days and at harvest time respectively which was followed by D2 distance under the same tree species and recorded transplanting dates. Significantly the shortest plant of tomato ( 22.67 cm) was recorded at D3 distance at 30 DAT under control treatment; but at 60 and at harvest time significantly the shortest plant height of tomato was found at D4 distance under the same treatment and the value were 43.00 and 51.33 cm respectively.
Table 2: Combined effect between associated tree species and distance from tree base on plant height of tomato
Tree species | Distance from tree base | Plant Height (cm) | ||
30 DAT | 60 DAT | At harvest | ||
P. guajava | D1(0.5) | 30.33 bc | 47.00 bc | 65.00 bc |
D2(1.0) | 30.33 bc | 47.67 bc | 61.33 b-e | |
D3(1.5) | 28.67 bc | 47.33 bc | 61.00 b-e | |
D4(2.0) | 29.33 bc | 49.00 bc | 59.67 c-e | |
M. indica | D1(0.5) | 27.33 cd | 49.00 bc | 65.67 bc |
D2(1.0) | 28.00 bc | 47.33 bc | 65.00 bc | |
D3(1.5) | 29.00 bc | 49.33 bc | 64.67 b-d | |
D4(2.0) | 28.67 bc | 50.33 b | 60.33 c-e | |
O. europea | D1(0.5) | 38.67 a | 65.00 a | 76.00 a |
D2(1.0) | 31.33 b | 50.33 b | 68.67 b | |
D3(1.5) | 30.67 bc | 50.67 b | 65.00 bc | |
D4(2.0) | 30.30 bc | 47.33 bc | 64.00 b-d | |
C. acuminata | D1(0.5) | 29.00 bc | 43.00 c | 58.33 c-f |
D2(1.0) | 28.67 bc | 46.33 bc | 57.00 d-g | |
D3(1.5) | 30.67 bc | 48.67 bc | 55.33 e-g | |
D4(2.0) | 30.33 bc | 45.67 b | 55.00 e-g | |
Control | D1(0.5) | 27.00 cd | 48.33 bc | 50.33 g |
D2(1.0) | 27.67 b-d | 46.67 bc | 50.00 g | |
D3(1.5) | 22.67 e | 45.00 bc | 58.67 c-f | |
D4(2.0) | 24.33 de | 43.00 c | 51.33 fg | |
| CV(%) | – | 6.48 | 7.16 | 6.58 |
| LSD | – | 5.73 | 5.73 | 6.61 |
Plant duration
Tree effect
Plant duration of tomato increased significantly with reducing light condition under agroforestry systems . Significantly the highest days to 50% flowering was recorded (53.55 days) under O. europea based agroforestry system whereas the lowest days to 50% flowering was observed under control treatment (44.08 days). There was no significant variation of days to 50% flowering was recorded under M. indica (50.33 days), P. guajava (50.25 days) and C. acuminata (47.83 days) based agroforestry systems.
Among the tree species, the highest (51.12 days) days to fruit setting of tomato was observed under O. europea based agroforestry system which was followed by M. indica (47.83 days). Significantly the lowest (42.00 days) days to fruit setting of tomato was observed under control treatment which was statistically similar to C. acuminata (43.08 days) and P. guajava (44.25 days) based agroforestry systems. Tomato plants grew under O. europea based system exhibited less light which delayed its flowering time. Therefore, the reproductive period was longer under reduced light level compared to full sunlight. Similar finding was reported by Buge et al., (1987).
Remarkable variation in fruit development phase was observed under different tree species Fruit development phase was the longest (39.25 days) when tomato cultivated under O. europea based agroforestry system and the shortest (32.00 days) was recorded under control treatment which was followed by C. acuminata (32.58 days). Statisticall significant differences were not observed of fruit development phase when tomato cultivated under P. guajava (36.42 days) and M. indica (36.42 days) based agroforestry systems. The longer crop duration at individual agroforestry system under reduced light (O. europea followed by M. indica, P. guajava and C. acuminata), contributed to the longer crop duration (143.92 days) by enhancing the post anthesis growth phase. Significantly the shortest (118.10 days) total crop duration was found under control treatment.
Distance effect
Plant duration as a function of distance from tree base was observed under four distinctive distances i.e. D1 (0.5 m), D2 (1.0 m), D3 (1.5 m) and D4 (2.0 m) from tree base . Days to 50% flowering, days to fruit setting and fruit development phase were not affected due to distance planting. This is may be due to flower initiation and fruit development of tomato was governed by sunlight provided water is not limited. Similarly total crop duration was not affected as a function of distance from tree base. Vegetable duration of Telfairia occidentalis grown at various distance (3, 4, 5 and 6m) from a row of M. indica species, remained unaffected (Emebiri and Nwufo, 1994).
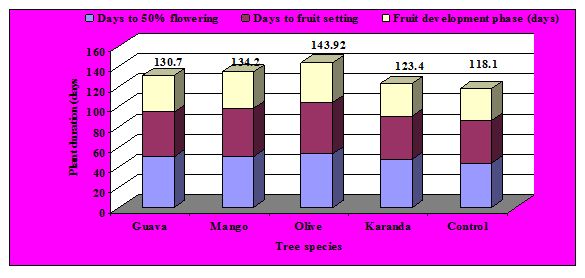
Figure 4.1. Graphical representation of the duration of different growth stage of tomato affected as a function of associated tree species
The combined effect between associated tree species and distance from tree base
Plant duration of tomato was significantly influenced by the combined effect of tree species and distance from tree base (Table 3). However, examination of mean plant duration at various distance from tree base indicated no specific trend in relation to distance. The highest days to 50% flowing was observed (59.67 days) at D2 distance which was followed by D1 (56.00 days), D3 (56.00 days) and D4 (55.33 days) distances under O. europea based agroforestry system. Days to 50% flowering were almost statistically similar when tomato cultivation under M. indica and P. guajava tree irrespective of distances. Significantly the lowest (43.33 days) days to 50% flowering was observed under control treatment at D2 distance which was statistically similar to D1 (45.00), D3 (43.33) and D4 (43.67) distance under the same treatment.
Days to fruit setting increased significantly with different agroforestry systems (Table. 2). The highest (59.33 days) days to fruit setting was recorded under O. europea species at D1 distance and the lowest was recoded (40.67 days) when tomato cultivation under control treatment at D2 distance.
Remarkable variation in fruit development period was observed in different combinations . Fruit development period was the shortest under full sunlight and the values were 30.33, 30.67, 33.00 and 34.00 days at D4 D3, D1 and D2 respectively. Statistically similar results were found when tomato cultivation under C. acuminata tree (low shade level). The longest fruit development period was (43.00 days) recorded when tomato cultivation under O. europea species at D1 distances. D2, D3 and D4 distances recorded statistically similar fruit development period and the values were 43.00, 40.33, 39.33 and 39.67 days, respectively.
In case of total crop duration, the highest (156.70) value was recorded under O. europea species at D1 distance. Total crop duration under the same tree was 147.00, 146.70, and 147.70 days respectively at D2, D3 and D4 distances and were statistically significant. The lowest (114.70 days) total crop duration was observed at D3 distance under control treatment.
Table 3: Combined effect between associated tree species X distance from tree base on plant duration at different growth stage of tomato
Tree species | Distance from tree base | Plant duration (days) | |||
Days to 50% flowering | Days to fruit setting | Fruit development phase (days) | Total crop duration (days) | ||
P. guajava | D1(0.5) | 50.33 cd | 44.00 f-i | 36.67 d-f | 126.70 de |
D2(1.0) | 49.00 cd | 46.67 e-g | 35.67 e-g | 132.00 cd | |
D3(1.5) | 50.00 cd | 44.33 f-i | 38.00 b-e | 132.30 cd | |
D4(2.0) | 51.67 c | 42.00 i | 35.33 e-g | 131.70 cd | |
M. indica | D1(0.5) | 48.67 c-e | 48.67 c-e | 36.67 d-f | 134.00 c |
D2(1.0) | 51.00 c | 48.67 c-e | 37.00 c-e | 135.00 c | |
D3(1.5) | 50.67 cd | 47.67 d-f | 36.00 ef | 134.30 c | |
D4(2.0) | 51.00 c | 46.33 e-h | 36.00 ef | 133.30 c | |
O. europea | D1(0.5) | 56.00 b | 59.33 a | 43.00 a | 156.70 a |
D2(1.0) | 59.67 a | 52.67 b | 40.33 b | 147.00 b | |
D3(1.5) | 56.00 b | 50.67 b-d | 39.33 b-d | 146.70 b | |
D4(2.0) | 55.33 b | 52.00 bc | 39.67 bc | 147.70 b | |
C. acuminata | D1(0.5) | 50.33 cd | 43.33 g-i | 32.33 hi | 126.00 d-f |
D2(1.0) | 48.67 c-e | 42.67 hi | 32.00 hi | 122.70 ef | |
D3(1.5) | 47.00 d-f | 44.00 f-i | 33.00 g-i | 124.00 ef | |
D4(2.0) | 45.33 e-g | 42.33 i | 33.00 g-i | 121.00 e-g | |
Control | D1(0.5) | 45.00 fg | 41.67 i | 33.00 g-i | 119.70 fgh |
D2(1.0) | 44.33 fg | 40.67 i | 34.00 f-h | 123.00 ef | |
D3(1.5) | 43.33 g | 41.33 i | 30.67 i | 114.70 h | |
D4(2.0) | 43.67 fg | 44.00 f-i | 30.33 i | 115.00 gh | |
| CV(%) | – | 3.87 | 4.46 | 4.26 | 2.66 |
| LSD | – | 3.19 | 3.41 | 2.51 | 5.77 |
SPAD (Soil Plant Analysis development)
Tree effect
The chlorophyll meter or SPAD meter is a simple portable diagnostic tool that measures the greenness or relative chlorophyll content of leaves (Kariya et al., 1982). SPAD readings indicate plant nitrogen status and the amount of nitrogen to be applied are determined by the physiological nitrogen requirement of tomato at different growth stages. The mean SPAD values among the treatment revealed that tomato cultivation under O. europea tree accounted for the highest value (31.91) followed by M. indica (31.05), P. guajava (30.98) and C. acuminata (30.59) at 30 days after transplant. Significantly the lowest SPAD value (28.22) was recorded when tomato cultivation in open field full sunlight .
SPAD reading at 60 days after transplant (DAT) showed considerably highest SPAD reading at flowering stage of tomato. The SPAD reading among the treatment revealed the tomato cultivation under O. europea based agroforestry system accounted for the highest value (49.55) followed by M. indica (46.79), P. guajava ( 46.60) and C. acuminata (46.12) at 60 days after transplant. Tomato cultivation under open field recorded lowest SPAD value (41.63) at flowering. Several workers reported higher productivity of rice at 42.41 SPAD reading (Panaullah et al., 1999 and Islam et al., 1998).
The SPAD value of individual treatment at harvest showed same trend as compared to at 30 and 60 DAT but the lowest as compared to 60 DAT. Tomato cultivation under O. europea based agroforestry system accounted for the highest value (42.58) followed by M. indica (40.02), P. guajava (40.01) and C. acuminata (38.51). Significantly the lowest SPAD value (37.78) of tomato at harvest time was recorded when tomato cultivation in full sunlight.
Distance effect
SPAD value of tomato at various days after transplant (DAT) as a function of distance from tree base did not differ significantly . At 30 days after transplant, the highest SPAD value (31.89) was recorded when tomato cultivation at D1 distance closed to tree base and the lowest SPAD value (28.55) was recorded at D4 distance from tree base. At 60 days after transplant, the highest SPAD value of tomato (48.99) was recorded at D1 distance and the lowest value (44.53) was recorded form D4 distance. Similar trend of SPAD value of tomato was found at harvest stage. Among the distance, the highest SPAD value was recorded at D1 distance and the lowest value was obtained at D4 distance irrespective of days after transplant.
The combined effect of associated tree species and distance from tree base
SPAD value of tomato was significantly affected by the combined effect of tree species and distance from tree base (Table. 4). Among the treatments /tree species, SPAD value of tomato grown under O. europea species recorded highest followed by M. indica, P. guajava, C. acuminata and control treatments irrespective of days after transplant. When distance takes into consideration, D1 distance showed highest SPAD value (36.63) followed by D2 (33.70), D3, (30.47) and D4 (29.33) distance at 30 days after transplant. Oppositely SPAD value of tomato was the lowest in control treatment and within this treatment D4 and D3 distance recorded lowest SPAD value of 22.23 and 24.20 followed by D2 (29.80) and D1 ( 31.97) distances at the same day after transplant.
At 60 days after transplant, the highest SPAD value of tomato was recorded under O. europea tree. Within this treatment, D1 distance produced the highest SPAD value of 58.67 followed by D2, D4 and D3 distances. Significantly the lowest (43.07) SPAD value of tomato was recorded at D4 distance followed by D3, D2 and D1 distance at 60 days after transplant under control treatment.
At harvest stage, the highest (47.03) SPAD value of tomato was recorded at D1 distance under O. europea based agroforestry system and the lowest SPAD value of tomato (38.06) was recorded when tomato cultivation at D4 distance under full sunlight. Tomato cultivation showed significantly higher photosynthetic rate corresponding higher SPAD value in higher nutrient level at flowing stage (60 days after transplant). Same result was found by Panaulah et al., (1999) in rice.
Table 4: Combined effect between associated tree species and distance from tree base on
SPAD value at tomato field
Tree species | Distance from tree base | SPAD value (at 30 DAT) | SPAD value (at 60 DAT) | SPAD value (at harvest) |
P. guajava | D1(0.5) | 31.40 bc | 45.77 c-e | 39.00 de |
D2(1.0) | 31.93 bc | 45.37 c-e | 39.65 c-e | |
D3(1.5) | 30.60 bc | 44.73 c-e | 39.98 c-e | |
D4(2.0) | 30.60 bc | 43.70 c-e | 39.25 de | |
M. indica | D1(0.5) | 32.13 bc | 47.90 bc | 41.17 b-e |
D2(1.0) | 30.70 bc | 45.70 c-e | 40.34 c-e | |
D3(1.5) | 31.97 bc | 46.33 cd | 37.87 de | |
D4(2.0) | 29.40 c | 45.77 c-e | 36.20 e | |
O. europea | D1(0.5) | 36.63 a | 58.67 a | 47.03 a |
D2(1.0) | 33.70 ab | 52.60 b | 45.66 ab | |
D3(1.5) | 30.47 bc | 47.00 cd | 44.07 a-c | |
D4(2.0) | 29.33 c | 47.03 c | 42.60 a-d | |
C. acuminata | D1(0.5) | 32.87 bc | 46.83 cd | 38.47 de |
D2(1.0) | 31.67 bc | 42.67 c-e | 36.83 e | |
D3(1.5) | 29.53 bc | 40.87 de | 38.12 de | |
D4(2.0) | 29.87 bc | 39.93 e | 37.70 de | |
Control | D1(0.5) | 31.97 bc | 46.60 cd | 38.22 de |
D2(1.0) | 29.80 bc | 46.40 cd | 36.63 e | |
D3(1.5) | 24.20 d | 45.83 c-e | 38.76 de | |
D4(2.0) | 22.23 d | 43.07 c-e | 38.06 de | |
| CV(%) | – | 7.03 | 6.71 | 6.39 |
| LSD | – | 3.54 | 5.12 | 4.20 |
Yield performance
Cluster per plant
Tree effect
The highest (6.17) number of cluster per plant was recorded when tomato cultivation under full sunlightwhich was followed by M. indica based agroforestry system (5.95) and that was statistically similar to O. europea based agroforestry system (5.54). Significantly the lowest (4.85) number of cluster per plant was recorded when tomato cultivation under P. guajava based agroforestry system. Diffuse light under agroforestry systems promotes the development of vegetative structures while intense light favors the development of flowers, fruits and seeds (Weaver and Clements, 1973))
Distance effect
Number of cluster per plant of tomato was significantly influenced by the effect of distance from tree base . The highest (5.91) number of cluster per plant was recorded when tomato cultivation at D4 distance which was followed by D3 (6.16) and D2 (5.53) distances. Significantly the lowest (4.41) number of cluster per plant was recorded when tomato cultivation at D1 distance closest to tree base. Shade created by tree canopy on the tomato plant influenced its reproductive phase may be the cause of lower number of cluster per plant
Fruit per cluster
Tree effect
Number of fruit per cluster gradually decreased with the increase of canopy coverage (Appendix Table 12). The highest number of fruit per cluster (3.24) was recorded when tomato grown under full sunlight which was followed by C. acuminata (3.10). Significantly the lowest number of cluster per plant was recorded under O. europea tree (2.52) which was statistically similar to M. indica (2.54) and P. guajava (2.70) based agroforestry system .
Distance effect
Number of cluster per plant of tomato was significantly influenced by distance from tree base ). The highest (2.99) number of cluster per plant was recorded when tomato cultivation at D4 distance which was statistically similar to D3 (2.87) distance. Significantly the lowest number of fruit per cluster (2.69) was recorded when tomato cultivation at closest distance from tree base that was statistically similar to D2 (2.74) distance.
Fruit per plant
Tree effect
Different fruit tree based agroforestry systems were significantly influenced the fruit per plant of tomato. The highest (20.39 fruits/plant) number of fruits per plant was recorded when tomato cultivation under full sunlight and the lowest (15.32 fruits/plant) number of fruits per plant was obtained from O. europea tree based agroforestry system which was statistically similar to M. indica (15.75 fruits/plant) and P. guajava (15.74 fruits/plant) based agroforestry system.
Distance effect
Number of fruits per plant of tomato was less influenced by effect of distance . Statistically similar number of tomatoes per plant was found at D2 (16.85 fruits/plant) and D3 (17.47 fruits/plant) distances respectively. Whereas D4 distance produced the highest (18.22 fruits/plant) and D1 distance the lowest (13.81 fruits/plant) number of fruit per plant.
Fruit diameter
Tree effect
Fruit diameter of tomato was influenced significantly by different light levels and canopy spread . Significantly the highest (59.33 cm) fruit diameter of tomato was recorded when tomato cultivation under open field; which was statistically similar to C. acuminata (58.75 cm), P. guajava (57.00 cm) and M. indica (54.67 cm) based agroforestry systems. The lowest fruit diameter of tomato (54.00 cm) was recorded under O. europea based agroforestry system. The lower fruit diameter under O. europea species may be due to deep shade with lower mobilization of reserve assimilates to reproductive organs. Similar finding in case of mungbean was also reported by Ali (1998) and Islam et al., (1993).
Distance effect
Fruit diameter of tomato was less significantly influenced by distance from tree base . The highest (59.20 cm) fruit diameter of tomato was recorded at D4 distance that was followed by D4 (58.33 cm) and D3 (57.73 cm) distances. Significantly the lowest (51.73 cm) fruit diameter of tomato was recorded when it was cultivated at closest distance (D1) from tree base.
Single fruit weight
Tree effect
Single fruit weight of tomato decreased with increasing light levels and canopy spread . The single fruit weight of tomato varied insignificantly when it was cultivated under full sunlight and C. acuminata based agroforestry system. While it was varied under other agroforestry systems. The highest single fruit weight (79.67 g) was observed when tomato cultivated under full sunlight which was closely followed by C. acuminata (75.65 g) whereas under O. europea species tomato obtained the lowest (55.04 g) single fruit weight.
Distance effect
Single fruit weight of tomato insignificantly influenced by increasing distance from tree base . The highest (68.89 g) single fruit weight of tomato was recorded at D4 distance which was closely followed by D3 (67.66 g), D2 (66.36 g) and D1 (64.05 g) distances.
Yield
Tree effect
Tomato yield per hectare was also significantly influenced by different tree effect and various canopy spread . The trend of yield per hectare was almost similar to that of number of fruit per plant. Among five treatments, the highest (58.96 t/ha) yield of tomato was recorded under control treatment which was followed by C. acuminata (51.84 t/ha) and P. guajava (46.78 t/ha). Significantly the lowest (35.87 t/ha) yield per hectare was recorded under O. europea based agroforestry system. Almost similar result was found by Miah (2001) who found the highest yield of tomato (94.62 t/ha) under 100 percent PAR level Tomato yield was obtained by 50-90 t/ha when it was cultivated as a monocrop (Rashid et at., 2006). As tomato is a light demanding crop, it exhibited more yield in open field where light is not limiting factor and under tree, light shade contributed to more yield than heavy shade where water and nutrient is not limited.
Distance effect
Data on tomato yield as presented on showed that this character was significantly affected by distance from the row of different tree species . However, examination of mean plant performance at the various distance from the tree row (0.5, 1.0, 1.5, and 2.0 m) as mentioned D1, D2, D3 and D4 indicated specific trend in relation to distance. The highest tomato yield of 52.63 t/ha was obtained at D4 distance. Vegetable yield at 1.0 m away from tree row did not differ significantly from the yield at 1.5 m away from the tree row. Significantly the lowest (41.03 t/ha) yield of tomato was recorded at D1 distance. The results suggested that tomato plants may be less adversely affected when grown far from the tree canopy provided light, water nutrient is not limited.
Combined effect of tree species and distance from tree base
Number of cluster per plant was significantly influenced by the combined effect of tree species and distance from tree base (Table 5). The highest number of cluster per plant was recorded when tomato cultivation under full sunlight (control). When distance take into consideration under this treatment, D2 (1.0 m) distance produced the highest (7.27) number of cluster per plant which was statistically identical to that of D3 (6.56) and D4 (6.57) distances. Significantly the lowest (3.19) number of cluster per plant of tomato was recorded under O. europea tree at D1 distance followed by D2 (3.55). Number of fruit per cluster of tomato was greatly affected by the combined effect of tree species and distance from tree base. Significantly the highest (4.05) number of fruit per cluster was recorded at D2 distance followed by D4 (3.46) and D3 (3.43) distances under full sunlight. The lowest number of fruit per cluster (3.17) was recorded at D1 distance under the same treatment.
Significant variation was recorded of number of fruit per plant of tomato. The highest (21.90) number of fruit per plant was recorded at D4 distance under control treatment. Under O. europea based agroforestry system, the lowest (10.95) number of fruit per plant was obtained at D1 distance. D2 (13.22), D3 (13.33) and D4 (14.00) distances produced statistically similar number of fruit per plant as compared to D1 under the same treatment.
The highest (6.40 cm) fruit diameter of tomato was recorded at D2 distance which was statistically similar to D4 (6.07 cm), D1 (6.00 cm) and D3 (6.03 cm) distances under full sunlight. Significantly the lowest (5.00 cm) fruit diameter of tomato was recorded at D1 distance which was statistically identical to that of D4 (5.03), D2 (5.07) and D3 (5.27) distance under O. europea based agroforestry system.
The highest (89.79 g) single fruit weight of tomato was recorded at D4 distance followed by D2 (85.70 g) and D3 (84.68 g) distances under full sunlight. Under O. europea species, the lowest single fruit weight of tomato (51.83 g) was recorded at D1 distance which was statistical identical to that of D2 (53.33 g), D3 (54.11 g) and D4 (57.97 g) distances. Statistically different yield per hectare of tomato was recorded under various tree species which followed the same pattern as like as single fruit weight. The highest yield of tomato by 62.50 ton per hectare was obtained at D2 distance from tree row which was followed by D4 (59.28 t/ha) distance. D1 distance under O. europea species obtained the lowest tomato yield (39.05 t/ha) which was statistically similar to that of D2 (41.72 t/ha) distance.
Tomato harvest at various distance from tree base (0.5, 1.0, 1.5 and 2.0 m) showed that distance increased with increasing yield per hectare because of less shade effect, highest PAR level and maximum water and nutrient availability.
Table 5. Combined effect between associated tree species and distances from tree base on yield and yield contributing characteristics of tomato
| Tree speies | Distance from tree base | Cluster plant-1 | Fruit cluster-1 | Fruit plant-1 | Fruit diameter (cm) | Single fruit weight (g) | Yield (tha-1) |
P. guajava | D1(0.5) | 5.22 e | 2.58 e-g | 16.78 b-d | 5.53 d-h | 61.45 fg | 41.82 fg |
D2(1.0) | 5.33 e | 2.57 e-g | 15.66 c-e | 5.77 b-g | 67.75 ef | 47.05 c-e | |
D3(1.5) | 5.43 de | 2.78 de | 16.40 b-d | 5.80 b-g | 70.71 de | 47.24 c-e | |
D4(2.0) | 5.44 de | 2.83 d | 16.91 b-d | 5.70 c-g | 73.51 c-e | 51.02 bc | |
M. indica | D1(0.5) | 5.56 cde | 2.38 gh | 16.08 b-e | 5.33 f-i | 54.75 gh | 37.96 g |
D2(1.0) | 5.33 e | 2.59 e-g | 15.56 c-e | 5.53 d-h | 57.02 gh | 46.05 e | |
D3(1.5) | 5.44 de | 2.59 e-g | 16.34 b-d | 5.40 e-i | 55.07 gh | 47.30 c-e | |
D4(2.0) | 5.20 e | 2.60 e-g | 14.61 d-f | 5.53 d-h | 61.43 fg | 45.40 ef | |
O. europea | D1(0.5) | 3.19 g | 2.34 h | 10.95 g | 5.00 i | 51.83 h | 39.05 g |
D2(1.0) | 3.55 fg | 2.35 h | 13.22 f | 5.07 hi | 53.33 gh | 41.72 fg | |
D3(1.5) | 4.11 f | 2.45 f-h | 13.33 f | 5.27 g-i | 54.11 gh | 46.47 e | |
D4(2.0) | 5.33 e | 2.57 e-g | 14.00 ef | 5.03 hi | 57.97 gh | 32.16 h | |
C. acuminata | D1(0.5) | 6.00 b-e | 2.68 d-f | 17.11 bc | 5.90 a-e | 68.96 ef | 53.90 b |
D2(1.0) | 6.45 a-c | 2.90 d | 18.07 b | 5.77 b-g | 71.98 c-e | 53.89 b | |
D3(1.5) | 6.00 b-e | 2.78 de | 18.30 b | 6.17 a-c | 69.81 de | 54.17 b | |
D4(2.0) | 5.78 b-e | 3.29 bc | 16.87 b-d | 6.23 ab | 72.69 c-e | 46.70 de | |
control | D1(0.5) | 6.34 b-d | 3.17 c | 17.55 bc | 6.00 a-d | 77.23 b | 51.82 c |
D2(1.0) | 7.27 a | 4.05 a | 21.66 a | 6.40 a | 85.70 a | 55.70 b | |
D3(1.5) | 6.56 ab | 3.43 b | 20.44 a | 6.03 a-d | 84.68 a | 62.50 a | |
D4(2.0) | 6.57 ab | 3.46 b | 21.90 a | 6.07 a-c | 89.79 a | 59.28 a | |
| CV(%) | – | 8.95 | 4.35 | 7.24 | 4.79 | 6.52 | 4.69 |
| LSD | – | 0.81 | 0.20 | 1.98 | 4.49 | 7.19 | 3.69 |
Light intensity
Tree effect
The relationship between light intensity (µmm-2s-1) and days after measurement (DAM) was studied in the field of tomato intercropped with different tree species. The significant effect of light intensity and day after measurement were obtained as a function of associated tree species. A slight variation was observed with the increase of days after measurement. At the initial stage, the light intensities were higher for all the tree species. The light intensities were decreasing from the initial stage upto 70 days after measurement. After then, light intensities were increased significantly for all the tree species with the increase of days after measurement which continued up to the end of cropping season.
Considering the tree species, the minimum light intensity was recorded for O. europea throughout the growing season of tomato. On the other hand, the maximum light intensity was recorded from control plot throughout the growing season. This was followed by C. acuminata, P. guajava and M. indica based agroforestry system. As a result, the trend of light intensity throughout the tomato growing season for different tree species were control > C. acuminata > P. guajava > M. indica > O. europea.
Distance effect
Light intensity observed in the tomato field was significantly affected by distance from tree base. Significantly the highest light intensity (353 µmm-2s-1) was observed at D4 distance followed by D3 (330.6 µmm-2s-1) distance. The lowest light intensity (323.5 µmm-2s-1) was recorded at D2 distance .
Soil moisture
Tree effect
The relationship between soil moisture (%) and days after measurement were recorded in the tomato field and was shown graphically in the The significant variation of soil moisture and day after measurement was obtained as a function of associated tree species. Soil moisture decreased with the increasing of day after measurement up to the final harvest days. Considering the tree species, the maximum soil moisture was recorded in the O. europea field throughout the tomato growing season which was followed by M. indica, and P. guajava. The minimum soil moisture was recorded from C. acuminata based agroforestry system. O. europea, M. indica and P. guajava is deep rooted fruit tree species which uptake more water from deeper soil layer and recycle them on the upper ground through litter fall. Shade created by those tree species certainly reduced the evaporation and also irrigation was done at regular internal. All these phenomena increased the moisture under those trees. C. acuminata tree is a bushy plant, canopy area in too low as compared to M. indica, O. europea and its shallow root system hardly penetrate to deeper soil layer and thus unable to recycle water to upper ground.
Distance effect
Soil moisture of the tomato field was recorded at four distances from tree base and found insignificant variations . However the highest (22.12%) soil moisture recorded at D2 distance which was statistically similar to D1 (21.38 %) and D3 (20.31 %) distances. The lowest (19.44 %) soil moisture was recorded at D4 distance. Around the tree base soil moisture content was high because of litter decomposition enriching the soil organic matter which contains much water. After then soil moisture was decreased with the increase of distance.
Soil temperature
Tree effect
Soil Temperature (OC) in the tomato field was recorded at 10 days interval and found decreasing trend from initial tomato seedling plantation up to the final harvest days (figure 14.1). On the other hand when tree species takes into consideration, the maximum soil temperature was recorded under control tomato plot which was followed by C. acuminata, P. guajava and M. indica based agroforestry system. Significantly the minimum soil temperature was recorded under O. europea based agroforestry system.
In the O. europea, P. guajava and M. indica based agroforestry systems, light penetration sharply reduced by their dense canopy resulting reduce water evaporation from the upper soil layer and thus decrease soil temperature. On the other hand control plot contain only tomato plant that gradually exhausted during life cycle and sunlight easily penetrate to the root system and thus increased soil temperature.
Distance effect
Insignificant effect of soil temperature (oC) at tomato field was recorded as a function of various distances from tree base . The highest soil temperature (19.49 oC) was recorded at D2 distance while the lowest (18.59 oC) was recorded at D4 distance which was followed by D3 (18.73 oC) and D1 (18.76 oC) distances. Under tree, root and shoot respiration occur simultaneously which increased soil temperature and decreased as distance from tree base increase.
Combined effect between associated tree species and distance from tree base on microclimatic parameters in tomato field
Light intensity (µmm-2s-1) on tomato field was significantly affected by the combined effect of tree species and distance from tree base (Table 6). Significantly the maximum light intensity (490.30 µmm-2s-1) was recorded at D3 distance followed by D4 (477.30 µmm-2s-1), D2 (472.70 µmm-2s-1) and D1 (482 µmm-2s-1) distances under control tomato plot. While the minimum (199.00 µmm-2s-1) light intensity was recorded at D1 distance which was statistically similar to D2 (204.70 µmm-2s-1), D3 (212.70 µmm-2s-1) and D4 (234.00 µmm-2s-1) distances under O. europea based agroforestry system. Shade created by the tree species was the main cause of reduced light intensity. The ranking of shade was the O. europea> M. indica> P. guajava> C. acuminata. Moreover shade reduced as the distance increased. So dense canopy and nearest distance from tree base was responsible for reduced light intensity.
Soil moisture on the tomato field also greatly affected by the combined effect of tree species and distance from tree base (Table 5). The maximum soil moisture (24.70 %) was recorded at D1 distance followed by D2 (24.47 %) and D3 (23.70%) distance under O. europea based agroforestry system while the minimum soil moisture (15.88%) was obtained at D4 distance which was statistically similar to D3 (18.82 %) distance under full sunlight. As the O. europea is shady plant and sunlight penetration to the ground area reduced which reduced the water evaporation. Moreover leaf and other litter decomposed at upper soil layer which also responsible for moisture storage. On the other hand, tree shade was absent on the control plot; only tomato plant was created shade which was exhausted at the end of cropping season. So, soil moisture was minimum on the control plot and maximum under tree; and as the distance from tree base increase, soil moisture decrease gradually.
Soil temperature is an important microclimatic parameter which was increased as the shade decreased and distance from tree base increased (Table 5). Significantly the maximum soil temperature (21.63 oC) was recorded at D4 distance under control treatment which was followed by D3 (19.57 oC), D2 (19.40 oC) and D1 (18.87 oC) distances while the minimum soil temperature (17.63 oC) was recorded at D1 distance which was statistically similar to D2 (17.89 oC), D3 (17.90 oC) and D4 (18.40 oC) distances.
When shade created by tree species, it reduces the light penetration to the ground level and moisture evaporation decreased which decrease the soil temperature beneath the tree base. Litter cover over the ground under tree also reduces the temperature. As the distance increased, soil temperature increased simultaneously. The opposite phenomena occur under full sunlight and soil temperature increase.
Table 6: Combined effect between associated tree species X distance from tree base on microclimatic parameters at tomato field
| Tree species | Distance from tree base | Light intensity (μ molm-2s-1) | Soil moisture (%) | Soil temperature (0C) |
P. guajava | D1(0.5) | 351.70 d | 16.94 hi | 18.76 c-f |
D2(1.0) | 274.5 e | 17.22 hi | 18.37 d-g | |
D3(1.5) | 265.3 e | 22.89 a-d | 18.18 e-g | |
D4(2.0) | 283.00 e | 21.32 b-g | 18.18 e-g | |
M. indica | D1(0.5) | 223.30 fg | 18.58 g-i | 18.80 c-f |
D2(1.0) | 227.30 fg | 21.52 a-g | 18.87 c-f | |
D3(1.5) | 227.70 fg | 22.27 a-f | 18.57 c-g | |
D4(2.0) | 212.00 fg | 22.35 a-f | 18.63 c-g | |
O. europea | D1(0.5) | 234.00 f | 24.70 a | 17.89 fg |
D2(1.0) | 204.70 fg | 24.47 ab | 18.40 d-g | |
D3(1.5) | 212.70 fg | 23.70 a-c | 17.90 fg | |
D4(2.0) | 199.00 g | 22.52 a-f | 17.63 g | |
C. acuminata | D1(0.5) | 474.00 ab | 22.76 a-e | 19.20 b-e |
D2(1.0) | 438.30 c | 19.38 f-h | 20.20 b | |
D3(1.5) | 457.0o bc | 20.89 c-g | 19.43 b-d | |
D4(2.0) | 462.70 a-c | 20.62 c-g | 19.40 b-d | |
Control | D1(0.5) | 482.00 ab | 19.96 d-h | 18.87 c-f |
D2(1.0) | 472.70 ab | 19.49 e-h | 21.63 a | |
D3(1.5) | 490.30 a | 18.82 g-i | 19.57 bc | |
D4(2.0) | 477.30 ab | 15.88 i | 19.40 b-d | |
| CV(%) | – | 4.72 | 8.16 | 2.90 |
| LSD | – | 25.99 | 2.81 | 0.9 |
Correlation between light intensity (µmm-2s-1) and yield (t/ha) of tomato
The relationship between light intensity (µmm-2s-1) and yield of tomato under P. guajava showed a linear relationship and estimated as Y = 0.0701x + 33.289 (R2 = 0.7439), where R2 value was positive and highly significant. The R2 value indicated that about 74% of the contribution to the yield of tomato under P. guajava could be explained by light intensity. This equation also stated that the yield of tomato was 2.73 t/ha at 327.00 µmm-2s-1 light intensity and beyond this light intensity tomato yield under P. guajava increased at the rate of 0.0701 t/ha for per unit increasing of light intensity.
Correlation between light intensity and yield of tomato was very high at M. indica (R2 = 0.7614) and at O. europea (R2= 0.7351) and moderate at C. acuminata (R2= 0.6118) and positive. This result indicated that increasing light intensity increased tomato yield. The positive and highly significantly correlation between light intensity and yield of tomato was also observer by Miah (2001).
Correlation between soil moisture (%) and yield (tha-1) of tomato
Correlation between soil moisture (%) and yield of tomato under P. guajava also showed a significant linear relationship (R2 = 0.7594) but negative and estimated as y = – 0.791 x + 60.575). The R2 value indicated that about 76 percent of the contribution to the yield of tomato under P. guajava could be explained by light intensity. This equation also revealed that yield of tomato was maximum (3.98 t/ha) at 16.4% soil moisture level and beyond this moisture level yield of tomato under P. guajava based agroforestry system decreased at the rate of 0.791 t/ha for per unit changes of soil moisture .
Functional relationship between soil moisture (%) content and yield of tomato was also measured and found very high and negative in case of M. indica (R2 = 0.7961) and C. acuminata (R2 = 0.7321 ) and moderate negative in case of O. europea ( R2 = 0.5481)
Correlation between soil temperature (oC) and yield (tha-1) of tomato
The linear relationship was found between soil temperature and yield of tomato under P. guajava which is represented as Y = 2.7637 x + 2.3116 (R2 = 0.7244). The R2 value of this relationship was very high and highly significant . The R2 value indicated that about 72 percent of the contribution to the yield of tomato could be explanted by soil temperature. This equation also stated that the yield of tomato was 2.73 t/ha at 32.0 oC soil temperature and beyond this soil temperature tomato yield increased at the rate of 2.7637 t/ha for per unit increasing of soil temperature.
Correlation between soil temperature and yield of tomato under M. indica (R2 = 0.6806) and O. europea (R2 = 0.7451) was very high and positive while under C. acuminata, it was moderate and positive (R2 = 0.5963).
Correlation between canopy volume (m2) and yield (tha-1) of tomato
A linear relationship between canopy spread and yield of tomato under P. guajava was existed and estimated as Y= – 4.6016 a + 63.103 (R2 = 0.6996) where the R2 value was negative and significant. This relationship indicated that yield of tomato under P. guajava was maximum by 3.98 t/ha at 4.18 m2 canopy spread and beyond this canopy spread yield decreased at the rate of 4.6016 t/ha for per unit changing of canopy of P. guajava .
A highly significant and negative relationship was also found in case of M. indica (R2 = 0.7112) and O. europea (R2 = 0.8114) while moderate and negative relationship was found under C. acuminata (R2 = 0.599).This relation indicated that increasing canopy spread decreases the yield of tomato.