
Origin
As a part of our academic requirement we have been assigned to prepare a term paper for the course named “Financial Accounting” our course teacher Sadd M. Faisal. Lecturer of Financial Accounting Department of Business Administration.
Scope
Our course teacher gave us the discretion to choose our topic of the term paper regarding. Pharmaceutical Company. We have decided to work on financial analysis on Pharmaceutical Company named-PERFUME CHEMICAL INDUSTRIES LTD. We have also concentrated on the off-Balance Sheet and profit and loss account.
Objective
The objective of our report is to expose the real life experience of the Financial Accounting. We have concentrated particularly on a pharmaceutical Company named PCIL. Our motive is to know that how a pharmaceutical Company run their business in the world.
Methodology
We have prepared the report using the secondary data published in the Annual Report of PCIL. For performance Evaluation we have gone through Ratio Analysis regarding Internal Liquidity, Operating Efficiency, profitability and Cash Conversion Cycle. We have also concentrated on the Dupont and Extended Dupont Analysis of Return on Equity (ROE). To Analyze the financial behavior of PCIL we have shown the Financial position of the Company. our concentration period is 2000-2004.
Executive Summery
Perfume chemical Industries Limited chemical company of our country. In this term paper awe have applied different ratios for performance evaluation of PCIL.we have calculated various ration under 5 major categories, they are
- Internal Liquidity Ratio
- Operating Efficiency Ratio
- Profitability Ratio
- Cash Conversion cycle
- Return On Equity
Internal Liquidity Ratio includes current, cash & Quick Ratio and cash conversion cycle. Current and quick Ratio Shows an increasing trend but cash ratio has a declining trend. Cash conversion cycle shows an increasing trend and becoming positive. Which shows the company is declining its accounts payable.
Total asset and Net fixed asset turnover and equity turnover comprise Operating Efficiency Ratio. All the ratios have increasing trend.
Profitability Ratio concentrates on Operating Profit, Net Profit and Gross Profit Margin. Net Profit and Operating Profit Margin have increasing trend after 2001 and Gross Profit Margin decrease after 2002.
Return on Equity Ratio includes Net Profit Margin, Total Assets Turnover and Financial Leverage. Their DU-PONT has increase 2002 and 2003. But other years position is low.
PCIL at a Glance
Perfume Chemical Industries Ltd. The Pioneer of Chemical industry in Bangladesh The Company started its journey form 1972 by creating partnership and the partnership was converted into a private Limited Company in 1974. Later on, it was converted into a Public Limited Company in 1991 and offered it’s share to the public with the approval of the Securities And Exchange Commission in the month of January 1997. The shares of the company are listed both in the Dhaka Stock Exchange Limited and Chittagong Stock Exchange Limited. The Principal activities of the company throughout the year were manufacturing, processing, packing, stocking and deal in fine chemicals and manufacturing and marketing of quality cosmetics and toilet requisites. The Financial statements have been prepared following consistently generally accepted accounting principles under the historical cost convention except for certain operating fixed assets which were revalued in 1994. Comparative information has been disclosed in respect of the year 1998 for all numerical information in the financial statements also the narrative and descriptive information when it is relevant to an understanding of the current years financial statements. Figures of the year 1998 have been reclassified whenever considered necessary to ensure comparability with the current period. The Financial statements have been prepared in compliance with the requirements of the Companies Act ‘1994, securities and Exchange Rules ‘1987 and other relevant local laws as applicable. The figures in the financial statements represent Bangladesh Taka. which have been rounded off to the nearest Taka except where indicated otherwise. Sales are recognized as and when delivery is made. Operating Fixed Assets are stated at cost or valuable less depreciation.
COMPANY PROFILE
Perfume Chemical Industries Limited is one of the Chemical Industry in our country. The Company started from 1972.
THE BOARD OF DIRECTORS
Syed Ziad Rahman Managing Director
Harun Al Rashid Chowdhury Director Finance
Perwaizudin Director
Mahtabuddin Director
Mrs. Shahina Ziad Director
Mrs. Shad Perwai Director
COMPANY SECURITY
Salek Mohammad Nasir
REGISTERED OFFICE
Corporate Head Office
7 Agrabad, C/A, Chittagong-4100
Share Liason Office
60/D, Purana Paltan, Dhaka-1000
FACTORY
BSCIC Industrial Estate
Kulurghat, Chittagong
PRINCIPAL BANKERS
United Commercial Bank Ltd.
Standard Chartered Gindlays Bank
National Bank Ltd.
BUSINESS HOURS
9.00a.m. to 5:30p.m. (Saturday to Wednesday)
9.00a.m. to 2:00 p.m. (Thursday)
SHAREHOLDERS GROUP
Sponsor
General Public
Financial Institutions
Investment corporation of Bangladesh
IFIC Investor’s Account
NON-Resident Shareholder
CAPITAL
AUTHORIZED:
30,00,000 Ordinary Shares of Taka 100.00 each
ISSUED, SUBSCRIBED & PAID-UP :
9,20,000 Ordinary Shares of Taka 100.00 each
THE PRODUCT OF THE COMPANY
Manola Love 21 Talc
Manola Vanishing Cream
Manola Fresh ness Cream
Manola Pricklyneche Talc
Liz Arden (Shampoo)
PERFORMANCE OF THE COMPANY
General conditions of business during the year under report did not improve up to the expectations of the management, business environment become more inhospitable to manufacturing industries. The year was a critical year for the company. Political unrest and other factors beyond the control of the company caused tremendous disruption in operation. The production hampered enormously due to frequent power shortage. Conditions on the market continued to be difficult particularly in view of intense competition with manufacturers selling inferior quality products, low quality spurious foreign products. The net sales of the company in the year is 82,704,291 as against 89,022,486 during the preceding year i.e. sales decreased by 7%. As the result, the company suffered a loss. With a view to overcome the unexpected situation, the Directors will endeavor to ensure steady growth in sales subject of course to favorable political, economic and other factors.
Performance Evaluation : Ratio Analysis-PCIL
2000-2004
Internal liquidity
Internal liquidity ratios indicate the ability of PCIL Company’s short term debt-paying ability. We have calculated different ratios to show the liquidity position of the company. They are:-
- Current Ratio.
- Quick Ratio.
- Cash Ratio.
| Internal Liquidity Ratio | |||||
2000 | 2001 | 2002 | 2003 | 2004 | |
| Current Ratio | 1.513145 | 1.563092 | 1.945669 | 3.49496 | 4.607833 |
| Cash ratio | 0.607764 | 0.591152 | 0.44231 | 0.087592 | 0.132078 |
| Quick Ratio | 0.900319 | 0.89801 | 0.907398 | 1.166268 | 1.566845 |
We can Realize from upper chart that current Ratio increased quickly. Cash Ratio decrease from 2000 yet 2003.But next year increased. But Quick Ratio increase serially.
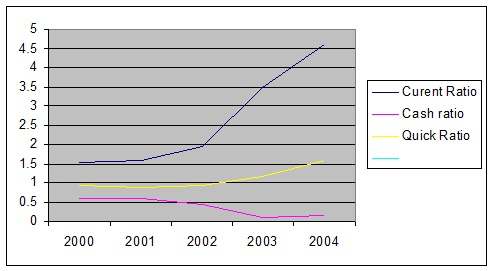
PCIL has an increasing trend in current ratio which shows that the over all liquidity position is quite good through out the observation period specially in 2002 and 2004. During the period Ratio is greater than past which indicates that company has a positive working capital. Cash Ratio is declining due to reducing cash an Receivables. Yet 2002 Quick Ratio constant but after 2002 it increased which indicates company’s cash and Receivables increased or liability decreased.
Internal Liquidity
(Cash Conversion Cycle)
Cash Conversion Cycle indicates the ability of PCIL to meet average collection period and average payment period. They are showing in chart-
| Account Receivable Period | 84.27428 | 108.0979 | 111.5516 | 120.7924 | 130.9369 |
| Inventory Processing Period | 162.8607 | 219.0123 | 231.7048 | 227.6465 | 240.0277 |
| Account Payable Period | 73.9936 | 101.7426 | 97.881 | 94.08 | 104.5784 |
2000 | 2001 | 2002 | 2003 | 2004 | |
| CCC | 173.1414 | 225.3676 | 245.3754 | 254.3589 | 266.3862 |
By realizing the Cash Conversion Cycle chart. We can consider that it has increasing gradually.
This ratio includes average collection period and average payment period of PCIL. Average collection period of the company is increasing which indicates the slow receipt of account receivables. Graph shows that PCIL is declining its accounts payable. As a result the Cash Conversion Cycle is becoming positive.
Operating Efficiency Ratios
Operating Efficiency Ratios examine how the management uses its assets and capitals measured in terms of sales generated by various assets and capital categories. With a view to a having a measurement of operating efficiency of PCIL, we have used the following ratios.
- Total Assets Turnover
- Net Fixed Assets Turnover
- Equity Turnover
| OPERATING EFFICIENCY RATIOS | |||||
2000 | 2001 | 2002 | 2003 | 2004 | |
| Total Asset Turnover | 0.4595525 | 0.38058 | 0.436487 | 0.515631 | 0.523191 |
| Net Fixed Asset Turnover | 1.0360004 | 0.910726 | 1.005314 | 1.173397 | 1.34542 |
| Equity Turnover | 0.7044784 | 0.599911 | 0.620704 | 0.611891 | 0.589057 |
Total Assets Turnover decreased at 2001. But after 2001 it increases with running. Net Fixed Asset Turnover increase through out the observation period Specially in 2002 and 2003. Equity Turnover firstly decrease but after 2001 it increased and it comes batch 2001 position at 2004.
These three ratios indicate the effectiveness of PCIL utilization of total and fixed assets and equity. All ratios fall at 2001.After 2001 they have increasing trend. Although Equity Ratio position few bad 2004.Above all the company’s sells well over the assets.
Profitability Ratios
Profitability Ratios indicate the ability of PCIL company’s ability to obtain debt and equity; financing. It also indicate the company’s liquidity position and the company’s ability to grow we have calculated different Ratios to show the management operating effectiveness of the company they are-
- Net Profit Margin .
- Operating Profit Margin.
- Gross Profit Margin.
PROFITABILITY RATIOS | |||||
2000 | 2001 | 2002 | 2003 | 2004 | |
| Net Profit Margin | 0.033004 | 0.001289 | 0.011499 | 0.011897 | 0.014145 |
| Operating Profit Margin | 0.030803 | -0.01749 | 0.012028 | 0.015291 | 0.018109 |
| Gross Profit Margin | 0.229356 | 0.254217 | 0.251772 | 0.211287 | 0.209733 |
We can realize profit margin position from the chart. Which fall 2001 and same case for operating profit margin. But both is developed after 2001. But gross profit margin increased yet 2002. After 2002 it decreased.
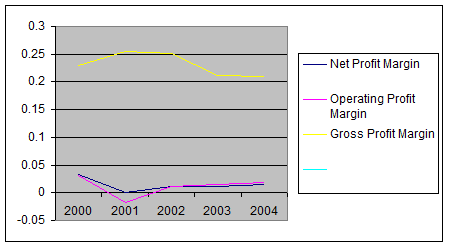
PCIL has a decreasing trend in operating profit margin which become negative, its net profit margin is also decreasing. But gross profit margin is increasing at the same time after 2001 operating and net profit margin is increasing other hand gross profit margin constant yet 2003. So this year company’s sales increase after 2003 it decrease but operating and net profit margin has also constant. So, company’s sale decrease.
Return on equity (ROE)
Return on equity is an important indicator of performance evaluation. DU-PONT system refers to break down ROE into three components to get a better in sight. The components are-
- Profit Margin
- Total Assets Turnover
- Financial Leverage
| RETURN ON EQUITY (ROE) | |||||
2000 | 2001 | 2002 | 2003 | 2004 | |
| Net Profit Margin | 0.033004 | 0.001289 | 0.011499 | 0.011897 | 0.014145 |
| Total Assets Turnover | 0.459553 | 0.38058 | 0.436487 | 0.515631 | 0.523191 |
| Financial Leverage | 1.553297 | 9.179075 | 14.22045 | 11.86683 | 1.125893 |
| DU-PONT | 0.023559 | 0.0045 | 0.071375 | 0.072797 | 0.008332 |
2000 | 2001 | 2002 | 2003 | 2004 | |
| DU-PONT | 0.023559 | 0.0045 | 0.071375 | 0.072797 | 0.008332 |
Through Dupont Analysis it is possible to know which factor is responsible for increase or decrease of ROF.
We can realize that Net Profit Margin and Total Asset Turnover decrease at 2001. But after 2001 its increase and financial leverage increase yet 2003 but 2004 it decreased from upper chart.
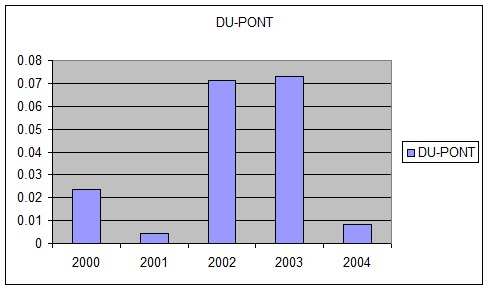
From the graph we see that 2001 company Fall their Dupont, which reason is Net Profit Margin and Total Assets Turnover decreased. After 2001 It has declining which reason all the ratio is increased. But 2004 Dupont Fall for decreased of financial leverage. An decrease in Financial Leverage indicates that the company uses less debt than before which makes the institution build up.
Profit and Loss Account
2000 | 2001 | 2002 | 2003 | 2004 | |
Sales-Net | 93482570 | 78906900 | 81106264 | 79685726 | 76415390 |
| Less-cost of Goods Sold | 71987795 | 58847438 | 60685963 | 62849148 | 60388546 |
| Gross profit | 21440775 | 20059462 | 20420301 | 16836578 | 16026844 |
| Less-charges | 12021948 | 16427038 | 15960992 | 15380526 | 14610600 |
| Administrative | 5210894 | 6951127 | 6221187 | 6161717 | 5905278 |
| Selling & Distribution | 6811054 | 9475911 | 9739805 | 9218809 | 8705322 |
| Trading profit | 9418827 | 3632424 | 4459309 | 1456052 | 1416244 |
| Less-Finical charges | 6539287 | 5012349 | 3483733 | 237573 | 32409 |
| Operating Profit Before other income | 2879540 | -1379925 | 975576 | 1218479 | 1383835 |
| Add-Other income | 1867026 | 1536359 | 356734 | 298392 | 345562 |
| Net profit before taxation | 4746566 | 156434 | 1332310 | 1516871 | 1729397 |
| Less Provision for taxation | 1661298 | 54752 | 399693 | 568827 | 648524 |
| Net Profit After Taxation | 3085268 | 101682 | 932617 | 948044 | 1080873 |
| Inappropriate Profit Brought Forward | 5628329 | 3193597 | 3295279 | 1467896 | 2415940 |
| Profit available for appropriation | 8713597 | 3295279 | 4227896 | 2415940 | 3496813 |
| Appropriation | |||||
| Dividend | 5520000 | 2760000 | 2760000 | ||
| Dividend Distribution Tax | 276000 | ||||
| Inappropriate Profit carried forward | 3193597 | 3295279 | 1467896 | 2415940 | 460813 |
Ending Summary
PCIL is a Re-known pharmaceutical Company in the country. The Company face profit and loss account from 2000-2002 after 2002 they acquire capital work-in-progress. They also faced cyclone at 2000.