Introduction:
Hong Kong Shanghai Banking Corporation (HSBC):
Headquartered in London, HSBC is one of the largest banking and financial services organizations in the world. It began operations in Hong Kong more than 130 years ago. The HSBC Group’s international network comprises some 7,000 offices in 80 countries and territories in Europe, the Asia-Pacific region, the Americas, the Middle East and Africa. With listings on the London, Hong Kong, New York and Paris stock exchanges, around 190,000 shareholders in some 100 countries and territories hold shares in HSBC. Through a global network linked by advanced technology, including a rapidly growing e-commerce capability, HSBC provides a comprehensive range of financial services: personal, commercial, corporate, investment and private banking; trade services; cash management; treasury and capital markets services; insurance; consumer and business finance;
HSBC group Vision & Values:
Become the world’s leading financial services company.
- Long term, ethical client service.
- High productivity through teamwork.
- Confident and ambitious sense of excellence.
- Capable of creativity and strong marketing.
HSBC’s Business Principal and value:
The HSBC Group is committed to five Business Principles:
- Outstanding customer service;
- Effective and efficient operations;
- Strong capital liquidity;
- Conservative lending policy;
- Strict expense discipline;
HSBC in Bangladesh:
The HSBC Asia Pacific group represents HSBC in Bangladesh. HSBC opened its first branch in Dhaka in 17th December 1996 to provide personal banking services, trade and corporate services, and custody services. The Bank was awarded ISO9002 accreditation for its personal and business banking services, which cover trade services, securities and safe custody, corporate banking, Hexagon and all personal banking. This ISO9002 designation is the first of its kind for a bank in Bangladesh. The Hong Kong and Shanghai Banking Corporation Bangladesh Ltd. primarily limited its operations to help garments industry and to commercial banking. Latter, it is extended to pharmaceuticals, jute and consumer products. Other services include cash management, treasury, securities, and custodial service.
HSBC in Bangladesh also specializes in self-service banking through providing 24-hour ATM services. In total the branch currently has 9 ATM’s (5 on-site & 4 offsite) located at various geographical areas of Dhaka & Chittagong.
Operations of Global Markets:
HSBC’s operations in Global Markets consist of treasury and capital markets services for supranational, central banks, corporations, institutional and private investors, financial institutions and other market participants. Products include:
• Foreign exchange;
• Currency, interest rate, bond, credit, equity and other specialized derivatives;
• Government and non-government fixed income and money market instruments;
• Precious metals and exchange traded futures;
• Equity services, including research, sales and trading for institutional, corporate and private clients and asset management services, including global investment advisory and fund management services; and
• Distribution of capital markets instruments, including debt, equity and structured products, utilizing links with HSBC’s global networks. Corporate and Investment Banking
The main purpose of treasury is to:
- Manage bank’s assets and liabilities.
- Promote and sell bank’s product.
- Manage the Bank’s excess/short foreign exchange products.
- Manage the bank’s excess/short interest rate products.
Some Typical Treasury Products:
- Spot foreign exchange
- Forward foreign exchange
- Swaps : a) currency b) interest rate & c) structured
- Options : a) plain vanilla & b) complex
- Derivatives : a) plain vanilla & b) structured
- Securities : a) T-Bills and T-Bonds b) FRNs
- Repo & Reverse Repo : Repurchase / Sell-Buy transactions
- Money market : overnight and term deposits
Statement of the Problem:
Now a days, competition between banks has really increased in Bangladesh as there are quite a large numbers of bank’s has established in past few years. So it has really important for HSBC to hold up there current customers. So the management of HSBC is facing a lot of competition and also thinking how they can attract new customers.
In this research I have tried to show different forecasting techniques of exchange rate, some forecasting problems in the forex markets due to technical problem or wrong prediction and also tried to recommend some solution to overcome these problems.
Purpose of the study:
The purposes of this paper are to establish rational behind the activity and to enlighten a core area of operation- to forecast the exchange rate. Within the two major forecasting techniques, more emphasis is given on the technical forecasting techniques which is followed by HSBC and I have also tried to shown some alternative forecasting techniques and also suggested the best one I found based on my calculations. A detailed discussion of these is presented in this paper.
The purpose of the study is to explore different forecasting techniques of foreign exchange markets, technical analysis basics of foreign exchange market, business utilization of technical analysis, use of technical analysis in HSBC, some risks involved in foreign exchange market and also the way to avoid mistakes in foreign exchange market
Research Time Line:
| 2007-Sept | Writing Research Proposal |
| 2007-Sept | Developing Literature Review |
| 2007-Sept | Collecting Data |
| 2007-Oct | Data Analysis and Interpretation of the Findings |
| 2007-Nov | Preparing Draft and Finalizing the Research Paper |
| 2007-Dec | Submission of the Research Paper |
Limitation of the Study:
- The major limitations of the technical analysis is, it may or may not produces the accurate projections of the foreign currency rates as a large amount of dependency on the dealers perspective. Also experience is the countable variables here, which cannot be expressed, in any mathematical models.
- According to the technical forecasting techniques the market has it own destiny and the major part of the analysis based on to determine the future. So major social or economical even political events can change it a lot. So dealers must be reactive rather than proactive.
- Time frame for the research was very limited.
- Large-scale research was not possible due to constraints and restrictions posed by the organization.
- Getting relevant papers and documents were strictly prohibited.
- The limitations that I already faced are to unable to collect local financial data, and also direct interviewing to managers doesn’t reveal many aspects of HSBC which they deny to answer or doesn’t want to answer due to their own personal career security at HSBC
- One of the main barriers in writing this report was the confidentiality of data. Though I saw their internal procedure that is being used in processing and evaluating any documentary credit, but I was told strictly not to disclose that even in my internship report.
Literature Review:
Financial markets could mean:
1. Organizations that facilitate the trade in financial products. i.e. Stock exchanges facilitate the trade in stocks, bonds and warrants.
2. The coming together of buyers and sellers to trade financial products. i.e. stocks and shares are traded between buyers and sellers in a number of ways including: the use of stock exchanges; directly between buyers and sellers etc.
In academia, students of finance will use both meanings but students of economics will only use the second meaning.
Financial markets can be domestic or they can be international.
The foreign exchange (currency or forex or FX) market exists wherever one currency is traded for another. It is by far the largest financial market in the world, and includes trading between large banks, central banks, currency speculators, multinational corporations, governments, and other financial markets and institutions. The average daily trade in the global forex and related markets currently is over US$ 3 trillion. Retail traders (individuals) are a small fraction of this market and may only participate indirectly through brokers or banks, and are subject to forex scams
The term FOREX is derived from the words Foreign exchange and is the largest financial market in the world. Unlike many markets the FX market is open 24 hours per day and has an estimated $1.2 Trillion in turnover every day. This tremendous turnover is more than the combined turnover of the main worlds’ stock markets on any given day. This trends to lead to a very liquid market and thus a desirable market to trade.
Unlike many other securities (any financial instrument that can be traded) the FX market does not have a fixed exchange. It is primarily traded through banks, brokers, dealers, financial institutions and private individuals.
The Foreign Exchange market is a worldwide network which connects the various national exchange markets by telephone and telex etc, either directly or via brokers, to transact foreign exchange business.
The Foreign Exchange, also referred to as the “Forex” or “Spot FX” market, is the largest financial market in the world. Money is traded in the FX market. Forex trading is where the currency of one nation is traded for that of another. Therefore, Forex trading is always traded in pairs. The most commonly traded currency pairs are traded against the US Dollar (USD). They are called ‘the Majors’. The major currency pairs are the Euro Dollar (EUR/USD); the British Pound (GBP/USD); the Japanese Yen (USD/JPY); and the Swiss Franc (USD/CHF).
The notable ‘commodity’ currency pairs that trade are the Canadian Dollar (USD/CAD) and the Australian Dollar AUD/USD. Because there is not a central exchange for the Forex market, these pairs and their crosses are traded over the telephone and online through a global network of banks, multinational corporations, importers and exporters, brokers and currency traders.
“Technical analysis is the study of market action, primarily through the use of charts, for the purpose of forecasting future price trends.” In its purest form, technical analysis considers only the actual price behavior of the market or instrument, based on the premise that price reflects all relevant factors before an investor becomes aware of them through other channels.
Technical analysis is widely used among traders and financial professionals, and some studies say its use is more widespread than is “fundamental” analysis in the foreign exchange market. Academics such as Eugene Fama say the evidence for technical analysis is sparse and is refuted by the efficient market hypothesis, yet some Federal Reserve and academic studies include evidence that supports technical analysis. MIT finance professor Andrew Lo argues that “several academic studies suggest that…technical analysis may well be an effective means for extracting useful information from market prices.” Burton Malkiel argues, “Technical analysis is anathema to the academic world.” He further argues that under the weak form of the efficient market hypothesis, “…you cannot predict future stock prices from past stock prices.
Forecasting techniques in the foreign exchange markets:
Currently there are widely accepted two alternative techniques for forecasting, namely
1. Fundamental Analysis
2. Technical Analysis
Fundamental Analysis:
A method of currency valuation which involves examining the countries financial figures like import/exports, balance of trade, reserve on currency, political and economical news etc. Fundamental analysis takes into consideration only those variables that are directly related to the country itself, rather than the overall state of the market or technical analysis data.
Fundamental analysis is the examination of the underlying forces that affect the well being of the economy, industry groups, and companies. As with most analysis, the goal is to derive a forecast and profit from future price movements. At the company level, fundamental analysis may involve examination of financial data, management, business concept and competition. At the industry level, there might be an examination of supply and demand forces for the products offered. For the national economy, fundamental analysis might focus on economic data to assess the present and future growth of the economy. To forecast future stock prices, fundamental analysis combines economic, industry, and company analysis to derive a stock’s current fair value and forecast future value. If fair value is not equal to the current stock price, fundamental analysts believe that the stock is either over or under valued and the market price will ultimately gravitate towards fair value. Fundamentalists do not heed the advice of the random walkers and believe that markets are weak-form efficient. By believing that prices do not accurately reflect all available information, fundamental analysts look to capitalize on perceived price discrepancies.
General Steps to Fundamental Evaluation:
Even though there is no one clear-cut method, a breakdown is presented below in the order an investor might proceed. This method employs a top-down approach that starts with the overall economy and then works down from industry groups to specific companies. As part of the analysis process, it is important to remember that all information is relative. Industry groups are compared against other industry groups and companies against other companies. Usually, companies are compared with others in the same group. For example, a telecom operator (City cell) would be compared to another telecom operator (Gremeen Phone), not to an Electronics company (Philips).
Economic Forecast:
First and foremost in a top-down approach would be an overall evaluation of the general economy. The economy is like the tide and the various industry groups and individual companies are like boats. When the economy expands, most industry groups and companies benefit and grow. When the economy declines, most sectors and companies usually suffer. Many economists link economic expansion and contraction to the level of interest rates. Interest rates are seen as a leading indicator for the stock market as well.
Below is a chart of the S&P 500 and the yield on the 10-year note over the last 30 years. Although not exact, a correlation between stock prices and interest rates can be seen. Once a scenario for the overall economy has been developed, an investor can break down the economy into its various industry groups.
(Figure: 1- A chart of the S&P 500 and the yield on the 10-year note over the last 30 years)
Technical Analysis:
In contrast to the efficient market hypothesis or fundamental analysis, technical analysis involves the examination of past data like prices and volume of trading, which leads to an estimation of future price trends and there of an investment decision. Technical analysis don’t require any analysis of the multitude of economic, industry and company variables to arrive at an estimate of future value because they believe that past price movements will signal future price movements.
Underlying assumptions of technical analysis:
1. The market value of any goods and service is determined solely by the interaction of supply and demand
2. Supply and demand is governed by numerous factors, both rational and irrational.
3. Disregarding minor fluctuations, the prices for individual securities and the overall value of the market tend to move in trends, which persists for appreciable length of time
4. Prevailing trends change in reaction to shifts in supply and demand relationships. These shifts, no matter why they occur can be detected sooner or later in the action of the market itself.
The main considerations in Technical Analysis:
Price: Changes in price reflect in investor attitudes and demand and supply of securities.
Time: The degree of movements in price is a function of time. The longer it takes for a reversal in trend for instance, the greater the price changes that would follow.
Volume: The intensity of price changes is reflected in the volume transactions that accompany the changes. An increase is not strong enough.
Breadth: Study of Breadth of market indicators, the extent to which the price changes have taken place in the market in accordance with a certain overall limit.
Research Methodology:
Research Design:
Source of Data
Both the primary as well as the secondary form of data was used to prepare the report. The details of these sources are highlighted below:
Primary Sources:
Major sources of primary information were discussions with Mr. Wahiduzzaman and Md. Bahaudding Saad, Dealers of global markets.
Secondary Sources:
Secondary information was collected from relevant documents and literature, HSBC Internet web sites, ABC guide to foreign exchange, treasury.
Other secondary sources were books on foreign exchange and treasury back office stuffs.
Data Collection:
For data collection I have interviewed dealers of global markets and also the treasurer of global market. I have asked them many questions about my related topics. Some questions are:
- What are the operations of Global Markets?
- What are the main purposes of Treasury?
- What are the Treasury products HSBC is using right now?
- What are the forecasting techniques of foreign exchange market?
- What are the Basic for technical analysis?
Data Analysis:
Here are some Forecasting Techniques followed by HSBC in their Foreign Exchange Markets:
Technical Analysis Basics:
Rationale:
–Examination of the past price movements to forecast future movements
–Price Discounts Everything
–Price Movements are not Totally Random
–What is More Important than Why
–Discipline – divorce yourself from emotions
– Volume for Stock, Open Interest & volume for Futures
Types of Charts:
- Line,
- Bar,
- Candle,
- Points & Figure Etc
(Figure: 2- Types of charts used in forecasting)
Candle Chart:
(Figure: 3- A price chart that displays the high, low, open, and close for a security each day over a specified period of time)
Why Use Candle charts:
“Make use of your opportunities.” (Japanese proverb)
The candlestick techniques we use today originated in the style of technical charting used by the Japanese for over 100 years before the West developed the bar and point-and-figure analysis systems. In the 1700s a Japanese man named Homma, a trader in the futures market, discovered that, although there was a link between price and the supply and demand of rice, the markets were strongly influenced by the emotions of the traders. He understood that when emotions played into the equation a vast difference between the value and the price of rice occurred. This difference between the value and the price is as applicable to stocks today as it was to rice in Japan centuries ago. The principles established by Homma are the basis for the candlestick chart analysis, which is used to measure market emotions towards a stock.
This charting technique has become very popular among traders. One reason is that the charts reflect only short-term outlooks–sometimes lasting less than eight to 10 trading sessions.
A big difference between the bar charts common in North America and the Japanese candlestick line is the relationship between opening and closing prices. We place more emphasis on the progression of today’s closing price from yesterday’s close. In Japan, chartists are more interested in the relationship between the closing price and the opening price of the same trading day.
8.3.2 Followings are some other Forecasting Techniques in which I have shown the calculations of forecasting foreign exchange rates and also based on the result I made recommendation for HSBC which they can be used instead of their current method:
Moving Average:
In the moving average method, we use the most recent n data values in the time series as the forecast for the next period. Mathematically, the moving average calculation is made as follows:
Moving Average=∑ (most recent n data values)/n
The term “moving” is used because every time a new observation becomes available for the time series, it replaces the oldest observations, and a new average is computed. The average changes, or moves, as new observations become available.
(See Appendix: 4- Calculation of moving average)
Exponential Smoothing Average:
Exponential smoothing uses a weighted average of past time values as the forecast, it is special case of the weighted moving averages method in which we select only one weight-the weight for the most recent observation. The weights for the other data values are computed automatically and become smaller as the observations move farther into the past. The basic exponential smoothing model follows:
Exponential Smoothing Average, F (t+1)=∞Yt+(1-∞)Ft
Where,
F (t+1) =forecast of the time series for period t+1
Yt =actual value of the time series in period t
Ft=forecast of the time series for period t
∞=smoothing constant (0≤∞≤1)
Or we can use the simplified form,
F(t+1)=0.2Yt+0.8Ft
(See Appendix: 5- Calculation of exponential smoothing average)
Seasonal Variation:
Seasonal variation is the patterns of change in a time series within a year. These patterns tend to repeat themselves each year.
The third component of a time series is the seasonal component. Many sales, production, and other series fluctuate with the seasons. The unit of time reported is either quarterly or monthly.
Almost all businesses tend to have recurring seasonal patterns. Men’s and boys’ clothing, for example, have extremely high sales just prior to Christmas and relatively low sales just after Christmas and during summer.
In the following Graph I will show you the comparison between different forecasting rate with the actual market rate (See appendix: 7):
(Figure: 4-Comparison of different forecasted rates with the actual market rate)
Among the three forecasting techniques, I think the moving average technique is the most appropriate, because from the graph you can see that among the three techniques the moving average techniques has the least spread than the other techniques compared to the actual forecasting techniques.
And also from the mean calculation(See-Appendix: 7),we can see that the spread between Moving Average method and the Actual Market rate is the least, which is 0.116172778,and it is the closest amongst the other methods. So, I can suggest HSBC to use the moving average method if they wants to change their current Forecasting Method.
Discussion
Discussion:
Business utilization of technical analysis
Bangladesh inter-bank Foreign Exchange Market
Inter-Bank Transaction in Foreign Exchange
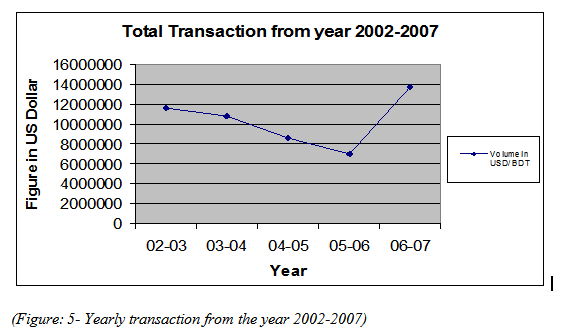
The volume of inter-bank foreign exchange transaction maintained a downward trend till year 2006 but started to move upward from the year 2006. In year 2006-2007, the inter-bank transactions in foreign exchange were totaled US$13,705,791.14, which has increased by 6,709,141.064 compared with the preceding year total US$ 6,996,650.076 (See appendix 1).
Total transactions in the inter-bank foreign exchange market from the year 2002-2007 were given into a graph as under:
Monthly position of inter-bank transactions was uneven over the period due to unpredictable demand and supply position in the inter-bank market.
Month-wise position of inter-bank transaction in foreign exchange for last twelve months is given below in a graphical form. It appears from the graph that the highest transaction took place in June-July 2007, over the last 12 months period (see appendix 2).
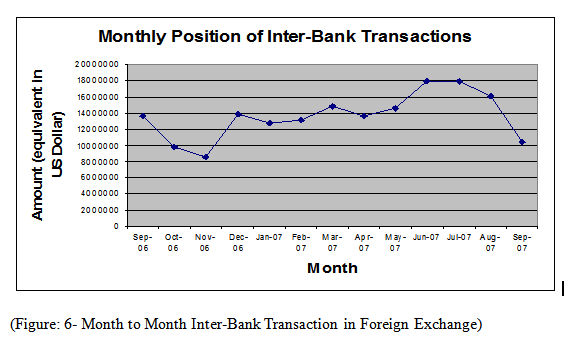
Inter-bank foreign exchange transactions have been going on smoothly despite declining the trend of transaction volume from July 2007. The transactions equivalent in million U.S.
Dollar in the inter-bank foreign exchange market during July-Sept, 2007 were the followings- 17914318.18, 16027368.42, and
10396500(equivalent in US Dollar), from which we can see very easily that the transaction volume is declining month by month.
Quarterly transactions of USD/BDT and Other FCY/BDT Transaction:
FCY/BDT Market has experienced much unsteady condition over the period in current year.
The volume of other FCY/BDT transactions incredibly increased during second quarter, the amount equal to 1478914.474, and after that during third and forth quarter it again declined and reach almost to its earlier position.
On the other hand, USD/BDT transactions decreased from 13738515.63 to 10706875 during the second quarter, but after that it again started moving upward and reached to15385873.02 during the fourth quarter (see appendix 4).
This is happened mainly due to supply of U.S. Dollar in the inter-bank forex market and price hike of importable products like petroleum & petroleum products and other essential commodities in the international market. A comparative position showing quarterly movement of USD/BDT and other FCY/BDT transactions for the current year is given in graph:
(Figure: 7- Quarterly transactions of USD/BDT and Other FCY/BDT Transaction in the inter-bank markets)
The volume of BDT trades against USD decline during the second quarter due to the higher demand of import payments as well as the official rate declared against the USD/BDT by the central bank. According to the official sources from Central Bank USD/BDT rates are 68.61 taka (as of Nov 07) whereas the underlying rates of BDT against FCY reaches Tk69.50. Comparing average TT clean buying rates of the commercial banks operated into this market stands at 68.80 on 15Nov06 and selling rates at 69.80 (refers appendix 6). The difference between these 1..00 taka between the official and actual markets rates insist the volume of FCY deals against BDT thus originating more cross currency trading.
The use of Technical analysis in Bangladesh:
The use of forecasting techniques can play major role in the increasing amount of transactions into the inter-bank foreign exchange markets in the third currency. The reasons underlying these transactions are mainly the Spot currency speculations as well as the obligations arise from the imports and governments payments.
In order to minimize the risk and to gain the opportunity over the global currency markets the introduction of the technical analysis help the speculators and give the importer or exporter the opportunity to hedge their currency positions.
Importers point of views:
If major trends can be identified in advance the dealers can advise the importer in advance to cover the risk through forwards or even within the day transactions.
Suppose an importer opens a L/C of GBP1.00 million and the current market rate against GBP= USD 2.0655 and USD= TK 68.6050. if the documents have to retire today the importer have to pay Tk141.7036 million today.
But utilizing the technical analysis, if the major trends can be identified, the importer can hedge their obligations as per the trend, i.e. if the trend is upward in both GBP/USD and USD/BDT, hedge it today through spot of forward or if the trend in downward use the maximum period before the payments due date.
Exporters point of views:
Similar to an importer, if an exporter due to receive currency like GBP or USD against the export documents, can position accordingly to the major outlooks of the underlying currency he/she will receive.
In the current scenario in USD/BDT as the market is in favor of USD, the exporter should try to lag his/her export proceeds in order to get deprecated rates over Taka.
Significance of the Study:
The foreign exchange market has played a vital role in the last decade or so in guiding the purchase and sale of goods, services and raw materials globally. The market directly affects country’s bond, equities, private property, manufacturing and all assets that are available to foreign investors. The market is a stabilizing factor in the world system of monetary exchange and was created not by design but by necessity.
Foreign exchange rates also play a major role in determining who finances government deficits, which buys equities in companies and literally effects and influences the economic scenario of every nation to cope with the foreign exchange risk in an open market economy. The market has its own momentum and therefore it is crucial to follow a universal time tested policy to tackle the forces behind the free market system with minimal risk involvement.
The research will draw various forecasting techniques in the foreign exchange market, basics of the technical analysis, business utilization of the technical analysis and also the utilization of the technical analysis in Bangladesh.
And finally the research has also described about some of the mistakes made in the forex markets and also some techniques to avoid the mistakes in the forex markets which the dealers apply while doing their works.
Risks Involved in foreign exchange:
On the foreign exchange market one discerns the following kinds of the risks:
- Exchange rate risk;
- Interest rate risk;
- Credit risk;
- Country risk.
Exchange Rate Risk:
Exchange rate risk is a consequence of the continuous shift in the worldwide market supply and demand balance on an outstanding foreign exchange position. A position will be a subject to all the price changes as long as it is outstanding. In order to cut losses short and ride profitable positions that losses should be kept within manageable limits. The most popular steps are the position limit and the loss limit. The limits are a function of the policy of the banks along with the skills of the traders and their specific areas of expertise. There are two types of position limits: daylight and overnight.
1. The daylight position limit establishes the maximum amount of a certain currency which a trader is allowed to carry at any single time during.
The limit should reflect both the trader’s level of trading skills and the amount at which a trader peaks.
2. The overnight position limit which should be smaller than daylight limits refers to any outstanding position kept overnight by traders. Really, the majority of foreign exchange traders do not hold overnight positions.
The loss limit is a measure to avoid unsustainable losses made by traders; which is enforced by the senior officers in the dealing center. The loss limits are selected on a daily and monthly basis by top management.
The position and loss limits can now be implemented more conveniently with the help of computerized systems which enable the treasurer and the chief trader to have continuous, instantaneous, and comprehensive access to accurate figures for all the positions and the profit and loss. This information may also be delivered from all the branches abroad into the headquarters terminals.
Trading 106
Interest Rate Risk:
Interest rate risk is pertinent to currency swaps, forward out rights, futures, and options. It refers to the profit and loss generated by both the fluctuations in the forward spreads and by forward amount mismatches and maturity gaps among transactions in the foreign exchange book. An amount mismatch is the difference between the spot and the forward amounts. For an active forward desk the complete elimination of maturity gaps is virtually impossible. However, this may not be a serious problem if the amounts involved in these mismatches are small. On a daily basis, traders balance the net payments and receipts for each currency through a special type of swap, called tomorrow/next or rollover.
To minimize interest rate risk, management sets limits on the total size of mismatches. The policies differ among banks, but a common approach is to separate the mismatches, based on their maturity dates, into up to six months and past six months. All the transactions are entered in computerized systems in order to calculate the positions for all the delivery dates and the profit and loss. Continuous analysis of the interest rate environment is necessary to forecast any changes that may impact on the outstanding gaps.
Credit Risk:
Credit risk is connected with the possibility that an outstanding currency position may not be repaid as agreed, due to a voluntary or involuntary action by a counter party. In these cases, trading occurs on regulated exchanges, where all trades are settled by the clearing house. On such exchanges, traders of all sizes can deal without any credit concern.
The following forms of credit risk are known:
1. Replacement risk which occurs when counter parties of the failed bank find their books unbalanced to the extent of their exposure to the insolvent party. To rebalance their books, these banks enter new transactions.
2. Settlement risk which occurs because of different time zones on different continents. Such a way, currencies may be credited at different times during the day. Australian and New Zealand dollars are credited first, then Japanese yen, followed by the European currencies and ending with the U.S. dollar. Therefore, payment may be made to a party that will declare insolvency (or be declared insolvent) immediately after, but prior to executing its own payments.
The credit risk for instruments traded off regulated exchanges is to be minimized through the customers’ creditworthiness. Commercial and investment banks, trading companies, and banks’ customers must have credit lines with each other to be able to trade. Even after the credit lines are extended, the counter parties’ financial soundness should be continuously monitored. Along with the market value of their currency portfolios, end users, in assessing the credit risk, must consider also the potential portfolios exposure. The latter may be determined through probability analysis over the time to maturity of the outstanding position. For the same purposes netting is used. Netting is a process that enables institutions to settle only their net positions with one another not trade by trade but at the end of the day, in a single transaction. If signs of payment difficulty of a bank are shown, a group of large banks may provide short-term backing from a common reserve pool.
Successful Trading 108
Country Risk:
The failure to receive an expected payment due to government interference amounts to the insolvency of an individual bank or institution, a situation described under credit risk. Country risk refers to the government’s interference in the foreign exchange markets and falls under the joint responsibility of the treasurer and the credit department. Outside the major economies, controls on foreign exchange activities are still present and actively implemented.
For the traders it is important to know or be able to anticipate any restrictive changes concerning the free flow of currencies. If this is possible, though trading in the affected currency will dry up considerably, it is still a manageable situation
Recommendation:
Followings are some methods of avoiding foreign exchange risks:
- · Don’t read the news-analyze the news: Many times, seemingly straight forward news releases from government agencies are really public relation vehicles to advance a particular point of view or policy. Such “news,” in the forex markets more than any other, is used as a tool to affect the investment psychology of the crowd. Such media manipulation is not inherently a negative. Governments and traders try to do that all the time. The new forex trader must realize that it is important to read the news to assess the message behind the drums.
- · Don’t trade surges: A price surge is a signature of panic or surprise. In Reproduction or use of the text or pictorial content in any manner without written permission is prohibited. Copyright 2002 by Futures Magazine Group, 250 S. Wacker Dr., Suite 1150, Chicago, IL60606 these events, professional traders take cover and see what happens. The retail trader also should let the market digest such shocks.
Trading during an announcement or right before, or amid some turmoil, minimizes the odds of predicting the probable direction. Technical indicators during surge periods will be distorted. You should wait for a confirmation of the new direction and remember that price action will tend to revert to pre-surge ranges providing nothing fundamental has occurred.
- Simple is better: The desire to achieve great gains in forex trading can drive us to keep adding indicators in a never-ending quest for the impossible dream.
Similarly, trading with a dozen indicators is not necessary. Many indicators just add redundant information. Indicators should be used that give clues to:1) trend direction, 2) resistance, 3) support and 4) buying and selling pres sure.
Conclusion:
Technical analysts consider the market to be 80% psychological and 20% logical. Fundamental analysts consider the market to be 20% psychological and 80% logical. It may be open for debate, but there is no questioning on the current price. After all, it is available for all to see and nobody doubts its legitimacy. The price set by the market reflects the sum knowledge of all participants, and we are not dealing with lightweights here. These participants have considered (discounted) everything under the sun and settled on a price to buy or sell. These are the forces of supply and demand at work. By examining price action to determine which force is prevailing, technical analysis focuses directly on the bottom line: What is the price? Where has it been? Where is it going?
Even though there are some universal principles and rules that can be applied, it must be remembered that technical analysis is more a practitioner’s things form than a science. As over time form, it is subject to interpretation. However, it is also flexible in approach and each trader should use only that which suits his/her style. Developing a style takes time, effort and dedication, but the rewards can be significant.
Today’s markets are incredibly volatile. Plus, thousands competing against HSBC who are constantly looking for an “edge”. The market risk is very real, and can be daunting if HSBC is not prepared. That’s why need a trading strategy that will help to reduce risk and ensure reward.
Reference
- Bangladesh Bank, Foreign Exchange Guidelines, Bangladesh Bank, Dhaka
- Bangladesh Bank, Circular No. 17 , http://www.bangladesh-bank.org/pressrl/circulars/brpd/oct0703brpd17/
- Core Risk Management – http://www.bangladesh-bank.org/pressrl/corerisks/ferisks.pdf
- Economic Development- Author Michael P Todaro and Stephen C Smith
- Bangladesh Foreign Exchange Dealers Association (Bafeda) , Quarterly and Daily Forex Market Reviews
- Investment Analysis and Portfolio Management – Frank K Reilly and Keith C Brown
- Technical Analysis in the Foreign Exchange Market: A Layman’s Guide
Capital investment and financial decisions- Haim levy and Marshall Sarnat
http://www.technicalanalysis.org.uk/
- www.wikipedia.com-definition-financial markets
- www.wikipedia.com-foreignexchange market
- www.google.com- definition of forex market-forex trading system, market, trade, foreign currency and exchange trading
- ABC guide to foreign exchange, HSBC, Global markets
- www.google.com- introduction to forex
- wikipedia-deinition-technical analysis
- Statistics for Business and Economics- Anderson, Sweeney, Williams-Sixth Edition.
- Statistical Techniques in Business & Economics- Lind, Marchel, Mason- Eleventh Edition
Appendix
Appendix1: Inter-Bank Transaction in Foreign Exchange on Yearly Basis:
| Calendar Year | Total transactions(Spot and Forward-equivalent in US Dollar) |
| 02-03 | 11,574,579.44 |
| 03-04 | 10,754,685.92 |
| 04-05 | 8,590,738.175 |
| 05-06 | 6,996,650.076 |
| 06-07 | 13,705,791.14 |
Appendix 2: Month to Month Inter-Bank Transaction in Foreign Exchange:
| Month | Amount(Equivalent in US Dollar) |
Sep-06 | 13,673,250 |
Oct-06 | 9,867222.222 |
Nov-06 | 8,601,500 |
Dec-06 | 13,885,833.33 |
Jan-07 | 12,730,526.32 |
Feb-07 | 13,128,947.37 |
Mar-07 | 14,814,868.42 |
Apr-07 | 13,628,571.43 |
May-07 | 14,623,809.52 |
Jun-07 | 17,905,238.1 |
Jul-07 | 17,914,318.18 |
Aug-07 | 16,027,368.42 |
Sep-07 | 10,396,500 |
Appendix3: Quarterly transactions of USD/BDT and Other FCY/BDT Transaction in the inter-bank markets:
| Quarters of year July2006-Jun2007 | USD/BDT Transaction | FCY/BDT Transaction |
| 1st Quarter | 13738515.63 | 746,640.625 |
| 2nd Quarter | 10706875 | 1,478,914.474 |
| 3rd Quarter | 13558114.04 | 677,216.4388 |
| 4th Quarter | 15385873.02 | 675,238.0952 |
Appendix 4: Summary of 23 months Moving Average Calculations:
| Summary of the 12 months moving average calculation | ||||
| Month | Daily market Rate | Moving average forecast | Forecast error | Squared forecast error |
January-06 | 68.65492 | |||
February-06 | 70.23846 | |||
March-06 | 72.13497 | |||
April-06 | 70.63066 | 70.34278333 | 0.287876667 | 0.082872975 |
May-06 | 69.89733 | 71.00136333 | -1.104033333 | 1.218889601 |
June-06 | 70.2956 | 70.88765333 | -0.592053333 | 0.35052715 |
July-06 | 70.37398 | 70.27453 | 0.09945 | 0.009890303 |
August-06 | 70.18733 | 70.18897 | -0.00164 | 2.6896E-06 |
September-06 | 68.33639 | 70.28563667 | -1.949246667 | 3.799562568 |
October-06 | 67.58447 | 69.63256667 | -2.048096667 | 4.194699956 |
November-06 | 71.76473 | 68.70273 | 3.062 | 9.375844 |
December-06 | 70.11912 | 69.22853 | 0.89059 | 0.793150548 |
January-07 | 70.26637 | 69.82277333 | 0.443596667 | 0.196778003 |
February-07 | 69.4276 | 70.71674 | -1.28914 | 1.66188194 |
March-07 | 69.21849 | 69.93769667 | -0.719206667 | 0.517258229 |
April-07 | 69.28277 | 69.63748667 | -0.354716667 | 0.125823914 |
May-07 | 69.3557 | 69.30962 | 0.04608 | 0.002123366 |
June-07 | 69.24568 | 69.28565333 | -0.039973333 | 0.001597867 |
July-07 | 68.9061 | 69.29471667 | -0.388616667 | 0.151022914 |
August-07 | 69.00869 | 69.16916 | -0.16047 | 0.025750621 |
September-07 | 69.33975 | 69.05349 | 0.28626 | 0.081944788 |
October-07 | 69.423 | 69.08484667 | 0.338153333 | 0.114347677 |
November-07 | 69.57957 | 69.25714667 | 0.322423333 | 0.103956806 |
5. Summary of the 15 months exponential smoothing average calculation:
| Summary of the 15 months exponential smoothing average calculation | |||
| Month | Rate (Yt) | Exponential Smoothing Forecast (Ft) | Forecast Error |
Jan-06 | 68.65492 | ||
Feb-06 | 70.23846 | 68.65492 | 1.58354 |
Mar-06 | 72.13497 | 68.971628 | 3.163342 |
Apr-06 | 70.63066 | 69.6042964 | 1.0263636 |
May-06 | 69.89733 | 69.8096 | 0.08773 |
Jun-06 | 70.2956 | 69.82718 | 0.46842 |
Jul-06 | 70.37398 | 69.9209 | 0.45308 |
Aug-06 | 70.18733 | 70.0115 | 0.17583 |
Sep-06 | 68.33639 | 70.0467 | -1.71031 |
Oct-06 | 67.58447 | 69.7047 | -2.12023 |
Nov-06 | 71.76473 | 69.2807 | 2.48403 |
Dec-06 | 70.11912 | 69.7775 | 0.34162 |
Jan-07 | 70.26637 | 69.8458 | 0.42057 |
Feb-07 | 69.4276 | 69.92994 | -0.50234 |
Mar-07 | 69.21849 | 69.8295 | -0.61101 |
Apr-07 | 69.28277 | 69.707298 | -0.424528 |
May-07 | 69.3557 | 69.6223924 | -0.2666924 |
Jun-07 | 69.24568 | 69.56905392 | -0.32337392 |
| 6. Summary of the 12 months Seasonal irregular values: | ||||||
| Summary of the 12 months Seasonal irregular values | ||||||
| Year | Quarter | Rate | Four quarter total | Four quarter moving average | Centered moving average | Seasonal-Irregular Value |
2006 | 1 | 70.34278 | ||||
2 | 70.27453 | |||||
3 | 69.63257 | 280.0726533 | 70.01816333 | 69.9300013 | 1.001260719 | |
4 | 69.82277 | 279.3673567 | 69.84183917 | 69.7193625 | 1.00175671 | |
2007 | 1 | 69.63749 | 278.3875433 | 69.59688583 | 69.5284208 | 1.000984705 |
2 | 69.29472 | 277.8398233 | 69.45995583 | |||
3 | 69.08485 | |||||
7. Comparison of Different forecasted rates with the Actual Market rate:
| Comparison of Different forecasted rates with the Actual Market rate | ||||
| Month | Moving average forecast | Centered moving average | Exponential Smoothing Forecast (Ft) | Actual Market Rate |
Jan-06 | 68.65492 | |||
Feb-06 | 68.65492 | 70.23846 | ||
Mar-06 | 68.971628 | 72.13497 | ||
Apr-06 | 70.34278333 | 69.6042964 | 70.63066 | |
May-06 | 71.00136333 | 69.8096 | 69.89733 | |
Jun-06 | 70.88765333 | 69.82718 | 70.2956 | |
Jul-06 | 70.27453 | 69.93000125 | 69.9209 | 70.37398 |
Aug-06 | 70.18897 | 69.93000125 | 70.0115 | 70.18733 |
Sep-06 | 70.28563667 | 69.93000125 | 70.0467 | 68.33639 |
Oct-06 | 69.63256667 | 69.7193625 | 69.7047 | 67.58447 |
Nov-06 | 68.70273 | 69.7193625 | 69.2807 | 71.76473 |
Dec-06 | 69.22853 | 69.7193625 | 69.7775 | 70.11912 |
Jan-07 | 69.82277333 | 69.52842083 | 69.8458 | 70.26637 |
Feb-07 | 70.71674 | 69.52842083 | 69.92994 | 69.4276 |
Mar-07 | 69.93769667 | 69.52842083 | 69.8295 | 69.21849 |
Apr-07 | 69.63748667 | 69.707298 | 69.28277 | |
May-07 | 69.30962 | 69.6223924 | 69.3557 | |
Jun-07 | 69.28565333 | 69.56905392 | 69.24568 | |
Mean- | 69.95031556 | 69.72592819 | 69.65374169 | 69.83414278 |
8. Exchange rates of Commercial Banks to public for Us Dollar
| U. S. Dollar | ||||||
SL. | Spot Buying | Spot Selling | ||||
No. | Name of Bank | T.T. | O.D.Sight | O.D. | T.T. & | B.C. |
Clean | Exp. Bills | Transfer | O.D. | |||
1 | Agrani Bank | 68.0200 | 68.0000 | 67.7500 | 68.9200 | 68.9700 |
2 | Al-Arafah Islami Bank Limited | 68.5500 | 68.4705 | 68.3900 | 69.6300 | 69.6500 |
3 | Arab Bangladesh Bank Limited | 69.0500 | 68.9500 | 68.5332 | 69.9400 | 69.9900 |
4 | Bangladesh Krishi Bank | 68.0700 | 68.0500 | 67.8300 | 68.9500 | 69.0000 |
5 | Bangladesh Shilpa Bank | 68.0200 | 68.0000 | 67.7400 | 68.9200 | 68.9700 |
6 | BASIC Bank Limited | 68.5500 | 68.4000 | 68.3000 | 69.5700 | 69.6000 |
7 | Bank Asia Limited | 68.9500 | 68.9069 | 68.4674 | 69.9000 | 69.9500 |
8 | BRAC Bank Limited | 68.7500 | 68.7264 | 68.7130 | 69.7000 | 69.7400 |
9 | Citibank, N.A. | 68.9000 | 68.8700 | 68.6656 | 69.9200 | 69.9500 |
10 | Commercial Bank of Ceylon Ltd. | 68.9000 | 68.8732 | 68.7641 | 69.9150 | 69.9450 |
11 | Dhaka Bank Limited | 68.8900 | 68.7369 | 68.4681 | 69.8200 | 69.8800 |
12 | Dutch-Bangla Bank Limited | 68.7200 | 68.6265 | 68.0786 | 69.7000 | 69.7500 |
13 | Eastern Bank Limited | 68.8500 | 68.7429 | 68.3910 | 69.8700 | 69.9000 |
14 | EXIM Bank Limited | 68.5500 | 68.4500 | 68.3539 | 69.4700 | 69.5000 |
15 | First Security Bank Limited | 68.0500 | 67.8650 | 67.5150 | 69.2000 | 69.2500 |
16 | Habib Bank Limited | 68.3000 | 68.4600 | 68.6200 | 69.4700 | 69.5000 |
17 | HSBC Limited | 68.8837 | 68.8795 | 68.6705 | 69.9206 | 69.9447 |
18 | IFIC Bank Limited | 68.6945 | 68.5075 | 68.1335 | 69.4775 | 69.5075 |
19 | Islami Bank Bangladesh Limited | 68.5000 | 68.4500 | 68.2500 | 69.4500 | 69.5000 |
20 | Janata Bank | 68.0200 | 68.0000 | 67.7400 | 68.9200 | 68.9700 |
21 | Jamuna Bank Limited | 68.6000 | 68.4105 | 68.1732 | 69.6750 | 69.7000 |
22 | Mercantile Bank Limited | 68.7000 | 68.5000 | 68.2592 | 69.6500 | 69.7000 |
23 | Mutual Trust Bank Limited | 68.7000 | 68.4023 | 68.1790 | 69.6700 | 69.7000 |
24 | National Bank Limited | 68.5000 | 68.4100 | 68.1600 | 69.4500 | 69.5000 |
25 | NCC Bank Limited | 68.9000 | 68.8000 | 68.7000 | 69.8500 | 69.9000 |
26 | ONE Bank Limited | 68.6340 | 68.6022 | 68.2147 | 69.5500 | 69.6000 |
27 | Prime Bank Limited | 68.9000 | 68.7124 | 68.4981 | 69.8500 | 69.9000 |
28 | Pubali Bank Limited | 68.4500 | 68.3500 | 68.3000 | 69.4500 | 69.5000 |
29 | Rupali Bank Limited | 68.2500 | 68.2000 | 68.0000 | 69.2300 | 69.2500 |
30 | Shahjalal Islami Bank Limited | 68.8500 | 68.6626 | 68.2074 | 69.8600 | 69.9000 |
31 | Social Investment Bank Limited | 68.9000 | 68.7401 | 68.1912 | 69.7500 | 69.8000 |
32 | Sonali Bank | 68.0200 | 68.0000 | 67.7400 | 68.9200 | 68.9700 |
33 | Southeast Bank Limited | 68.7500 | 68.5500 | 68.1000 | 69.6500 | 69.7500 |
34 | Standard Bank Limited | 68.9000 | 68.8001 | 68.7003 | 69.8600 | 69.9000 |
35 | Standard Chartered Bank | 68.9000 | 68.8770 | 68.8311 | 69.9200 | 69.9500 |
36 | State Bank of India | 68.6500 | 68.6175 | 68.3700 | 69.6500 | 69.7000 |
37 | The City Bank Limited | 68.9000 | 68.8062 | 68.4558 | 69.7800 | 69.8500 |
38 | The Oriental Bank Limited | 67.8000 | 67.6995 | 67.5682 | 68.8500 | 68.9000 |
39 | The Premier Bank Limited | 68.0500 | 67.8912 | 67.7551 | 69.2000 | 69.2500 |
40 | The Trust Bank Limited | 68.9500 | 68.8500 | 68.5500 | 69.8000 | 69.8500 |
41 | United Commercial Bank Limited | 68.8500 | 68.7500 | 68.5900 | 69.8200 | 69.8500 |
42 | Uttara Bank Limited | 68.4400 | 68.3403 | 68.1350 | 69.4500 | 59.5000 |
| Average | 68.5908 | 68.4985 | 68.2631 | 69.5607 | 69.3664 | |