1.1 Origin of the Report:
This report was prepared for Mr. Abdul Momen as a course requirement for Financial Accounting II.
1.2 Problem & Purpose:
The purpose of this report is to analyze the current financial condition of the cement manufacturing company Confidence cement Ltd and also get a closer ok at the cement industry of Bangladesh. Based on that analysis, finally it provides recommendations whether it’s profitable to buy the company’s shares or not.
1.3 Scope:
This report analyzes the financial statements of 2002-2006 of Confidence Cement Ltd. To calculate the industry average and compare it with the company’s ratios, it analyzes the available data of 4 other contemporary cement companies. These companies are, Meghna Cement Ltd., Aramit Cement Ltd., Heidelberg Cement Ltd. and Niloy Cement Ltd.
1.4 Limitations:
Different companies have different methods to present their data. This poses to be a problem when we compare their financial conditions. Moreover, to calculate the industry average, the ratios of only 5 companies have been used. As there are more companies in the cement industry, it does not give us a full view of the overall industry.
1.5 Sources & Methods of Collecting Information:
Various sources have been used to prepare this report. These sources are mainly secondary ones. The list of the sources is mentioned in the bibliography.
1.6 Report Preview:
At first, the report analyzes the comparative balance sheets and profit and loss account from 2002-2006. Then it analyzes the company’s trend percentage. Moving on, it calculates different ratios and finally compares them with the industry average. Based on the information from the analysis, it suggests whether it would be profitable to invest in this industry or not.
2. Industry Overview
Cement sector is the largest increase sector in Bangladesh. There are 70+ cement factories in Bangladesh and daily production capacity is 16.687 Million MT. The cement market in Bangladesh consists of 100% supply in bagged cement. The dominant type of cement used in Bangladesh is Ordinary Portland Cement (OPC). The clinker, a raw material used in the production of cement, is imported from other countries like India, Thailand, Malaysia and China. The country lacks limestone—a major raw material required to make cement. The only production stage performed in Bangladesh, to make cement, is importing the clinker and grinding it with gypsum to give pure cement.
The first cement factory in the country was Chattak Cement Factory, which was established in the early 1940 when Bangladesh was a part of India. This was the only integrated cement plant in the whole country because of the lack of raw materials. The first cement factory by the private sector was the Aynepur Cement Factory, which was established in 1992, had a capacity of 30,000 TPA. This was also an integrated cement plant, but it did not play any significant role in the cement industry because of irregular production and Other than these two factories, there are no other plants in the country. All other cement production facilities that are in operation today are clinker grinding units, facilities where imported clinkers are ground to produce cement. By 2002, there were as many as 56 cement grinding factories in the country with a total production capacity of 11.8 million tons.
Till the first half of 90’s, Bangladesh cement market was typically an import market. Hyundai was the first multinational company to start up a local factory primarily to fulfill the demand of Jamuna Bridge. After the year 1990, Bangladesh government changed its rules as it withdrew the price control, and had a favorable tax control for the imported clinker. As a result, the cement industry in the country began to develop after 1990. In 2001, Bangladesh became self sufficient in cement production. Many multinational companies and entrepreneurs also started setting up their plants in the country because of the favorable duty structure imposed by the government for local production. This included world leaders like Lafarge, Holcim, Heidelberg (Scancem) or Cemex – each now having their own plants. Now Bangladesh is producing surplus cement to its requirements and there are more companies than what the country needed.
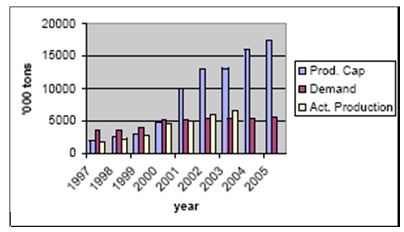
Figure 1: Demand & Supply of Cement in Bangladesh 1997-2005
Source: The Daily Star
Bangladesh is having a Free Trade Agreement talk with Sri Lanka which means that Bangladesh may have good chance of exporting its surplus cement to Sri Lanka, and once it does that, the doors of other countries who lack cement industry, may also open up for Bangladeshi cement.
The cement industry in Bangladesh is riddled with lots of problems, which are hindering its growth. Most of the companies hardly utilize 50 percent of their production capacities as the supply vastly exceeds the demand. Moreover, obtaining raw materials, environmental issues, political instability, natural disasters, inconsistent supply of electricity and unavailability of foreign machinery severely affect the local cement industries.
Currently there are 8 public listed companies in the cement industry. They are,
- Aramit Cement Ltd. – A
- Confidence Cement Ltd. – A
- Heidelberg Cement Ltd. – A
- Lafarge Surma Cement Ltd. – G (Greenfield)
- Meghna Cement – A
- Modern Cement – Z
- Niloy Cement – Z
- Padma Cement – Z
Among these 8 companies, we chose 5 for industry analysis. Those 5 companies are Confidence Cement, Meghna Cement, Aramit Cement, Heidelberg Cement & Niloy Cement.
3. Company Overview
Confidence Cement Ltd. was incorporated as a public limited company on May 2, 1991 with an authorized capital of Tk. 200,000,000 equally divided into 2,000,000 ordinary shares with par value of Tk. 100 each. This capital was increased on March 31, 1998 to Tk. 500,000,000. Confidence Cement Ltd. is the first privately held cement manufacturing company in Bangladesh. The company’s production facility was established in 1990 with 480,000 Metric Ton annual production capacity in Chittagong. Currently, Confidence Cement Ltd’s annual turnover ranges from US$ 10 million to US$ 50 million, the main markets being Eastern Asia and the subsidiary ones being Bangladesh and India.
Confidence Cement manufactures ordinary Portland cement. The company aims to be the best cement manufacturing company of Bangladesh through continuous development and by producing high and consistent quality cement to meet all customers’ needs. To achieve these objectives, it uses modern state-of-art machinery, calibrated testing equipments and computerized packing and raw materials mixing devices in its controlled production process. Confidence Cement Ltd’s Research and Development team consists of 20 personnel out of the total workforce of 500.
Confidence Cement Ltd. is the first ISO-9002 certified cement manufacturer in Bangladesh. To generate customer satisfaction and confidence it adopted the ISO-9002 standards which ensure standard operating procedures for half-yearly marketing sales, procurements and manufacturing processes of ordinary Portland cement. These standards are recognized worldwide as the highest for developing a company’s production process and external customer services. ISO-9002 regulations have been brought into t Confidence Cement Ltd. administration as well. All staff at all levels of Confidence Cement has been trained in the highly demanding quality control system. The receipt of ISO-9002 delineates the determination on part o the management and staff of the company to maintain a quality system that efficiently meets all customer and government requirements.
4. Analysis of Financial Statements
The analysis of the financial statements of the Confidence Cement Ltd. has been done by applying a few analytical tools and techniques to financial statements and the other relevant data to obtain useful information. The analyses rely on comparisons or relationships of data as they enhance the utility o practical value of accounting information. They help to assess the company’s past performance and current financial position. The information shows the consequences of prior management decisions. It is also used to make predictions that may have direct effect on decisions made by users of financial statements. A company’s financial statements are analyzed internally my management and externally by investors and creditors.
Present investors and potential investors are both interested in its profitability- the future ability of a company to generate income or earn profits. These investors wish to predict future dividends and changes in the market price of the company’s common stock. Since both dividends and price changes are likely to be influenced by earnings, investors may seek to predict earnings.
Creditors are interested to in predicting a company’s solvency- the ability of a company to pay debts as they come due. The liquidity of a company affects its shorter solvency. The company’s liquidity is its state of possessing liquid assets like cash and other assets which will soon be converted to cash. Since companies must pay short-term debts soon, liquid assets must be available for their payment. Long-term creditors are interested in a company’s long-term solvency. A company is considered solvent when its assets exceed its liabilities so that the company has positive stockholder’s equity.
To analyze the financial position of the company Confidence Cement Ltd. and to decide whether we should invest in this industry, particularly in this company by buying its shares, several techniques have been applied. These include,
Analysis of the Comparative Balance Sheets 2002-2006
– Horizontal Analysis
– Vertical Analysis
Analysis of the Comparative Profit & Loss Account 2002-2006
– Horizontal Analysis
– Vertical Analysis
Trend Percentages of the Income Statement
Ratio Analysis of the company along with the overall industry
This sequential analysis process will gradually bring out the whole financial scenario of the company and help us decide whether it will be profitable to invest in this company or not.
5. Analysis of the Balance Sheets
5.1 Comparative Balance Sheets – 2006 & 2005 :
December 31 | Increase or (Decrease) 2006 over 2005 | Percent of Total Assets | ||||
2006 | 2005 | Taka | Percent | 2006 | 2005 | |
| ASSETS | ||||||
| Current Assets | ||||||
| Stores and spares | 64,283,578 | 64,109,994 | 173,584 | 0.3 | 6.4 | 6.1 |
| Stock of raw and packing materials | 104,771,563 | 153,257,431 | (48,485,868) | -31.6 | 10.4 | 14.5 |
| Book debts | 140,737,743 | 144,598,910 | (3,861,167) | -2.7 | 14.0 | 13.7 |
| Advances, deposits and pre-payments | 69,277,082 | 78,480,587 | (9,203,505) | -11.7 | 6.9 | 7.4 |
| Other receivables | 4,238,262 | 3,003,777 | 1,234,485 | 41.1 | 0.4 | 0.3 |
| Cash and cash equivalents | 41,629,728 | 39,376,003 | 2,253,725 | 5.7 | 4.1 | 3.7 |
| Total Current Assets | 424,937,956 | 482,826,702 | (57,888,746) | -12.0 | 42.3 | 45.8 |
| Fixed & Long-Term Assets | ||||||
| Operating Fixed Assets -at cost | 845,234,939 | 801,804,143 | 43,430,796 | 5.4 | 84.1 | 76.1 |
| Less: Depreciation | (298,273,434) | (265,617,733) | (32,655,701) | 12.3 | -29.7 | -25.2 |
| Capital work-in-progress | 673,659 | (673,659) | -100.0 | 0.0 | 0.1 | |
| Investment-at cost | 31,325,000 | 31,325,000 | – | 0.0 | 3.1 | 3.0 |
| Pre-production expenses | 2,047,826 | 2,632,919 | (585,093) | -22.2 | 0.2 | 0.2 |
| Total Fixed & Long-Term Assets | 580,334,331 | 570,817,988 | 9,516,343 | 1.7 | 57.7 | 54.2 |
| Total Assets | 1,005,272,287 | 1,053,644,690 | (48,372,403) | -4.6 | 100.0 | 100.0 |
| LIABILITIES & STOCKHOLDERS’ EQUITY | ||||||
| Current Liabilities & Provisions | ||||||
| Creditors and accruals | 61,807,398 | 52,985,936 | 8,821,462 | 16.6 | 6.1 | 5.0 |
| Short term loans-secured | 238,698,077 | 361,626,333 | (122,928,256) | -34.0 | 23.7 | 34.3 |
| Current portion of long term loans | 12,000,000 | 5,178,000 | 6,822,000 | 131.7 | 1.2 | 0.5 |
| Proposed dividend | 28,500,000 | 9,500,000 | 19,000,000 | 200.0 | 2.8 | 0.9 |
| Provision for taxation | 21,200,000 | 21,200,000 | 2.1 | 0.0 | ||
| Total Current Liabilities | 362,205,475 | 429,290,269 | (67,084,794) | -15.6 | 36.0 | 40.7 |
| Long-term Liabilities | ||||||
| Long-term loan-secured | 10,501,799 | 4,421,453 | 6,080,346 | 137.5 | 1.0 | 0.4 |
| Total Liabilities | 372,707,274 | 433,711,722 | (61,004,448) | -14.1 | 37.1 | 41.2 |
| Stockholders’ Equity | ||||||
| Share Capital | 190,000,000 | 190,000,000 | – | 0.0 | 18.9 | 18.0 |
| Share Premium | 220,192,749 | 220,192,749 | – | 0.0 | 21.9 | 20.9 |
| Reserves | 220,862,754 | 208,362,754 | 12,500,000 | 6.0 | 22.0 | 19.8 |
| Profit & Loss Account | 1,509,510 | 1,377,465 | 132,045 | 9.6 | 0.2 | 0.1 |
| Total stockholders’ equity | 632,565,013 | 619,932,968 | 12,632,045 | 2.0 | 62.9 | 58.8 |
| Total liabilities & stockholders’ equity | 1,005,272,287 | 1,053,644,690 | (48,372,403) | -4.6 | 100.0 | 100.0 |
Table 1: Comparative Balance Sheets – 2006 & 2005
5.1.1 Horizontal Analysis:
- In 2006, the total current assets have decreased Tk. 57,888,746, consisting largely of Tk. 48,485,868 decrease in cash, while total current liabilities have decreased Tk. 67,084,794.
- The fixed & long-term assets increased Tk. 9,516,343 while the long-term liabilities increased 6,080,346
- Total assets have decreased Tk. 57,888,746, while total liabilities have decreased Tk. 61,004,448.
- The current assets decreased by 12%, while the current liabilities decreased by 15.6%. Though current liabilities are decreasing, the high decrease rate of current assets can be a major threat to the company.
- The long-term liabilities increased by an astonishing 137.5% as the company took a loan of Tk. 10,501,799 from Prime Bank Ltd.
- Overall, the decrease in total assets is 4.6%, whereas, the decrease in total liabilities is 14.1%.
- The change in total fixed & long-term assets & total stockholders’ equity was not much.
5.1.2 Vertical Analysis:
- The vertical analysis of the company’s balance sheet discloses each account’s significance relative to total assets or equities.
- The stock of raw and packing materials decreased from being 14.5% to 10.4% of the total assets.
- The pre-production expense did decrease by 22.2% but it is only 0.2% of the total assets.
- The current liabilities decreased by 4.7% from 40.7% to 36% of the total equities (liabilities & stockholders’ equity)
- The total liabilities decreased from being 41.2% to 37.1% of the total equities.
- Finally, the vertical analysis shows, the percentage of stockholder financing to total assets of the company increased from 58.8% to 62.9%
By analyzing the comparative balance sheets of 2006 & 2005, we can conclude that the sudden decrease in the company’s assets is not a good sign.
5.2 Comparative Balance Sheets – 2005 & 2004 :
December 31 | Increase or (Decrease) 2005 over 2004 | Percent of Total Assets | ||||
2005 | 2004 | Taka | Percent | 2005 | 2004 | |
| ASSETS | ||||||
| Current Assets | ||||||
| Stores and spares | 64,109,994 | 67,110,497 | (3,000,503) | -4.5 | 6.1 | 7.2 |
| Stock of raw and packing materials | 153,257,431 | 100,108,278 | 53,149,153 | 53.1 | 14.5 | 10.7 |
| Book debts | 144,598,910 | 119,980,667 | 24,618,243 | 20.5 | 13.7 | 12.8 |
| Advances, deposits and pre-payments | 78,480,587 | 40,166,325 | 38,314,262 | 95.4 | 7.4 | 4.3 |
| Other receivables | 3,003,777 | 894,284 | 2,109,493 | 235.9 | 0.3 | 0.1 |
| Cash and cash equivalents | 39,376,003 | 29,055174 | 10,320,829 | 35.5 | 3.7 | 3.1 |
| Total Current Assets | 482,826,702 | 357,315,225 | 125,511,477 | 35.1 | 45.8 | 38.1 |
| Fixed & Long-Term Assets | ||||||
| Operating Fixed Assets -at cost | 801,804,143 | 778,917,673 | 22,886,470 | 2.9 | 76.1 | 83.1 |
| Less: Depreciation | (265,617,733) | (234,041,557) | (31,576,176) | 13.5 | -25.2 | -25.0 |
| Capital work-in-progress | 673,659 | 107,007 | 566,652 | 529.5 | 0.1 | 0.0 |
| Investment-at cost | 31,325,000 | 31,325,000 | 0.0 | 3.0 | 3.3 | |
| Pre-production expenses | 2,632,919 | 3,218,012 | (585,093) | -18.2 | 0.2 | 0.3 |
| Total Fixed & Long-Term Assets | 570,817,988 | 579,526,135 | (8,708,147) | -1.5 | 54.2 | 61.9 |
| Total Assets | 1,053,644,690 | 936,841,360 | 116,803,330 | 12.5 | 100.0 | 100.0 |
| LIABILITIES & STOCKHOLDERS’ EQUITY | ||||||
| Current Liabilities & Provisions | ||||||
| Creditors and accruals | 52,985,936 | 41,688,822 | 11,297,114 | 27.1 | 5.0 | 4.4 |
| Short term loans-secured | 361,626,333 | 250,184,131 | 111,442,202 | 44.5 | 34.3 | 26.7 |
| Current portion of long term loans | 5,178,000 | 27,715,744 | (22,537,744) | -81.3 | 0.5 | 3.0 |
| Proposed dividend | 9,500,000 | 9,500,000 | – | 0.0 | 0.9 | 1.0 |
| Provision for taxation | ||||||
| Total Current Liabilities | 429,290,269 | 329,088,697 | 100,201,572 | 30.4 | 40.7 | 35.1 |
| Long-term Liabilities | ||||||
| Long-term loan-secured | 4,421,453 | 83,293 | 4,338,160 | 5208.3 | 0.4 | 0.0 |
| Total Liabilities | 433,711,722 | 329,171,990 | 104,539,732 | 31.8 | 41.2 | 35.1 |
| Stockholders’ Equity | ||||||
| Share Capital | 190,000,000 | 190,000,000 | – | 0.0 | 18.0 | 20.3 |
| Share Premium | 220,192,749 | 220,192,749 | – | 0.0 | 20.9 | 23.5 |
| Reserves | 208,362,754 | 207,412,754 | 950,000 | 0.5 | 19.8 | 22.1 |
| Profit & Loss Account | 1,377,465 | (9,936,133) | 11,313,598 | -113.9 | 0.1 | -1.1 |
| Total stockholders’ equity | 619,932,968 | 607,669,370 | 12,263,598 | 2 | 58.8 | 64.9 |
| Total liabilities & stockholders’ equity | 1,053,644,690 | 936,841,360 | 116,803,330 | 12.5 | 100.0 | 100.0 |
Table 2: Comparative Balance Sheets – 2005 & 2004
5.2.1 Horizontal Analysis:
- In 2005, the total current assets increased Tk. 125,511477, while total current liabilities increased Tk. 100,201,572.
- The fixed & long-term assets decreased Tk. 8,708,147 while the long-term liabilities increased 4,38,160
- Total assets have increased Tk. 116,803,330, while total liabilities have increased Tk. 104,539,732.
- The current assets increased by 35.1%, while the current liabilities increased by 30.4%. Though current liabilities are increasing, the increase in the company’s current assets is definitely a good sign.
- The long-term liabilities increased by an astonishing 5208.3%.
- Overall, the increase in total assets is 12.5%, whereas, the increase in total liabilities is 31.8%.
- The change in total fixed & long-term assets & total stockholders’ equity was not much.
5.2.2 Vertical Analysis:
- The stock of raw and packing materials decreased from being 14.5% to 10.4% of the total assets.
- The pre-production expense did increase by 18.2% but it is only 0.2% of the total assets.
- The current liabilities decreased by 4.7% from 40.7% to 36% of the total equities (liabilities & stockholders’ equity)
- The total liabilities increased from being 35.1% to 41.2% of the total equities.
- Finally, the vertical analysis shows, the percentage of stockholder financing to total assets of the company decreased from 64.9% to 58.8%
By analyzing the comparative balance sheet of the year 2004 & 2003, we can conclude that, the rate of increase in the company’s liabilities is greater than that of the company’s assets.
5.3 Comparative Balance Sheets – 2004 & 2003 :
December 31 | Increase or (Decrease) 2004 over 2003 | Percent of Total Assets | ||||
2004 | 2003 | Taka | Percent | 2004 | 2003 | |
| ASSETS | ||||||
| Current Assets | ||||||
| Stores and spares | 67,110,497 | 69,533,018 | (2,422,521) | -3.5 | 7.2 | 7.4 |
| Stock of raw and packing materials | 100,108,278 | 109,473,965 | (9,365,687) | -8.6 | 10.7 | 11.6 |
| Book debts | 119,980,667 | 92,724,917 | 27,255,750 | 29.4 | 12.8 | 9.8 |
| Advances, deposits and pre-payments | 40,166,325 | 35,148,538 | 5,017,787 | 14.3 | 4.3 | 3.7 |
| Other receivables | 894,284 | 894,284 | 0.1 | 0.0 | ||
| Cash and cash equivalents | 29,055174 | 28,884,680 | 170,494 | 0.6 | 3.1 | 3.1 |
| Total Current Assets | 357,315,225 | 335,765,118 | 21,550,107 | 6.4 | 38.1 | 35.6 |
| Fixed & Long-Term Assets | ||||||
| Operating Fixed Assets -at cost | 778,917,673 | 776,446,70 | 2,470,973 | 0.3 | 83.1 | 82.3 |
| Less: Depreciation | (234,041,557) | (204,286,681) | (29,754,876) | 14.6 | -25.0 | -21.7 |
| Capital work-in-progress | 107,007 | 107,007 | 0.0 | 0.0 | ||
| Investment-at cost | 31,325,000 | 31,325,000 | 0.0 | 3.3 | 3.3 | |
| Pre-production expenses | 3,218,012 | 3,803,105 | (585,093) | -15.4 | 0.3 | 0.4 |
| Total Fixed & Long-Term Assets | 579,526,135 | 607,288,124 | (27,761,989) | -4.6 | 61.9 | 64.4 |
| Total Assets | 936,841,360 | 943,053,242 | (6,211,882) | -0.7 | 100.0 | 100.0 |
| LIABILITIES & STOCKHOLDERS’ EQUITY | ||||||
| Current Liabilities & Provisions | ||||||
| Creditors and accruals | 41,688,822 | 36,706,946 | 4,981,876 | 13.6 | 4.4 | 3.9 |
| Short term loans-secured | 250,184,131 | 202,269,119 | 47,915,012 | 23.7 | 26.7 | 21.4 |
| Current portion of long term loans | 27,715,744 | 29,290,392 | (2,189,648) | -7.3 | 3.0 | 3.20 |
| Proposed dividend | 9,500,000 | 9,500,000 | – | 0.0 | 1.0 | 1.0 |
| Provision for taxation | ||||||
| Total Current Liabilities | 329,088,697 | 278,38,457 | 50,707,240 | 18.2 | 35.1 | 29.5 |
| Long-term Liabilities | ||||||
| Long-term loan-secured | 83,293 | 22,513,604 | (22,430,311) | -99.6 | 0.0 | 2.4 |
| Total Liabilities | 329,171,990 | 300,895,061 | 28,276,929 | 9.4 | 35.1 | 31.9 |
| Stockholders’ Equity | ||||||
| Share Capital | 190,000,000 | 190,000,000 | – | 0.0 | 20.3 | 20.1 |
| Share Premium | 220,192,749 | 220,192,749 | – | 0.0 | 23.5 | 23.3 |
| Reserves | 207,412,754 | 217,862,754 | (10,450,000) | -4.8 | 22.1 | 23.1 |
| Profit & Loss Account | (9,936,133) | 14,102,678 | (24,038,811) | -170.5 | -1.1 | 1.5 |
| Total stockholders’ equity | 607,669,370 | 642,158,181 | (34,488,811) | -5.4 | 64.9 | 68.1 |
| Total liabilities & stockholders’ equity | 936,841,360 | 943,053,242 | (6,211,882) | -0.7 | 100.0 | 100.0 |
Table 3: Comparative Balance Sheets – 2004 & 2003
5.3.1 Horizontal Analysis:
- In 2004, the total current assets have increased Tk. 21,550,107, while total current liabilities have increased Tk. 50,707,240.
- The fixed & long-term assets decreased Tk. 27,761,989 while the long-term liabilities decreased Tk. 22,430,311.
- Total assets have decreased Tk. 6,211,882, while total liabilities have increased Tk. 28,276,929.
- The current assets increased by 6.4%, while the current liabilities increased by 18.2%. This can be a threat to the company as it started losing its solvency.
- The long-term liabilities decreased by 99.6%.
- Overall, the decrease in total assets is 0.7%, whereas, the increase in total liabilities is 9.4%.
- Both the total fixed & long-term assets & total stockholders’ equity decreased in this period.
5.3.2 Vertical Analysis:
- The book debts increased from being 9.8% to 12.8% of the net sales.
- The current assets increased from being 35.6% to the 38.1% of the net sales.
- The fixed & long-term assets went from being 64.4% to the 61.9% of the net sales.
- The current liabilities increased from being 29.5% to 35.1% of the total equities (liabilities & stockholders’ equity)
- The total liabilities increased from being 31.9% to 35.1% of the total equities.
- Finally, the vertical analysis shows, the percentage of stockholder financing to total assets of the company decreased from 68.1% to 64.9%
By analyzing the comparative balance sheets of 2006 & 2005, we can conclude that the decrease in the company’s asset along with the increase of its liabilities is a very bad sign for the company. It means, the company is losing its ability to pay its debts and has a very high chance of being bankrupt.
5.4 Comparative Balance Sheets – 2003 & 2002 :
December 31 | Increase or (Decrease) 2003 over 2002 | Percent of Total Assets | ||||
2003 | 2002 | Taka | Percent | 2003 | 2002 | |
| ASSETS | ||||||
| Current Assets | ||||||
| Stores and spares | 69,533,018 | 86,609,695 | (17,076,677) | -19.7 | 7.4 | 8.1 |
| Stock of raw and packing materials | 109,473,965 | 153,902,053 | (44,428,088) | -28.9 | 11.6 | 14.3 |
| Book debts | 92,724,917 | 80,819,765 | 11,905,152 | 14.7 | 9.8 | 7.5 |
| Advances, deposits and pre-payments | 35,148,538 | 65,663,718 | (30,515,180) | -46.5 | 3.7 | 6.1 |
| Other receivables | ||||||
| Cash and cash equivalents | 28,884,680 | 57,916,886 | (29,032,206) | -50.1 | 3.1 | 5.4 |
| Total Current Assets | 335,765,118 | 444,912,117 | (109,146,999) | -24.5 | 35.6 | 41.5 |
| Fixed & Long-Term Assets | ||||||
| Operating Fixed Assets -at cost | 776,446,70 | 739,487,743 | 36,958,957 | 5.0 | 82.3 | 68.9 |
| Less: Depreciation | (204,286,681) | (174,329,556) | (29,957,125) | 17.2 | -21.7 | -16.2 |
| Capital work-in-progress | 27,378,577 | (27,378,577) | -100.0 | 0.0 | 2.6 | |
| Investment-at cost | 31,325,000 | 31,325,000 | – | 0.0 | 3.3 | 2.9 |
| Pre-production expenses | 3,803,105 | 4,388,198 | (585,093) | -13.3 | 0.4 | 0.4 |
| Total Fixed & Long-Term Assets | 607,288,124 | 628,249,962 | (20,961,838) | -3.3 | 64.4 | 58.5 |
| Total Assets | 943,053,242 | 1,073,162,079 | (130,108,837) | -12.1 | 100.0 | 100.0 |
| LIABILITIES & STOCKHOLDERS’ EQUITY | ||||||
| Current Liabilities & Provisions | ||||||
| Creditors and accruals | 36,706,946 | 73,168,190 | (36,461,244) | -49.8 | 3.9 | 6.8 |
| Short term loans-secured | 202,269,119 | 276,754,204 | (74,485,085) | -26.9 | 21.4 | 25.8 |
| Current portion of long term loans | 29,290,392 | 43,817,392 | (13,912,000) | -31.7 | 3.20 | 4.1 |
| Proposed dividend | 9,500,000 | 9,500,000 | 1.0 | 0.0 | ||
| Provision for taxation | ||||||
| Total Current Liabilities | 278,38,457 | 393,739,786 | (115,358,329) | -29.3 | 29.5 | 36.7 |
| Long-term Liabilities | ||||||
| Long-term loan-secured | 22,513,604 | 43,987,929 | (21,474,325) | -48.8 | 2.4 | 4.1 |
| Total Liabilities | 300,895,061 | 437,727,715 | (136,832,654) | -31.3 | 31.9 | 40.8 |
| Stockholders’ Equity | ||||||
| Share Capital | 190,000,000 | 190,000,000 | – | 0.0 | 20.1 | 17.7 |
| Share Premium | 220,192,749 | 220,192,749 | – | 0.0 | 23.3 | 20.5 |
| Reserves | 217,862,754 | 217,862,754 | – | 0.0 | 23.1 | 20.3 |
| Profit & Loss Account | 14,102,678 | 7.378,861 | 6,723,817 | 91.1 | 1.5 | 0.7 |
| Total stockholders’ equity | 642,158,181 | 635,434,364 | 6,723,817 | 1.1 | 68.1 | 59.2 |
| Total liabilities & stockholders’ equity | 943,053,242 | 1,073,162,079 | (130,108,837) | -12.1 | 100.0 | 100.0 |
Table 4: Comparative Balance Sheets – 2003 & 2002
5.4.1 Horizontal Analysis:
- In 2003, the total current assets decreased Tk. 109,146,999, while total current liabilities decreased Tk. 115,358,329.
- The fixed & long-term assets decreased Tk. 20,961,838 while the long-term liabilities decreased Tk. 21,474,325.
- Total assets have decreased Tk. 130,108,837, while total liabilities have decreased Tk. 136,832,654.
- The current assets decreased by 24.5%, while the current liabilities decreased by 29.3%. Though current liabilities are decreasing, the high decrease rate of current assets can be a major threat to the company.
- The cash and cash equivalents decreased by 50.1%. This could be very harmful for the company
- The long-term liabilities decreased by 48.8%.
- Overall, the decrease in total assets is 12.1%, whereas, the decrease in total liabilities is 31.3%.
- The change in total fixed & long-term assets & total stockholders’ equity was not much.
5.4.2 Vertical Analysis:
- The stock of raw and packing materials decreased from being 14.3% to 11.6% of the total assets.
- The cash and cash equivalent did decrease from being 5.2% to 3.1% of the total assets.
- The current liabilities decreased from 36.7% to 29.5% of the total equities (liabilities & stockholders’ equity)
- The total liabilities decreased from being 40.8% to 31.9% of the total equities.
- Finally, the vertical analysis shows, the percentage of stockholder financing to total assets of the company increased from 59.2% to 68.1%.
We can finally conclude that, though the decrease in the company’s liabilities is good but the simultaneous decrease rate of the assets is very harmful.
6. Analysis of the Profit & Loss Account
6.1 Comparative Profit & Loss Account – 2006 & 2005 :
December 31 | Increase or (Decrease) 2006 over 2005 | Percent of Net Sales | ||||
2006 | 2005 | Taka | Percent | 2006 | 2005 | |
| Sales (net of VAT) | 950,502,498 | 685,713,532 | 264,788,966 | 38.6 | 100.0 | 100.0 |
| Less: Cost of goods sold | (620,643,737) | (223,800,333) | 36.1 | -88.8 | -90.5 | |
| Gross Profit/(Loss) | 106,058,428 | 65,069,795 | 40,988,633 | 63.0 | 11.2 | 9.5 |
| Less: Expenses: | ||||||
| Administrative | (21,341,906) | (18,614,660) | (2,727,246) | 14.7 | -2.7 | |
| Selling and distribution | (7,723,865) | (7,774,899) | 51,034 | -0.7 | -0.8 | -1.1 |
| Total expenses | (29,065,771) | (26,389,559) | (2,676,212) | 10.1 | -3.1 | -3.9 |
| Trading Profit/(Loss) | 76,992,657 | 38,680,236 | 38,312,421 | 99.1 | 8.1 | 5.6 |
| Less: Financial charges | (17,559,894) | (21,573,826) | 4,013,932 | -18.6 | -1.9 | -3.2 |
| Operating profit/(loss) before other income | 59,432,763 | 17,106,410 | 42,326,353 | 247.4 | 6.3 | 2.5 |
| Add: Other income | 6,179,916 | 4,802,640 | 1,377,276 | 28.7 | 0.7 | 0.7 |
| Operating profit/(loss) before income tax & workers’ profit participation fund | 65,612,679 | 21,909,050 | 43,703,629 | 199.5 | 6.9 | 3.2 |
| Less: Contribution to workers’ profit participation fund (@5%) | (3,280,634) | (1,095,452) | (2,185,182) | 199.5 | -0.4 | -0.2 |
| Net profit/(loss) before tax | 62,332,045 | 20,813,598 | 41,518,447 | 199.5 | 6.6 | 3.0 |
| Less: Provision for income tax | ||||||
| Current year | (18,700,000) | (18,700,000) | -2.0 | 0.0 | ||
| Deferred tax | (2,500,000) | (2,500,000) | -0.3 | 0.0 | ||
| Total tax | (21,200,000) | (21,200,000) | -0.3 | 0.0 | ||
| Net profit after tax | 41,132,045 | 20,813,598 | 20,318,447 | 97.6 | 4.3 | 3.0 |
| Unappropriated profit brought forward | 1,377,465 | (9,936,133) | 11,313,598 | -113.9 | ||
| Profit/(loss) available for appropriation | 42,509,510 | 10,877,465 | 31,632,045 | 290.8 |
|
|
| Appropriation: |
|
| ||||
| Transferred from dividend equalization fund | ||||||
| Less: Proposed dividend | (28,500,000) | (9,500,000) | (19,000,000) | 200.0 | ||
| Transferred to dividend equalization fund | (12,500,000) | (12,500,000) | ||||
| Dividend distribution tax | ||||||
(41,000,000) | (9,500,000) | (31,500,000) | 331.6 | |||
| Unappropriated profit for the year transferred to statement changes in shareholder’s equity | 1,509,510 | 1,377,465 | 132,045 | 9.6 |
|
|
Table 5: Comparative Profit & Loss Account – 2006 & 2005
6.1.1 Horizontal Analysis:
- Net sales increased by 38.6% in 2006.
- Gross profit increased by 63%.
- Expenses increased by 10.1%.
- Trading profit increased by 99.1%.
- Financial charges decreased by 18.6%.
- Operating profit before other income increased by 247.4%.
- Other income increased by 28.7%.
- Operating profit before income tax & worker’s profit participation fund, contribution to worker’s profit participation fund & net profit before tax increased by 199.5%.
- The company paid income tax of total Tk. 21,200,000.
- Net profit after tax increased by 97.6%
- Proposed dividend increased by 200%.
- Finally, the unappropriated profit for the year increased by 9.6%
6.1.2 Vertical Analysis:
- The gross profit increased from being 9.5% to 11.2% of the net sales.
- The expenses decreased from being 3.9% to 3.1% of the net sales.
- The trading profit increased from being 5.6% to 8.1% of the net sales.
- The operating profit before other income increased from being 2.5% to 6.3% of the net sales.
- Other income remained the same portion of the net sales.
- Operating profit before income tax & worker’s profit participation fund increased from being 3.2% to 6.9%.
- Contribution to worker’s profit participation fund increased from being 0.2% to 0.4% of the net sales.
- Net profit before tax increased from being 3% to 6.6% of the net sales.
- Net profit after tax increased from being 3% to 4.3% of the net sales.
So, we can conclude that, financially 2006 was a much better year than 2005 as the net income had increased significantly.
6.2 Comparative Profit & Loss Account – 2005 & 2004 :
December 31 | Increase or (Decrease) 2005 over 2004 | Percent of Net Sales | |||||
2005 | 2004 | Taka | Percent | 2005 | 2004 | ||
| Sales (net of VAT) | 685,713,532 | 466,480,439 | 219,233,093 | 47.0 | 100.0 | 100.0 | |
| Less: Cost of goods sold | (620,643,737) | (435,232,440) | (185,411,297) | 42.6 | -90.5 | -93.3 | |
| Gross Profit/(Loss) | 65,069,795 | 31,247,999 | 33,821,796 | 108.2 | 9.5 | 6.7 | |
31,247,999 | |||||||
| Less: Expenses: | |||||||
| Administrative | (18,614,660) | (18,279,503) | (335,157) | 1.8 | -2.7 | -3.9 | |
| Selling and distribution | (7,774,899) | (14,792,401) | 7,017,502 | -47.4 | -1.1 | -3.2 | |
| Total expenses | (26,389,559) | (33,071,904) | 6,682,345 | -20.2 | -3.8 | -7.1 | |
|
| ||||||
| Trading Profit/(Loss) | 38,680,236 | (1,823,905) | 40,504,141 | -2220.7 | 5.6 | -0.4 | |
| Less: Financial charges | (21,573,826) | (25,264,715) | 3,690,889 | -14.6 | -3.1 | -5.4 | |
| |||||||
| Operating profit/(loss) before other income | 17,106,410 | (27,088,620) | 44,195,030 | -163.1 | 2.5 | -5.8 | |
| Add: Other income | 4,802,640 | 3,049,809 | 1,752,831 | 57.5 | 0.7 | 0.7 | |
| Operating profit/(loss) before income tax & workers’ profit participation fund | 21,909,050 | (24,038,811) | 45,947,861 | -191.1 | 3.2 | -5.2 | |
| Less: Contribution to workers’ profit participation fund (@5%) | (1,095,452) | – | (1,095,452) | -0.2 | 0.0 | ||
| |||||||
| Net profit/(loss) before tax | 20,813,598 | (24,038,811) | 44,852,409 | -186.6 | 3.0 | -5.2 | |
| Less: Provision for income tax |
| ||||||
| Current year | |||||||
| Deferred tax |
| ||||||
| Total tax |
| ||||||
| Net profit after tax | 20,813,598 | (24,038,811) | 44,852,409 | -186.6 | 3.0 | -5.2 | |
| Unappropriated profit brought forward | (9,936,133) | 14,102,678 | (24,038,811) | -170.5 | |||
| Profit/(loss) available for appropriation | 10,877,465 | (9,936,133) | 20,813,598 | -209.5 |
|
| |
| Appropriation: |
| ||||||
| Transferred from dividend equalization fund |
| 10,450,000 | (10,450,000) | -100.0 | |||
| Less: Proposed dividend | (9,500,000) | (9,500,000) | – | 0.0 | |||
| Transferred to dividend equalization fund | |||||||
| Dividend distribution tax | (950,000) | 950,000 | |||||
(9,500,000) | – | (9,500,000) | |||||
| Unappropriated profit for the year transferred to statement changes in shareholder’s equity | 1,377,465 | (9,936,133) | 11,313,598 | -113.9 | |||
Table 6: Comparative Profit & Loss Account – 2005 & 2004
6.2.1 Horizontal Analysis:
- Net sales increased by 47% in 2006.
- Gross profit increased by 108.2%.
- Expenses decreased by 20.2%.
- Trading profit increased by 2220.7%.
- Financial charges decreased by 14.6%.
- Operating profit before other income increased by 163.1%.
- Other income increased by 57.5%.
- Operating profit before income tax & worker’s profit participation fund, increased by 191.1%.
- Net profit before tax increased by 186.6%.
- Net profit after tax increased by 186.6%
- Proposed dividend remained unchanged.
- Finally, the unappropriated profit for the year increased by 113.9%
6.2.2 Vertical Analysis:
- The gross profit increased from being 6.7% to 9.5% of the net sales.
- The expenses decreased from being 7.1% to 3.8% of the net sales.
- The trading profit became 5.6% of the net sales
- Operating profit before income became 2.5% of the net sales.
- Other income remained the same portion of the net sales.
- Operating profit before income tax & worker’s profit participation fund became 3.2% of net sales
- Contribution to worker’s profit participation fund became 0.2% of net sales.
- Net profit before tax became 3% of the net sales.
- Net profit after tax became 3% of the net sales.
So, we can conclude that, as there was a loss in the year 2004, 2005 was a good financial year for the company as they started earning profit again.
6.3 Comparative Profit & Loss Account – 2004 & 2003:
December 31 | Increase or (Decrease) 2004 over 2003 | Percent of Net Sales | |||||
2004 | 2003 | Taka | Percent | 2004 | 2003 | ||
| Sales (net of VAT) | 466,480,439 | 637,874,790 | (171,394,351) | -26.9 | 100.0 | 100.0 | |
| Less: Cost of goods sold | (435,232,440) | (564,693,010) | 129,460,570 | -22.9 | -93.3 | -88.5 | |
| Gross Profit/(Loss) | 31,247,999 | 73,181,780 | (41,933,781) | -57.3 | 6.7 | 11.5 | |
| Less: Expenses: | |||||||
| Administrative | (18,279,503) | (21,620,158) | 3,340,655 | -15.5 | -3.9 | -3.4 | |
| Selling and distribution | (14,792,401) | (18,153,928) | 3,361,527 | -18.5 | -3.2 | -2.8 | |
| Total expenses | (33,071,904) | (39,774,086) | 6,702,182 | -16.9 | -7.1 | -6.2 | |
| Trading Profit/(Loss) | (1,823,905) | 33,407,694 | (35,231,599) | -105.5 | -0.4 | 5.2 | |
| Less: Financial charges | (25,264,715) | (18,824,654) | (6,440,061) | 34.2 | -5.4 | -3.0 | |
|
| ||||||
| Operating profit/(loss) before other income | (27,088,620) | 14,583,040 | (41,671,660) | -285.8 | -5.8 | 2.3 | |
| Add: Other income | 3,049,809 | 3,494,662 | (444,853) | -12.7 | 0.7 | 0.5 | |
|
| ||||||
| Operating profit/(loss) before income tax & workers’ profit participation fund | (24,038,811) | 18,077,702 | (42,116,513) | -233.0 | -5.2 | 2.8 | |
| Less: Contribution to workers’ profit participation fund (@5%) | (903,885) | 903,885 | -100.0 | 0.0 | -0.1 | ||
|
| ||||||
| Net profit/(loss) before tax | (24,038,811) | 17,173,817 | (41,212,628) | -240.0 | -5.2 | 2.7 | |
| Less: Provision for income tax | |||||||
| Current year | |||||||
| Deferred tax | |||||||
| Net profit after tax | (24,038,811) | 17,173,817 | (41,212,628) | -240.0 | -5.2 | 2.7 | |
| Unappropriated profit brought forward | 14,102,678 | 7,378,861 | 6,723,817 | 91.1 | |||
|
| ||||||
| Profit/(loss) available for appropriation | (9,936,133) | 24,552,678 | (34,488,811) | -140.5 |
|
| |
| Appropriation | |||||||
| Transferred from dividend equalization fund | 10,450,000 | 10,450,000 | |||||
| Less: Proposed dividend | (9,500,000) | (9,500,000) | 0.0 | ||||
| Transferred to dividend equalization fund | (950,000) | – | 0.0 | ||||
| Dividend distribution tax | (950,000) | ||||||
– | (10,450,000) | 10,450,000 | -100.0 | ||||
| Unappropriated profit for the year transferred to statement changes in shareholder’s equity | (9,936,133) | 14,102,678 | (24,038,811) | -170.5 |
|
| |
Table 7: Comparative Profit & Loss Account – 2004 & 2003
6.3.1 Horizontal Analysis:
- Net sales decreased by 26.9% in 2004.
- Gross profit decreased by 57.3%.
- Expenses decreased by 16.9%.
- Trading profit decreased by 105.5%.
- Financial charges increased by 34.2%.
- Operating profit before other income decreased by 285.8%.
- Other income decreased by 12.7%.
- Operating profit before income tax & worker’s profit participation fund decreased by 233%.
- There was no contribution to the workers; profit participation fund in 2004.
- The net profit before tax and after tax decreased by 240%.
- The company paid no income tax in the years 2004 & 2003.
- Dividend distribution tax of Tk. 950,000 was paid in 2004.
- Finally, the unappropriated profit for the year decreased by 170.5%
6.3.2 Vertical Analysis:
- The gross profit decreased from being 11.5% to 6.7% of the net sales.
- The expenses increased from being 6.2% to 7.1% of the net sales.
- The trading profit gained a negative value in 2004 as there was a loss.
- The operating profit before other income gained a negative value in 2004 because of loss.
- Other income increased from being 0.5% to 0.7% of the net sales.
- Operating profit before income tax & worker’s profit participation fund gained a negative value in 2004.
- Net profit before tax and after tax both gained a negative value in 2004 as there was a loss.
The economic year of 2004 was depressin for the company. They suffered a loss due to unprecedented flood affecting the whole nation for over three months. Due to prolonged stagnation of water, all major roads were damaged which disrupted total surface communication network. They lost three months of effective selling time. Frequent devaluation of currency also affected the import of clinkers.
6.4Comparative Profit & Loss Account – 2003 & 2002 :
December 31 | Increase or (Decrease) 2003 over 2002 | Percent of Net Sales | |||||
2003 | 2002 | Taka | Percent | 2004 | 2003 | ||
| Sales (net of VAT) | 637,874,790 | 402,836,313 | 235,038,477 | 58.3 | 100.0 | 100.0 | |
| Less: Cost of goods sold | (564,693,010) | (401,078,555) | (163,614,455) | 40.8 | -88.5 | -99.6 | |
| Gross Profit/(Loss) | 73,181,780 | 1,757,758 | 71,424,022 | 4063.4 | 11.5 | 0.4 | |
| Less: Expenses: | |||||||
| Administrative | (21,620,158) | (11,748,158) | (9,872,000) | 84.0 | -3.4 | -2.9 | |
| Selling and distribution | (18,153,928) | (20,432,531) | 2,278,603 | -11.2 | -2.8 | -5.1 | |
| Total Profit | (39,774,086) | (32,180,689) | (7,593,397) | 23.6 | -6.2 | -8.0 | |
| Trading Profit/(Loss) | 33,407,694 | (30,422,931) | 63,830,625 | -209.8 | 5.2 | -7.6 | |
| Less: Financial charges | (18,824,654) | (11,040,297) | (7,784,357) | 70.5 | -3.0 | -2.7 | |
|
| ||||||
| Operating profit/(loss) before other income | 14,583,040 | (41,463,228) | 56,046,268 | -135.2 | 2.3 | -10.3 | |
| Add: Other income | 3,494,662 | 1,916,098 | 1,578,564 | 82.4 | 0.5 | 0.5 | |
|
| ||||||
| Operating profit/(loss) before income tax & workers’ profit participation fund | 18,077,702 | (39,547,130) | 57,624,832 | -145.7 | 2.8 | -9.8 | |
| Less: Contribution to workers’ profit participation fund (@5%) | (903,885) | (903,885) | -0.1 | 0.0 | |||
|
| ||||||
| Net profit/(loss) before tax | 17,173,817 | (39,547,130) | 56,720,947 | -143.4 | 2.7 | -9.8 | |
| Less: Provision for income tax | |||||||
| Current year | |||||||
| Deferred tax | |||||||
| Net profit after tax | 17,173,817 | (39,547,130) | 56,720,947 | -143.4 | 2.7 | -9.8 | |
| Uappropriated profit brought forward | 7,378,861 | 46,925,991 | (39,547,130) | -84.3 | |||
|
| ||||||
| Profit/(loss) available for appropriation | 24,552,678 | 7,378,861 | 17,173,817 | 232.7 |
|
| |
| Appropriation | |||||||
| Transferred from dividend equalization fund | |||||||
| Less: Proposed dividend | (9,500,000) | (9,500,000) | |||||
| Transferred to dividend equalization fund | (950,000) | (950,000) | |||||
| Dividend distribution tax | |||||||
(10,450,000) | (10,450,000) | ||||||
| Unappropriated profit for the year transferred to statement changes in shareholder’s equity | 14,102,678 | 7,378,861 | 6,723,817 | 91.1 |
|
| |
6.4.1 Horizontal Analysis:
- Net sales increased by 58.3% in 2003.
- Gross profit increased by 11.5%.
- Expenses increased by 23.6%.
- Trading profit acquired a positive value by as there was a loss in 2002.
- Financial charges increased by 70.5%.
- Operating profit before other income acquired a positive value also.
- Other income increased by 82.4%.
- Operating profit before income tax & worker’s profit participation fund & net profit before tax also acquired positive values.
- Tk. 903,885 was paid as the contribution to worker’s profit participation fund.
- The company paid no income tax in both of the years.
- Net profit after tax acquired a positive value.
- Tk. 9,500,000 was appropriated for proposed dividend.
- Finally, the unappropriated profit for the year increased by an astonishing 232.7%.
6.4.2 Vertical Analysis:
- The gross profit increased from being 0.4% to 11.5% of the net sales.
- The expenses decreased from being 8% to 6.2% of the net sales.
- The trading profit was 5.2% of the net sales in 2003.
- The operating profit before other income was 2.3% of the net sales in 2003.
- Other income remained the same portion of the net sales.
- Operating profit before income tax & worker’s profit participation fund was 2.8% of the net sales in 2003
- Contribution to worker’s profit participation fund was only 0.1% of the net sales in 2003 though none was paid in 2002.
- Net profit before and after tax was 2.7% of the net sales in 2003.
As, there was loss in the year 2002, the financial position of the company in the year 2003 can be considered good as the company started profiting again.
7. Trend Percentages
2002 | 2003 | 2004 | 2005 | 2006 | |
| Sales (net of VAT) | 100% | 73% | 107% | 149% | |
| Cost of goods sold | 100% | 77% | 110% | 150% | |
| Gross Profit/(Loss) | 100% | 43% | 89% | 145% | |
| Operating Expenses | 100% | 83% | 66% | 73% | |
| Trading Profit/(Loss) | 100% | -5% | 116% | 230% | |
| Financial charges | 100% | 134% | 115% | 93% | |
| Operating profit/(loss) before other income | 100% | -186% | 117% | 408% | |
| Other income | 100% | 87% | 137% | 177% | |
| Operating profit/(loss) before income tax & workers’ profit participation fund | 100% | -133% | 121% | 363% | |
| Contribution to workers’ profit participation fund (@5%) | 100% | 0% | 121% | 363% | |
| Net profit/(loss) before tax | 100% | -140% | 121% | 363% | |
| Provision for income tax | |||||
| Net profit/(loss) after tax | 100% | -140% | 121% | 240% |
Table 9: Trend Percentages of the Income Statement 2003-2006
- * As there was a loss in the year 2002, it could not be used as a base year.
- ** Due to loss in the year 2004, the trend percentage does not show a consistent upward trend.
- As we can see, excluding 2004, as the company suffered a loss that year, the sales of the Confidence Cement Ltd. is increasing every year.
- Cost of goods sold also shows an upward trend except in the year 2004.
- The gross profit in 2005 was however less than 2003. However, it increased in the year 2006.
- The trading profit also shows a very good upward trend.
- The trend of the financial charges is not consistent.
- Operating profit before income in the year 2006 is a very good sign telling us that the company is indeed moving forward.
- Both the net profit before tax and after tax shows upward trend.
If we exclude the year 2004 from our consideration, as there was a flood which caused the company to suffer a loss, we can conclude that the company’s trend percentages show a definite growth.
8. Ratio Analysis
Ratios are expressions of logical relationships between certain items in the financial statements. This part of the report will analyze four kinds of ratios of the Confidence Cement Ltd. These are,
- Liquidity Ratios
- Equity or Long-Term Solvency Ratios
- Profitability Ratios
- Markets Tests
8.1 Liquidity Ratios:
Liquidity ratios are used to indicate a company’s short-term debt paying ability. These ratios show interested parties the company’s capacity to meet maturing current liabilities.
8.1.1 Current or Working Capital Ratio:
The current ratio indicates the ability of a company to pay its current liabilities from current assets and thus shows the strength of a company’s working capital position. Short-term creditors are particularly interested in the current ratio since the conversion of inventories and accounts receivable into cash is the primary source from which the company obtains the cash to pay short-term creditors. Long-term creditors are also interested in the current ratio because a company that is unable to pay short-term debts maybe forced into bankruptcy.
| Year | 2002 | 2003 | 2004 | 2005 | 2006 |
| Current assets (a) | 444,912,117 | 335,765,118 | 357,315,225 | 482,826,702 | 424,937,956 |
| Current liabilities (b) | 393,739,786 | 278,381,457 | 329,088,697 | 429,290,269 | 362,205,475 |
| Working capital (a-b) | 51,172,331 | 57,383,661 | 28,226,528 | 53,536,433 | 62,732,481 |
| Current ratio (a÷b) | 1.13:1 | 1.21:1 | 1.09:1 | 1.12:1 | 1.17:1 |
| Industry Average | 0.98:1 | 0.76:1 | 0.67:1 | 0.75:1 | 0.77:1 |
As we can see, the current ratio of the company has been quite consistent during the past five years. It does not show any fixed upward or downward trend. The same can be said about the overall industry. But the company has a slightly good current ratio ha the industry, meaning it has the ability to pay its current debts easily.
8.1.2 Acid-Test (Quick) Ratio:
The acid-test ratio is the ratio of quick assets (cash, marketable securities and net receivables) to current liabilities. Inventories and prepaid expenses are excluded from the current assets to compute quick assets because they might not be readily convertible into cash. Short-term creditors are particularly interested in this ratio, since it relates the “pool” of cash and immediate cash inflows to immediate cash outflows.
| Year | 2002 | 2003 | 2004 | 2005 | 2006 |
| Quick assets (a) | 204,400,369 | 156,758,135 | 190,096,450 | 265,459,277 | 255,582,815 |
| Current liabilities (b) | 393,739,786 | 278,381,457 | 329,088,697 | 429,290,269 | 362,205,475 |
| Net quick assets (a-b) | (189,339,417) | (121,623,322) | (138,992,247) | (163,830,992) | (106,622,660) |
| Acid-test ratio (a÷b) | 0.52:1 | 0.56:1 | 0.58:1 | 0.62:1 | 0.71:1 |
| Industry Average | 0.48:1 | 0.29:1 | 0.29:1 | 0.33:1 | 0.65:1 |
The acid-test ratios of the past five years tell us that, the company cannot pay its current debts with the help of its quick assets or assets which can be readily converted into cash. The ratio of the overall industry is even worse. But the company’s quick ratio is getting better every year.
8.1.3 Accounts Receivable Turnover:
| Year | 2002 | 2003 | 2004 | 2005 | 2006 |
| Net sales (a) | 402,836,313 | 637,874,790 | 466,480,439 | 685,713,532 | 950,502,498 |
| Average net accounts receivable (b) | 57,776,170 | 86,772,341 | 106,799,934 | 134,238,819 | 146,289,346 |
| Accounts receivable turnover (a÷b) | 6.97 | 7.35 | 4.36 | 5.11 | 6.50 |
| Industry Average | 13.15 | 8.97 | 6.89 | 8.51 | 9.82 |
The turnover ratio provides an indication of how quickly the receivables are being collected. For example, in 2006, Confidence Cement Ltd. collected its accounts receivables slightly more than 6 times per year. The turnover ratio of the Confidence Cement Ltd. does not show any specific upward or downward trend. The same can be said about the industry. But the industry’s turnover ratio is better than Confidence Cement Ltd.
8.1.4 Number of Day’s Sales in Accounts Receivable:
| Year | 2002 | 2003 | 2004 | 2005 | 2006 |
| Accounts receivable turnover | 6.97 | 7.35 | 4.36 | 5.11 | 6.50 |
| Number of Days’ Sales in Account Receivable | 52.37 | 49.66 | 83.72 | 71.43 | 56.15 |
| Industry Average | 41.5 | 59.68 | 100.55 | 57.78 | 40.03 |
The number of days’ sales in accounts receivable ratio measures the average liquidity of accounts receivable and gives an indication of their quality. Generally, the shorter the collection period, the higher the quality of receivables. In 2004, both the company and the industry had long collection period, because of a nationwide flood. After that both the company and the industry has managed to shorten their collection period.
8.1.5 Inventory Turnover:
| Year | 2002 | 2003 | 2004 | 2005 | 2006 |
| Cost of goods sold (a) | 401,078,555 | 564,693,010 | 435,232,440 | 620,643,737 | 844,444,070 |
| Average inventory (b) | 213,434,765 | 209,759,366 | 173,112,879 | 192,293,100 | 193,211,283 |
| Inventory turnover (a÷b) | 1.88:1 | 2.69:1 | 2.51:1 | 3.23:1 | 4.37:1 |
| Industry Average | 6.59:1 | 8.4:1 | 4.44:1 | 5.64:1 | 6.75:1 |
A company’s inventory turnover shows the number of times its average inventory is sold during a period. A manager who is able to maintain the highest inventory turnover ratio is considered the most efficient. But then again, if a company that achieves high inventory turnover ratio by keeping extremely small inventories on hand may incur larger ordering costs, lose quantity discounts and lose sales due to lack of adequate inventory. So, in order to earn satisfactory income, management must balance the costs of inventory storage and obsolescence and the cost of tying up funds in inventory against possible losses of sales and other costs associated with keeping too little inventory in hand. Confidence Cement Ltd. has managed to increase its inventory turnover every year. But the inventory turnover of the industry has been much better than the company during the last 5 years.
8.1.6 Total Assets Turnover:
| Year | 2002 | 2003 | 2004 | 2005 | 2006 |
| Net sales (a) | 402,836,313 | 637,874,790 | 466,480,439 | 685,713,532 | 950,502,498 |
| Average total assets (b) | 1,033,959,321 | 1,008,107,661 | 939,947,301 | 995,243,025 | 1,029,458,489 |
| Total assets turnover (a÷b) | 0.39:1 | 0.63:1 | 0.50:1 | 0.69:1 | 0.92:1 |
| Industry Average | 0.83:1 | 0.74:1 | 0.43:1 | 0.88:1 | 1.03:1 |
This ratio measures the efficiency with which a company uses its assets to generate sales. For example, in 2006, each taka of assets in Confidence Cement Ltd produced Tk. 0.92 sales. The larger the total assets turnover, the larger will be the income on each dollar invested in the assets of the business. The assets turnover ratio has increased over the years except for 2004. But a ratio less than 1 is not good enough for any company. On other hand, since 2002 to 2004 the assets turnover ratio of the industry showed a downward trend but it started to increase from 2005. Except for the year 2004, the ratio of the industry was better than the company.
8.2 Equity or Long-Term Solvency Ratios:
Equity or long-term solvency ratios show the relationship between debt and equity financing in a company.
8.2.1 Equity (Stockholders’ Equity) Ratio:
| Year | 2002 | 2003 | 2004 | 2005 | 2006 |
| Stockholder’s equity (a) | 635,434,364 | 642,158,181 | 607,669,370 | 619,932,968 | 632,565,013 |
| Total assets (b) | 1,073,162,079 | 943,053,242 | 936,841,360 | 1,053,644,690 | 1,005,272,287 |
| Equity ratio (a÷b) | 0.59 | 0.68 | 0.65 | 0.58 | 0.63 |
| Industry Average | 0.53 | 0.50 | 0.46 | 0.29 | 0.60 |
The equity ratio indicates the proportion of total assets (or total equities) provided by stockholders (owners) on any given date. From a creditor’s point of view, a high proportion of stockholders’ equity is desirable as it indicates the existence of a large protective buffer for creditors in the event a company suffers loss. But from an owner’s point of view, a high proportion of stockholders’ equity may or may not be desirable. If borrowed funds can be used by the business generate income in excess of the net after-tax cost of the interest on such borrowed funds, a lower percentage of stockholders’ equity may be desirable. The equity ratios of both the company and the industry are low which is good for the owners as they can use the borrowed funds to generate income.
8.2.2 Stockholders’ Equity to Debt Ratio:
| Year | 2002 | 2003 | 2004 | 2005 | 2006 |
| Stockholder’s equity (a) | 635,434,364 | 642,158,181 | 607,669,370 | 619,932,968 | 632,565,013 |
| Total debt (b) | 437,727,715 | 300,895,061 | 329,171,990 | 433,711,722 | 372,707,274 |
| Equity ratio (a÷b) | 1.45:1 | 2.13:1 | 1.85:1 | 1.43:1 | 1.70:1 |
| Industry Average | 1.05:1 | 0.77:1 | 0.70:1 | 0.65:1 | 0.87:1 |
The relative equities of owners and creditors can be expressed by this ratio. As we can see, the ratios of both the company and the industry do not follow a specific trend. But the company’s ratios are higher than the overall industry.
8.3 Profitability Tests:
Profitability is an important measure of a company’s operating success. Two areas are given focus while judging profitability: (1) relationship on the income statement that indicate a company’s ability to recover costs and expenses and, (2) relationships of income to various balance sheet measures that indicate the company’s relative ability to earn income on assets employed.
8.3.1 Rate of Return on Operating Assets:
| Year | 2002 | 2003 | 2004 | 2005 | 2006 |
| Net operating income (a) | (41,463,228) | 14,583,040 | (27,088,620) | 17,106,410 | 59,432,763 |
| Operating assets (b) | 944,406,586 | 872,776,599 | 861,130,732 | 937,528,748 | 898,384,117 |
| Rate of return on operating assets (a÷b) | -4.4% | 1.67% | -3.14% | 1.82% | 6.62% |
| Industry Average | -6.2% | -9.66% | -7.67% | -4.29% | -4.0% |
This ratio is designed to show the earning power of the company as a bundle of assets. By disregarding both non-operating assets and non-operating income elements, the rate of return on operating assets measures the profitability of the company in carrying out business functions.
As we can see, Confidence Cement Ltd. had a negative ratio in 2002 and 2004. But right now it is going upward. On the other hand, the cement industry has had a negative ratio for the past 5 years.
The ratio can be broken down into two elements- the operating margin & the turnover of operating assets
8.3.2 Operating Margin:
| Year | 2002 | 2003 | 2004 | 2005 | 2006 |
| Net operating income (a) | (41,463,228) | 14,583,040 | (27,088,620) | 17,106,410 | 59,432,763 |
| Net sales (b) | 402,836,313 | 637,874,790 | 466,480,439 | 685,713,532 | 950,502,498 |
| Operating margin (a÷b) | -10.29% | 2.29% | -5.81% | 2.49% | 6.25% |
| Industry Average | -5.56% | -4.76% | -11.23% | -0.44% | 4.02% |
Operating margin reflects the percentage of each taka of net sales that becomes net operating income. As we can see, except for in 2004, the operating margin of Confidence Cement Ltd. is increasing every year. That means more and more net sales are turning into net operating income. The same can be said for the overall industry. But the ratio of the overall industry only got positive in the year 2006.
8.3.3 Turnover of Operating Assets:
| Year | 2002 | 2003 | 2004 | 2005 | 2006 |
| Net sales (a) | 402,836,313 | 637,874,790 | 466,480,439 | 685,713,532 | 950,502,498 |
| Operating assets (b) | 944,406,586 | 872,776,599 | 861,130,732 | 937,528,748 | 898,384,117 |
| Turnover of operating assets (a÷b) | 0.43:1 | 0.73:1 | 0.54:1 | 0.73:1 | 1.06:1 |
| Industry Average | 0.76:1 | 0.74:1 | 0.63:1 | 1.01:1 | 1.26:1 |
Turnover of the operating assets shows the amount of sales taka generated for each taka invested in operating assets. Except for the year 2004, the ratio of the company has increased every year, meaning more income is being generated by the money invested. The same thing can be said about the overall industry. But the ratio of the industry is better than Confidence Cement Ltd.
8.3.4 Net Income to Net Sales (Return on Sales) Ratio
| Year | 2002 | 2003 | 2004 | 2005 | 2006 |
| Net income (a) | (39,547,130) | 17,173,817 | (24,038,811) | 20,813,598 | 41,132,045 |
| Net sales (b) | 402,836,313 | 637,874,790 | 466,480,439 | 685,713,532 | 950,502,498 |
| Net income to net sales (a÷b) | -9.82% | 2.69% | -5.15% | 3.04% | 4.33% |
| Industry Average | -8.80% | -9.20% | -14.43% | -4.90% | -13.64% |
This ratio measures the proportion of the sales taka that remains after the deduction of all expenses. The industry has had a negative ratio for past 5 years, which means there was no profit generated by the net sales. But except in 2004, the ratio of the Confidence Cement Ltd. has increased every year.
8.3.5 Net Income to Average Common Stockholders’ Equity:
| Year | 2002 | 2003 | 2004 | 2005 | 2006 |
| Net income (a) | (39,547,130) | 17,173,817 | (24,038,811) | 20,813,598 | 41,132,045 |
| Average common stockholders’ equity (b) | 663,153,609 | 638,795,273 | 624,913,776 | 613,801,169 | 626,248,991 |
| Net income to average common stockholders’ equity (a÷b) | -5.96% | 2.69% | -3.85% | 3.39% | 6.57% |
| Industry Average | -7.11% | -12% | -19.57% | -26.49% | 22.87% |
From the stockholders’ point of view, an important measure of the income-producing ability of a company is the relationship of net income to average common stockholders’ equity. Again, except in 2004, the ratio of the company is increasing day by day which means the company is earning more in return of the stockholders’ equity. This is good news for the stockholders. But unfortunately, that is not the case for the overall industry. The ratio for the industry became positive only in 2006. Until then it had kept on decreasing.
8.3.6 Earnings per Share of Common Stock:
| Year | 2002 | 2003 | 2004 | 2005 | 2006 |
| Earnings available to common stockholders (a) | (39,547,130) | 17,173,817 | (24,038,811) | 20,813,598 | 41,132,045 |
| Weighted-average number of shares (b) | 1,900,000 | 1,900,000 | 1,900,000 | 1,900,000 | 1,900,000 |
| EPS of common stock (a÷b) | -20.81 | 9.51 | -12.65 | 10.95 | 21.65 |
| Industry Average | 7.23 | -4.09 | -14.16 | -3.24 | 31.95 |
His measure is most widely used to appraise a company’s operations. The more the EPS, people are more likely to buy the company’s shares. As we can see in the graph, due to nation-wide flood, the EPS in 2004 had a negative value. But apart from that the EPS of Confidence Cement LTD. is increasing day by day. The same can be said about the overall industry.
8.4 Market Tests:
Market test ratios are computed using the information from the financial statements and information about market price of the company’s stock. These tests help investors and potential investors assess the relative merits of the various stocks in the marketplace.
8.4.1 Earnings Yield on Common stock:
| Year | 2002 | 2003 | 2004 | 2005 | 2006 |
| Earnings per share (EPS) | (11.64) | 9.51 | (12.65) | 10.95 | 21.65 |
| Current market price per share of common stock | 239.75 | 141.75 | 161.75 | 114.75 | 137.75 |
| Earnings yield on common stock | -4.86% | 6.71% | -7.82% | 9.54% | 15.72% |
The increase of the earnings yield on common stock every year is a good sign for the investors. It means buying its share would prove to be profitable.
8.4.2 Price-Earnings Ratio:
| Year | 2002 | 2003 | 2004 | 2005 | 2006 |
| Current market price per share of common stock | 239.75 | 141.75 | 161.75 | 114.75 | 137.75 |
| Earnings per share (EPS) | (11.64) | 9.51 | (12.65) | 10.95 | 21.65 |
| Price-earnings ratio | -20.6:1 | 14.91:1 | -12.79:1 | 10.48:1 | 6.36:1 |
According to the recent data, in 2006, the stock of the Confidence Cement Ltd. was selling at 6.36 times the earning. But this comparison of the ratios since 2002-2006 does not show any specific trend.
8.4.3 Dividend Yield on Common Stock :
| Year | 2002 | 2003 | 2004 | 2005 | 2006 |
| Dividend per share of common stock | 20 | 5 | 5 | 5 | 15 |
| Current market price per share of common stock | 239.75 | 141.75 | 161.75 | 114.75 | 137.75 |
| Dividend yield on common stock | 8.34% | 3.53% | 3.09% | 4.35% | 10.89% |
The dividend paid per share of common stock is also of much interest to common stockholders. In 2006, the shareholders got the highest dividend yield on common stock.
8.4.4 Payout Ratio on Common Stock :
| Year | 2002 | 2003 | 2004 | 2005 | 2006 |
| Dividend per share of common stock | 20 | 5 | 5 | 5 | 15 |
| Earnings per share (EPS) | (11.64) | 9.51 | (12.65) | 10.95 | 21.65 |
| Payout ratio on common stock | -171.82% | 52.58% | 39.53% | 45.66% | 69.28% |
| Industry Average | -40.38% | 83.13% | 57.37%$ | 24.99% | 32.56% |
Figure 19: Payout Ratio 0n Common Stock of Confidence Cement Ltd. & the Industry Average 2002-2006
In 2006, the payout ratio of Confidence Cement Ltd. was 69.28%. This means 69.28% of the company’s earnings were paid as dividends. And we can also that the ratio is increasing every year. But overall, the industry does not have a steady growth in payout ratio on common stock.
9. Conclusion
The future of the cement industry is very bright as Bangladesh is developing, and is in need of variety of construction materials, chiefly cement, for its overall development. The country is also facing rapid urbanization, which in turn means lack of space in the developed cities. Therefore, the multistoried apartment buildings are indispensable. As the country is regularly visited by floods, cement will play a vital role as it is unaffected by water. On the contrary, it hardens when it comes in contact with water. So we can conclude that, the cement industry in Bangladesh is indeed a prospective industry.
Should we buy its shares?
Now the question is, should we invest in this industry or more specifically in Confidence Cement Ltd.? The analysis of the balance sheets and the profit and loss account shows, the assets have sometimes increased and sometimes decreased. The same can be said about liabilities. A steady trend is indeed hard to find. But the profit and loss account shows us a steady increase in profit except 2004. In 2004, due to a nationwide flood, the company suffered loss. The trend percentage also shows the increasing trend of the sales and profit.
Now moving on to the ratios, the liquidity ratios of the company is not at all satisfactory. It means the company does not have sufficient current assets to pay its liabilities. So, if a situation like that occurs, there is a possibility that the company might be bankrupt. The long-term solvency ratios are slightly better. Though in the recent past, many of profitability ratios had negative values, the scenario is changing now. The profitability of the company is increasing day by day.
The current EPS along with the market test ratios is pretty satisfactory. The investors are getting regular dividends and making a profit. The current market price for each share with 100 taka face value is Tk. 338.75. So, considering the fact that the cement industry is a prospective industry, the increase in the amount of exports in the near future and most importantly the current financial position helps us to conclude that, to invest in this company would be profitable in the long-run.
Among the other companies investing in Heidelberg Cement, Lafarge Surma Cement and Meghna Cement would be profitable.