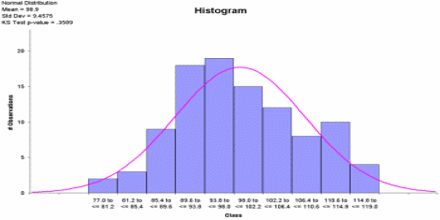
Main lecture of this lecture is to present on how to make Histogram. Histogram is a bar graph that shows the frequency of data within equal intervals. There is no space in between the bars. To make a histogram, follow these steps: on the vertical axis, place frequencies. Label this axis “Frequency”. On the horizontal axis, place the lower value of each interval. Draw a bar extending from the lower value of each interval to the lower value of the next interval.
How to make Histogram?