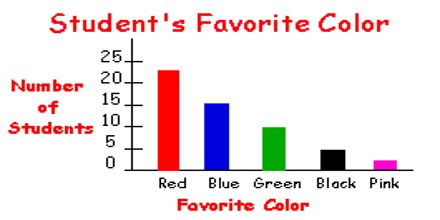
Prime objective of this lecture is to present on Bar Graphs and Histograms. By this lecture you will able to learn about bar graph, double bar graph and Histogram. A Bar Graph (also called Bar Chart) is a graphical display of data using bars of different heights. Bar Graphs are good when your data is in categories (such as “Comedy”, “Drama”, etc). A bar graph can be used to display and compare data. The scale should include all the data values and be easily divided into equal intervals.
Lecture on Bar Graphs and Histograms