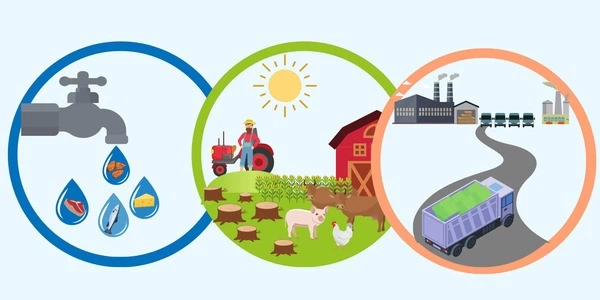
One of the leading causes of population declines among wildlife species is habitat loss, which in many cases leads to extinction. Local species that survive must relocate when trees are cut down to make way for farmland. This type of deforestation is referred to as ‘land-use change,’ and it contributes significantly to climate change because forests are major carbon sinks that remove greenhouse gases from the atmosphere.
The true environmental pressures of our global food system are often obscure and difficult to assess in an age of industrialized farming and complex supply chains.
“Everyone eats food, and more and more people are concerned about the environmental consequences of what they eat,” said Ben Halpern, a marine ecologist at UC Santa Barbara. For many reasons, determining this impact on the planet is a monumental task, including the fact that there are many different foods produced in many different ways, under many different environmental pressures around the world.
Scientists have made significant progress in assessing the environmental impacts of food by pound or kilogram by ranking foods based on factors such as greenhouse gas emissions or water pollution. While these assessments are useful in guiding consumer choices, Halpern explained that a more thorough examination of the environmental footprint — the locations affected by the various pressures from food production and the severity of that pressure — is required for decisions that must be made in a world with a burgeoning population.
“The individual choices of eight billion people add up,” he said, adding that “we need to know the overall impact of total food production – not just per pound – especially when setting food policy.”
The environmental efficiency of producing a particular food type varies spatially, such that rankings of foods by efficiency differ sharply among countries, and this matters for guiding which foods we eat and from where.
Halley Froehlich
To fill that need, Halpern and colleagues at UC Santa Barbara’s National Center for Ecological Analysis & Synthesis (NCEAS) have mapped for the first time the environmental footprint of the production of all foods, both in the ocean and on land. Their research is published in the journal Nature Sustainability.
Lopsided pressures and hidden connections
“Did you know that almost half of all environmental pressures from food production come from just five countries?” Halpern said.
For Halpern, executive director at NCEAS and a professor at UCSB’s Bren School of Environmental Science & Management, understanding the impacts of food production along with the local context of these impacts has been a longstanding interest. By taking detailed data about greenhouse gas emissions, freshwater use, habitat disturbance and nutrient pollution (e.g., fertilizer runoff) generated by 99% of total reported production of aquatic and terrestrial foods in 2017, and mapping those impacts at high resolution, the researchers were able to create a more nuanced picture of the pressures – the inputs, processes and outputs – of global food production.
The findings are eye-opening.
“Cumulative pressures of food production are more concentrated than previously believed, with the vast majority – 92% of pressures from land-based food production – concentrated on just 10% of the Earth’s surface,” noted Melanie Frazier, a research scientist at NCEAS and coauthor of the paper. Additionally, the space required for dairy and beef farming accounts for about a quarter of the cumulative footprint of all food production. And those five countries accounting for almost half of all food production-related environmental pressures? India, China, the United States, Brazil, and Pakistan.

The study also examines the environmental efficiency of each food type, similar to the per-pound of food approach that most other studies use, but now accounting for differences among countries rather than just assuming it is the same everywhere.
“The environmental efficiency of producing a particular food type varies spatially, such that rankings of foods by efficiency differ sharply among countries, and this matters for guiding which foods we eat and from where,” said Halley Froehlich, assistant professor in environmental studies at UCSB and a coauthor of the study.
Production methods are considered by the research team. For example, thanks to technology that reduces greenhouse gas emissions while increasing yields, the United States is more than twice as efficient at producing soy as India (the world’s fifth largest producer), making American soy the more environmentally friendly choice.
The study also reveals connections between land and sea that are missed when only one is examined, resulting in significant environmental pressures. Pigs and chickens have an ocean footprint because they eat marine forage fish like herrings, anchovies, and sardines. The opposite is true for mariculture farms, whose crop-based feeds shift the environmental pressure from fish farms to land.
Examining cumulative pressures can reveal results that individual pressures alone could not have predicted. For example, while cattle require by far the most grazing land, the cumulative pressures of pig farming, which produces significantly more pollution and consumes significantly more water than cattle farming, are slightly greater than those of cows. Pig, cow, rice, wheat, and oil crops are the top five offenders in terms of cumulative pressures.
According to the researchers, major changes to current food systems will be required to feed the world’s growing and increasingly wealthy population while reducing environmental degradation and improving food security. In some cases, farming efficiency may need to be improved; in others, consumers’ food preferences may need to be altered.


