The main objective of this report is to evaluate the financial performance of Mercantile Bank Limited. The report focus also the bank’s all key areas like capital adequacy, quality asset growth, and strong liquidity thereby ensuring sound revenue. Report analysis finds out mercantile bank collect deposit by providing different types attracting deposit product and provide loan by offering different types of investment product.
Banking History of MBL
Mercantile Bank Limited is a third generation bank in Bangladesh. Mercantile Bank has been incorporated on May 20th, 1999 in Head office at 61 Dilkhusha C/A, Dhaka, Bangladesh as a public limited company with the permission of the Bangladesh Bank. Mercantile Bank Limited commenced formal commercial banking operation from June 02, 1999. The founders of MBL are committed to making it a little more different and a bit special qualitatively.
The Authorized Capital of the Bank is BDT 800,000 million and divided into 80,000,000 ordinary shares of BDT 100 each as of 31 December 2009. The Paid -up Capital is BDT 215841 million of 21584134 ordinary shares of face value of BDT 100 each and listed both in DSE & CSE. MBL make it most efficient to meet the needs of the 21st century with assets of BDT 44,940.54 million and more than 1000 employees. The Bank provides a broad range of financial services to its customers and corporate clients in retail banking, corporate banking, and international trade.
The total amount of deposit is BDT 39,348 million and the total loans and advances are BDT 31,877.86 million at the end of the year 2012 that shows a great performance of MBL. The credit-deposit ratio is 81.02%. The net profit after tax at the end of the year 2012 is BDT 540.50 million.
The bank has 10 divisions namely HRD, Credit Division, Development, Marketing Division, Research, and planning division, Information technology division, General banking division, Treasury and money market division,
The opening of the Principal Office was the big leaf forward and successively the opening of the Mothijil Branch expanded the horizon of Mercantile Bank Limited to bring its services to the valued clients more effectively. The second Branch opened at Dhanmondi Residential Area, Dhaka on August 04, 1999. The third branch was opened at Agrabad, Chittagong on November 06, 1999. The bank stood 58 branches all over the country up to October 2012.
Vision, Mission, Objectives, Core values of Mercantile Bank.
- The vision of Mercantile Bank.
- To make a finest corporate citizen.
- To become a leading Banking Institution.
- Play a pivotal role in the development of the country.
- To provide customized services.
The mission of Mercantile Bank.
- Will become most caring, focused for equitable growth based on the diversified deployment of resources, and nevertheless would remain healthy and gainfully profitable Bank.
- To provide the ultimate service in banking.
- Continuous improvement in our Business policies.
- Cost reduction integrations of technology at all level.
Objectives of Mercantile Bank.
- To achieve positive Economic Value Added (EVA) each year.
- To be the market leader in product innovation.
- To be one of the top three Financial Institutions in Bangladesh in terms of cost efficiency.
- To be one of the top five Financial Institutions in Bangladesh in terms of market share in all significant market segments we serve.
- To achieve 20% return on shareholders’ equity or more, on average.
Core values of Mercantile Bank.
- For the customers providing with caring services by being innovative in the development of new banking products and services.
- For the shareholders maximizing the wealth of the Bank.
- For the employees respecting worth and dignity of individual employees devoting their energies to the progress of the Bank.
- For the community Strengthening the corporate values and taking the environment and social risks and reward into account.
The objective of the Study
The specific objective of the study is:
- To evaluate the financial performance of Mercantile Bank Limited.
The methodology of the Study
This study is based on secondary data. Secondary data collected in the following ways-
- Annual Report of Mercantile Bank Limited 2008-2012.
- Different textbook and journals.
- Accounts Department guidelines.
- Various reports and articles related to study.
- The websites of Mercantile Bank Limited.
- Different related booklets and company files and documents.
Different departments of MBL.
There are mainly four departments of MBL-
- General Banking Department.
- Credit department.
- Cash Section. &
- Foreign Exchange Department.
General Banking.
In this department, the general Banking activities like- opening account & related information are provided. The general banking in charge of Mercantile Bank Ltd (Dhanmondi Branch) is Md. Mizanur Rahman.
Credit Section.
Credit department helps the customers through providing bank loans. There are various types of loans handled by different officers. There are secured loan, unsecured loan, SME loan & Home & other loan facilities. The name of cash in charge is Md. Sharower Islam
Cash Section.
Cash section performs the activities of keeping and giving cash to the customer. The person who wants to open an account, have to keep a specific amount of money to the account. Customers can withdraw the cash when the need for a specific period. In cash section, various type of bills like- DESCO bill, ALICO monthly fees are taken from the customers. The name of cash in charge is Md. Kamruzzaman.
Foreign Exchange Department.
Foreign Exchange Department consists of three sections-
- Import section.
- Export Section.
- Remittance Section.
Three departments are organized properly to provide the best facilities to the customers.
Correspondent Relationships.
The Bank has established correspondent relationship across the world with a number of foreign banks namely Citibank N.A., The Bank of Tokyo Mitsubishi Ltd., Standard Chartered Bank, American Express Bank, HSBC, Commerzbank, Commonwealth Bank of Australia, Scotia Bank, Toronto Dominion Bank, Unicredito Italiano, Wachovia Bank, N.A., Hutton National Bank, HypoVereinsbank, Bank Australia, Sumitomoto Mitsui Banking Corp., ING Bank, United Bank of India, ICICI Bank etc. The number of foreign correspondents is 584 as of December 31, 2012. Efforts are being continued to further expand the Correspondent Relationship to facilitate Bank’s growing foreign trade transactions.
Human resource development.
In today’s competitive business environment, only the quality of human resources makes the difference. The bank’s commitment to attracting the best persons to work for its and the adaptation of the latest technologies is reflected in the efforts of the bank in the development of its human resources. In the face of today’s global competition, the bank envisages to develop the highly motivated workforce and to equip them with latest skills and technologies. A good working environment promotes a level of loyalty and commitment, devotion and dedication on the part of the employees.
The bank sent a number of officers to Bangladesh Institute of Bank Management and the other training institutes for specialized training various aspects of banking. The bank is contemplating to set up “Training Institute” for providing facilities to its executive and officers. The bank believes in professional excellence and considers its working force as its most valuable asset and the basis of its efficiency and strength.
Branch Expansion.
The bank commenced its business on June 02, 1999. The first Branch was opened at 61 Dilkusha Commercial Area on the Inauguration Day of the Bank. The second Branch opened at Dhanmondi Residential Area, Dhaka on August 04, 1999. The third branch was opened at Agrabad, Chittagong on November 06, 1999.Now the total number of branches stood at 58 at the end of the month, October 2012.
Foreign Exchange business.
A commercial Bank/MBL is involved in financing foreign trade apart from financing internal credit requirement in the economy. This involves handling of import business through opening L/C and handling of export business. As banking has become very keenly competitive, banks find it convenient to involve in foreign exchange business as a lucrative source of earning income and profit.
Apart from financing foreign trade, Commercial Banks also provide guarantees of various types to their clients. While these facilities clients to undertake jobs assigned to them by various corporations and organization, this enables the bank to earn a commission.
Different Types of product (Scheme & services) of MBL.
Mercantile Bank Limited has different types of the scheme for a customer. These are given below:
- Monthly saving scheme
- Family Maintenance Deposit scheme
- Double benefit deposit scheme
- Special Savings Scheme
- Pension and Family Support Deposit
- Consumers’ Credit Scheme
- Small Loan Scheme
- Lease Finance.
- Doctors’ Credit Scheme
- Rural Development Scheme
- Women Entrepreneurs Development Scheme
- SME Financing Scheme
- Personal Loan Scheme
- Car Loan Scheme
Financial Highlights:
| years Particulars | 2008 Tk in million | 2009 Tk in million | 2010 Tk in million | 2011 Tk in million | 2012 Tk in million |
| Paid up capital | 1199.12 | 1498.90 | 1798.08 | 2158.42 | 4072.21 |
| Total Loans & Advances | 26842.14 | 31877.86 | 43419.36 | 48295.55 | 66377.70 |
| Price earning ratio | 9 times | 12 times | 10 times | 11 times | 14 time |
| Earning per share | 41.22 | 30.05 | 28.53 | 30.67 | 41.04 |
| Income from investment | 369.12 | 764.48 | 520.33 | 696.66 | 919.45 |
| Total asset | 37159.65 | 44940.54 | 55928.72 | 66166.52 | 87140.11 |
| Total deposit | 33317.64 | 39348.00 | 49538.35 | 58033.47 | 75629.14 |
[Source: Annual journal of MBL (From 2008 to 2012)] Figure: Financial highlights
Financial performance analysis
Groups of Financial Ratios:
Financial ratios can be divided into four basic groups or categories:
- Liquidity ratios
- Activity ratios
- Debt ratios &
- Profitability ratios
Liquidity, activity, and debt ratios primarily measure risk, profitability ratios measure return. In the near term, the important categories are liquidity, activity, and profitability, because these provide the information that is critical to the short-run operation of the firm. Debt ratios are used primarily when the analyst is sure that the firm will successfully weather the short run.
Liquidity Ratio:
The liquidity of a business firm is measured by its ability to satisfy its short-term obligations as they come due. Liquidity refers to the solvency of the firm’s overall financial position. The three basic measures of liquidity are-
A. Current Ratio:
One of the most general and frequently used of these liquidity ratios are the current ratio. Organizations use current ratio to measure the firm’s ability to meet short-term obligations. It shows the banks ability to cover its current liabilities with its current assets.
Current Ratio = Current Asset/Current Liabilities
B. Quick Ratio:
The quick ratio is a much more exacting measure than the current ratio. This ratio shows a firm’s ability to meet current liabilities with its most liquid assets.
Quick Ratio=Cash + Government Securities + Receivable / Total Current Liabilities.
C. Net Working Capital:
Net Working Capital, although not actually a ratio is a common measure of a firm’s overall liquidity. A measure of liquidity is calculated by subtracting total current liabilities from total current assets.
Net Working Capital =Total Current Assets –Total Current Liabilities.
Activity Ratio:
Activity ratios measure the speed with which accounts are converted into sale or cash. With regard to current accounts measures of liquidity are generally inadequate because differences in the composition of a firm’s current accounts can significantly affect its true liquidity. A number of ratios are available for measuring the activity of the important current accounts which includes inventory, accounts receivable, and account payable. The activity (efficiency of utilization) of total assets can also be assessed.
A Total Asset Turnover:
The total asset turnover indicates the efficiency with which the firm is able to use all its assets to generate sales.
Total Asset Turnover = Sales/ Total Asset
B Investment to Deposit Ratio:
Investment to Deposit Ratio shows the operating efficiency of a particular Bank in promoting its investment product by measuring the percentage of the total deposit disbursed by the Bank as long & advance or as an investment. The ratio is calculated as follows:
Investment to Deposit Ratio = Total Investments / Total Deposits
Debt Ratio:
The debt position of that indicates the amount of other people’s money being used in attempting to generate profits. In general, the more debt a firm uses in relation to its total assets, the greater its financial leverage, a term used to describe the magnification of risk and return introduced through the use of fixed-cost financings such as debt and preferred stock.
A. Debt Ratio:
The debt ratio measures the proportion of total assets provided by the firm’s creditors.
Debt Ratio = Total Liabilities / Total Assets
B. Equity Capital Ratio:
The ratio shows the position of the Bank’s owner’s equity by measuring the portion of total asset financed by the shareholders invested funds and it is calculated as follows:
Equity Capital Ratio = Total Shareholder’s Equity / Total Assets
C. Time Interest Earned Ratio:
This ratio measures the ability to meet contractual interest payment that means how much the company able to pay interest on their income.
Time Interest Earned Ratio=EBIT/ Interest
Profitability Ratio:
These measures evaluate the bank’s earnings with respect to a given level of sales, a certain level of assets, the owner’s investment, or share value. Without profits, a firm could not attract outside capital. Moreover, present owners and creditors would become concerned about the company’s future and attempt to recover their funds. Owners, creditors, and Management pay close attention to boosting profits due to the great importance placed on earnings in the marketplace.
A. Operating Profit Margin:
The Operating Profit Margin represents what is often called the pure profits earned on each sales dollar. A high operating profit margin is preferred. The operating profit margin is calculated as follows:
Operating Profit Margin = Operating Profit / Sales
B.Net profit Margin:
The net profit margin measures the percentage of each sales dollar remaining after all expenses, including taxes, have deducted. The higher the net profit margin is better. The net profit margin is calculated as follows:
Net profit Margin = Net profit after Taxes / Sales
C. Return on Equity (ROE):
The Return on Equity (ROE) measures the return earned on the owners (both preferred and common stockholders) investment. Generally, the higher this return, the better of the owners.
Return on Equity (ROE) = Net profit after Taxes / Stockholders Equity
D. Price/ Earnings ratio (PE ratio):
The Price/ Earnings ratio (price-to-earnings ratio) of a stock is a measure of the price paid for a share relative to the income or profit earned by the firm per share.
P/E ratio – Price per share/earnings per share
E. Earnings per share (EPS):
EPS represents the dollar amount earned behalf of each outstanding share of common stock.
EPS= Net income/no. of share outstanding
FINANCIAL STATEMENT ANALYSIS OF MBL
Common Size Analysis:
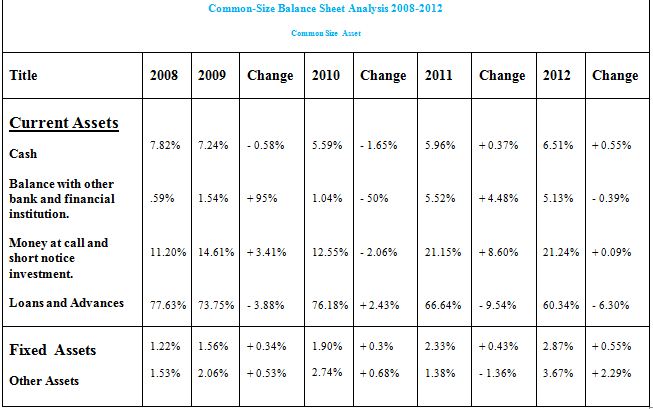
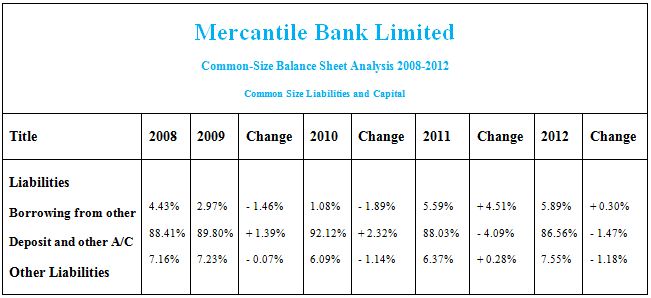
Ratio and Trend Analysis:
Current ratio:
The current ratio, one of the most commonly cited financial ratios, measures the firm’s ability to meet its short-term obligations. The higher the current ratio, the better the liquidity position of the firm. It is expressed as
Current Ratio=Current Asset/Current Liabilities
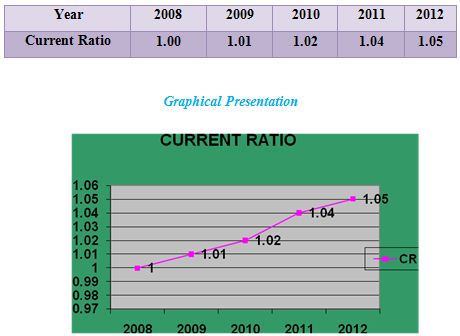
Interpretation:
The graph shows an upward trend in MBL’s current ratio. This indicates that MBL’s has increased its liquidity position and thereby it has reduced the change of being technically insolvent.
Net Working capital:
Networking capital, although not actually a ratio is a common measure of a firm’s overall Liquidity a measure of liquidity ratio calculated by
Net Working capital=Current Asset-Current Liabilities
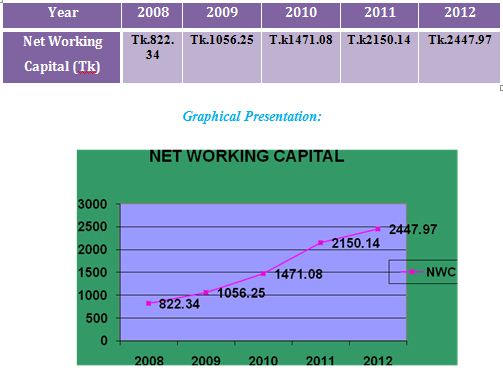
Interpretation:
Networking capital measures the liquidity position of the firm. In 2008 the networking capital was Tk 822.34 million which was gradually increased to Tk 2447.97 million in 2012. The graph shows that increasing trend of MBLs liquidity position this indicates that MBL has increased its ability to pay short-term obligation out of its currents assets.
Cost Income Ratio:
It measures a particular Bank’s operating efficiency by measuring the percent of the total operating income that the Bank spends to operate its daily activities. It is calculated as follows:
Cost Income Ratio=Total operating Expenses/Total Operating Income
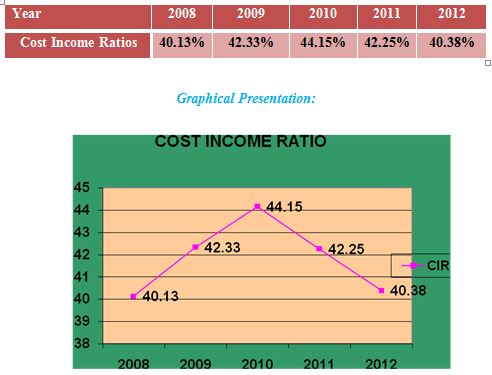
Interpretation
In 2010 the cost income ratio of Mercantile Bank Ltd. is high but after that, it is decreasing. So it can be said that the operating efficiency of the Mercantile Bank Ltd. is becoming good. That means they are successful in minimizing their operating cost.
Total Asset Turnover Ratio:
The total asset turnover indicates the efficiency with which the firm is able to use all its assets to generate income.
Total Asset Turnover= Operating Income/Total Asset
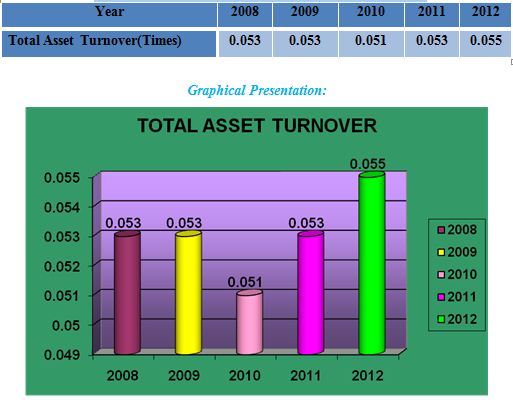
Interpretation:
We know that this ratio measures the efficiency of the bank in using its total assets to generate operating income and the higher the ratio, the higher the efficiency of the bank is in using its assets. The graph shows an upward trend in total asset turns over except in 2010. Its total asset turn over is lowest in 2010, but it is highest in 2012. This indicates that MBL is becoming more efficient in using its assets to generate operating income.
Earnings per Share
The firm’s Earning per share (EPS) are generally of interest to present or prospective stockholders and management. The Earning per share represents the number of dollars earned on behalf of each outstanding share of common stock. The earnings per share are calculated as follows.
Earning Per Share =Earnings available for common stockholder/No of shares of common stock outstanding
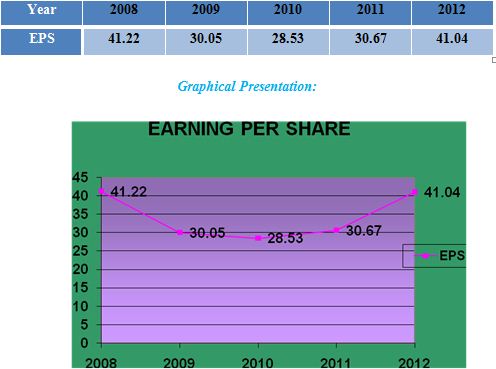
Interpretation:
The graph shows that EPS is highest in 2008 and there is a downward trend in EPS from the year 2008 to 2010. But MBL has managed to increase its EPS as shown by the upward trend in EPS. Over the last three years.
DISCUSSIONS.
While working at MBL Dhanmondi Branch, I have got some new experience and examine different problems. These problems that I identify completely from my personal point of view which are given below.
- The current ratio of MBL is increasing year by year. Mercantile Bank Limited net working capital has gradually increasing year by year it is the good sign for the bank.
- Cash and bank balance to a total deposit of MBL are higher but it is not good because higher liquidity position shows the greater amount of idle money, which can not generate the revenue.
- Cost income ratio of the MBL was decreasing gradually it is the good sign for the bank.
- Total asset turnover of MBL is not good at all and it had been decreased 2008. But in 2011 this ratio is increasing mode.
- The liabilities and borrowing are increasing the last couple of years that ultimately decreasing the total revenue it is harmful.
- The profit margin of MBL is in a strong position and earning per share (EPS) over the last three years in the upward trend.
- MBL had the good return on asset and equity during 2012 but both of return falls in 2011.
- Invest to deposit drastically falls last year that is not a good sign.
Conclusion
Mercantile Bank Limited (MBL) is setting new standards in the banking arena in the time of turbulent economic conditions. As part of the long-term financial reform and modernization plan of the government, the bank had been converted into a public limited company. The bank is a financial intermediary that collects money as the deposit from idle section i.e. household by providing interest against deposit and mobilize this money into the productive sector i.e. industry, agriculture, manufacturing from by collecting interest against the loan. The difference between interest expense and interest gain is the bank’s main profit. In banking language, it is called spread. Without a bank, an economic development cannot be imagined. The mercantile bank one of the leading banks in our country that also plays a vital role undoubtedly. In 2010 the Mercantile Bank total deposit was (75629.14) million and provide the loan (66377.70) million. Mercantile bank collect deposit by providing different types attracting deposit product and provide loan by offering different types of investment product. In developing economic condition mercantile bank has the huge contribution i.e. in 2010 the contribution was in garments sector (11,211,457,626), agriculture sector (2,038,915,000), government sector (9,565,346,007). So it can be said that Mercantile Bank plays a very important role in economic development.
Recommendations.
It is not unexpected to have problems in any organization. There must be problems to operate an organization. But there must be remedies to follow. The following commendations can be suggested to solve the above-mentioned problems.
- MBL should be more efficient using its assets to generate it operating income. And it should need to increase investment to deposit.
- It should maintain its large capital to continue its strong position in capital adequacy.
- They should need to invest their idle money in right way and continue to grip up net working capital for pay short-term obligation
- It should give more concern in their management quality to improve it satisfactory position.
- Management should be careful enough to control the excessive cost.
- Operational efficiency of every branch should be examined to profoundly and regularly. Management should give more concern and directions to reduce the operating cost of branches.
- MBL should pay attention to increase the net interest margin by decreasing interest expenses.