Financial Position and Marketing Strategy analysis of
Pathsala South Asian Media Institute.
Pathshala South Asian Media Institute, the pioneer media school in Bangladesh, offers a wide range of courses on Photography and Cinematic art.
History
The name Pathshala comes from the ancient education system that prevailed in South Asia. It brings to mind classes held underneath a large tree; conjuring up learning spaces without walls, in the cool shade of its leaves. The South Asian Institute of Photography not only allows students to explore the world of image making but also provides them opportunities to question beyond the confines of the discipline. The conceptual absence of classroom walls enables 1st year students and 3rd year students to attend the same classes and work together on collaborative projects together with visiting faculty. This enhances and complements each student’s learning experience.
The institute started in 1998 in conjunction with a three-year World Press Photo educational initiative. It was launched to coincide with the Dhaka’s annual WPP exhibition. This exhibition was also replicated in other countries like Peru, Bosnia and Zimbabwe. The British Council, The Thomson Foundation and Panos South Asia supported this initiative of WPP and Drik Picture Library Ltd. Since then, Pathshala has slowly grown to become a socially conscious photo resource center based in Dhaka, Bangladesh. The first group of six students is now among prominent photographers whose photographs have been published in some of the leading publications worldwide.
In January 2010 Pathshala decided to be extended to other sectors of the media, namely broadcast and multimedia journalism. At the same time Pathshala decided to change its name to South Asian Media Academy to reflect the development. The launching of the new Media Academy took place on Monday, 22 March, 2010 by opening a new department on broadcast and multimedia journalism.
Project Summary
This report will focus on the financial position and the marketing strategy analysis of Pathsala South Asian Media Institute which is one of the leading institutes in Photographic and cinematic training in Bangladesh.
In Financial position analysis I do Ten (10) ratios are selected to judge the various aspects of financial efficiency of the company, including Liquidity through – Current ratio, Quick/Acid test ratio;Asset Management through – Inventory turnover ratio, Days sales outstanding ratio,and Total asset turnover ratio; Debt position of company through Debt ratio, Debt Equity Ratio; Profitability through – Net profit margin, Return on total assets and Return on equity.
In marketing strategy analysis I examine the market situation of Pathsala South Asian Media Institute and our product by analyzing SWOT and Porter 5 forces.
Finally I provided the outcome of the analysis in the findings part to present the accurate view of current financial position and the marketing strategy of Pathsala South Asian Media Institute.
Objective of the project
Broad Objective
To find out the Financial Position & Marketing Strategy analysis of Pathsala South Asian Media Institute.
Specific Objectives
- Build an overall understanding on the financial performance of the Pathsala South Asian Media Institute.
- Compare the trend of financial performance of the company to measure its performance growth.
- Draw some conclusion on the financial performance and make some recommendation.
- Find out the marketing strategy of Pathshala through SWOT and 5 force analysis.
Methodology
For preparing this paper information are mainly collected from the annual paper of PSAMI. The various ratios are calculated from the information provided in the annual papers. Ten ratios are selected to judge the various aspects of efficiency of the companies. We have taken the information from 3 year financial statement of PSAMI (2013, 2014 and 2015). And the company information (History, corporate profile, vision, mission) are collected from company website.
Financial Position Analysis
Financial Ratio Analysis
Financial ratios are useful indicators of a firm’s performance and financial situation. Financial ratios can be used to analyze trends and to compare the firm’s financials to those of other firms.
Categories of Financial Ratio
Financial ratios can be classified according to the information they provide. The following types of ratios frequently are used:
- Liquidity – Current Ratio, Quick Ratio
- Asset Management – Inventory Turnover, Days Sales Outstanding, Total Asset Turnover.
- Debt – Debt Ratio, Debt Equity Ratio.
- Profitability – Net Profit Margin, Return on Asset, Return on Equity.
- Liquidity Ratio
Liquidity ratios are the first ones to come in the picture. These ratios actually show the relationship of a firm’s cash and other current assets to its current liabilities. Two ratios are discussed under Liquidity ratios. They are:
- Current ratio: This ratio indicates the extent to which current liabilities are covered by those assets expected to be converted to cash in the near future. The higher current ratio the better it is for the organization
- Quick/ Acid Test ratio: This ratio indicates the firm’s liquidity position as well. It actually refers to the extent to which current liabilities are covered by those assets except inventories. Companies with less than 1 cannot pay their current liabilities and should be looked at with extreme care.
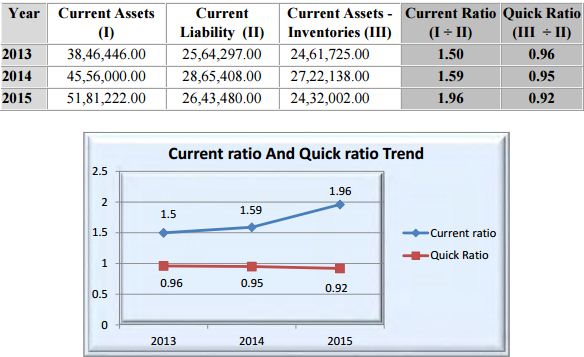
Calculation of Current Ratio and Quick Ratio
Comment:
Current ratio of PATHSHALAshows that the ability of the organization to meet the current liabilities with available current assets was increased in all years. If we take a closer look on the balance sheet, this assumption gets a more realistic touch. Year by year assets have gone slightly down and the liabilities as well, but proportionately assets were a little higher than the liabilities which actually reflected as a marginal increase in the ratio. As the current ratio is consistent so the management should keep keen eyes to continue this flow for longer term.
The Quick ratio shows the decreasing trend. It indicates that the organization is so much depends on the inventories to meet the current liability. Their ratio is so much weak to cover an unexpected draw down of liabilities.
Asset Management
Asset Management indicates the quality of receivables and how successful the firm is in its collections. Mainly activity ratios are the indication of financial activities of a firm’s collection / marketing department. Activity ratios can be categorized in the following types-
- Total Asset Turnover
- Fixed Asset Turnover
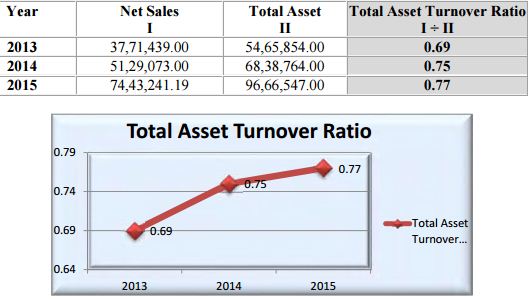
Total Asset Turnover:
It indicates the relationship between assets and revenues. Companies with low profit margin tend to have high asset turnover, those with high profit margin have low asset turnover. It indicates pricing strategy. This ratio is useful to determine the amount of sales that are generated from each Taka of asset.
Financial data of Pathshala shows the following result:
 Comment
Here although organization’s Total Asset Turnover Ratio is showing increasing trend still it is too weak for the company. The organization should go for more sales to get a higher asset turnover.
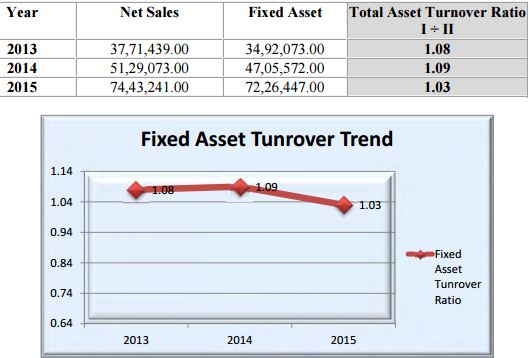
Fixed Asset Turnover:
A financial ratio of net sales to fixed assets. The fixed-asset turnover ratio measures a organization’s ability to generate net sales from fixed-asset investments – specifically property, plant and equipment (PP&E) – net of depreciation. A higher fixed-asset turnover ratio shows that the company has been more effective in using the investment in fixed assets to generate revenues.
The results of Fixed Asset Turnover ratio are–
Comment
Here although organization’s Total Asset Turnover Ratio is showing increasing trend still it is too weak for the organization. The organization should go for more sales to get a higher asset turnover.
Debt Efficiency
Debt ratio shows the extent that debt is used in anorganization’s capital structure. It may be defined as the use of fixed financial charges in the firm’s capital structure t magnifies the Earning per Share.
- Debt to Equity Ratio
- Debt to Asset Ratio
Debt to Equity Ratio
It indicates what proportion of the equity and debt using the organization to finance it assets. Sometimes investors uses only long term debt instead of total liabilities for a more stringent test.
- A ratio greater than one means assets are mainly financed with debt, less than one means equity provides a majority of the financing.
- If the ratio is high (financed more with debt) then the organization is in a risky position. Especially if the rate of interest are on the rise.
Financial data of Pathshala shows the following result:
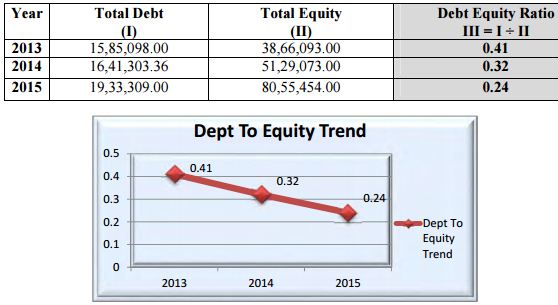
Comment:
Debt to equity ratio has decreased in all 3 years. As we know it the debt to equity flows in the decreasing trend then it consider as a good indicator for the organization.
Debt to Asset Ratio:
It indicates what proportion of the organization’s assets is being financed through debt. It is so much similar to the debt equity ratio. Ifthe ratio existless than 1 means a major portion of assets are financed with equity and above 1 means they are financing more by debt.
Furthermore we can interpret a high ratio as a highly debt leverage firm. When a company is high ratio then the company is on high risk, especially in an increasing rate of interest market.
Financial data of Pathshala shows the following result:
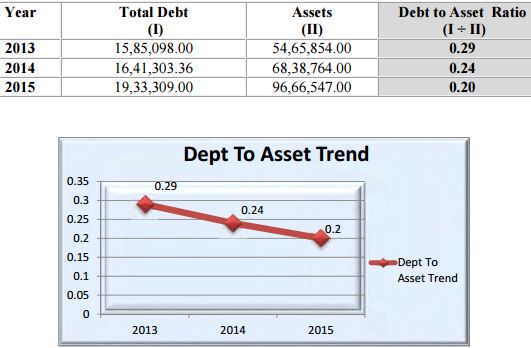
Comment:
Debt to total asset ratio also decreased in all 3 years. The assets of Pathshala are Increasing and liabilities are decreasing. As we know that the lower the debt to asset ratio the lower financing risk. It means situation is good here so,the management should to focus on continue this.
Profitability Ratio
Profitability is the net result of a number of policies and decisions. Profitability ratios show the combined effects of liquidity, asset management and debt on operating results.
Profitability Ratio can be divided into the following parts:
- Net Profit Margin
- Return on Investment Ratio
- Return on Equity
Net Profit Margin
Net profit margin is one of the most closely followed numbers in finance. Shareholders look at net profit margin closely because it shows how good anorganization is at converting revenue into profits available for shareholders.
Financial data of Pathshala shows the following result:
Time series analysis shows that the net income and net sales both are increasing. But Net profit Margin is decreasing in all 3 years. It indicates that Incomes of the company are increasing but not in the rate which it should be. This is not a good symbol for the company and the management should work on it.
Return on Assets (ROA):
It indicates what return anorganization is generating on the firm’s investment or assets. The ROA (Return on Asset) is also referred as ROI. We add the interest expense to ignore the cost of the cost associated with funding those assets. This is an important ratio for the organization deciding whether or not initiates a new project. The basis of this ratio is that if accompany is going to start a project they expect to earn a return on it, and ROA is the return they would receive. This ratio indicates the profitability on the assets of the firm’s after all expenses and taxes.
PSAMI Tend analysis of ROA ratio shows that it increased in 2013 but remain constantans in the next year. It’s not bad but The Company should take necessary steps to increase this trend.
Marketing Strategy Analysis
Porter 5 forces Analysis
Threats of New Market Entrants
Profitable markets attract new entrants, which erodes profitability. Unless incumbents have strong and durable barriers to entry, for example, patents, economies of scale, capital requirements or government policies, then profitability will decline to a competitive rate.
Here the problem is we don’t have enough entry barriers for new entrant except tax and certification. So threats of new entrant are very high here. New institution like: Media Baje, Film Society, Movieena, ThinktankCan be threat for PATHSHALA.
- Buyer bargaining Power:
It is an assessment of how easy it is for buyers to drive prices down. This is driven by the: number of buyers in the market; importance of each individual buyer to the organization; and cost to the buyer of switching from one supplier to another. Here Courses offer fix price so no question of bargaining arises here. But we have to ensure that we can provide lowest price of the market otherwise it will be hard to attract customers. But although there has only few such kind of institute in the market so buyer bargaining power is very low here.
- Supplier bargaining power
It is an assessment of how easy it is for suppliers to drive up prices. This is driven by the: number of suppliers of each essential input; uniqueness of their product or service; relative size and strength of the supplier; and cost of switching from one supplier to another. But as Pathshala is a service organization which only offered the courses relating photography and cinematography so supplier bargaining power don’t exist here.
- Threats of Substitute
Threat of substitute exist where close substitute products exist in a market, it increases the likelihood of customers switching to alternatives in response to price increases. This reduces both the power of suppliers and the attractiveness of the market. The photography and cinematography courses are a very unique thing which has no alternative in market. So threat of substitute also not exists here.
- Competitive Rivalry
The competitive rivalry is the fact which more or less exists in every organization. The higher threats from the competitor exist in market it makes the market most unattractive. PATHSHALA has a disadvantage here that it has lots of strong competitor in market. Government organization like BIJEM and BCTI are offering much lower price than PATHSHALA’s. There are also has few private organization like NICO, JobA1, Counter photo who can also be threat for US.
SWAT Analysis
Strength:
- Pathshala is a well reputed institute in market.
- The certificate of Pathshala has much value in the market.
- The principal Mr. Dr. ShaidulAlam has tremendous fame in market.
- Pathshala receives huge amount of foreign grant from World Press and others.
- The class rooms and other infrastructure are well decorated which attract more students.
- The faculty of Pathshala is highly qualified.
Weakness
- Few courses price range is higher than competitors.
- Few courses some time fail to manage the break event point of students.
- The range of courses is very limited.
Opportunities
- There has demand of acting learning course in market which we can grab
- Courses like- DSLR Cinematography has also huge demand in market.
- There has a huge opportunity to attract foreign students.
Threats
- The existing competitors are imposing threats for Pathshala.
- Pathshala large proportion of income coming from foreign grants. Pathshala will face loss If those foreign grants source are become off.
After doing the financial position and marketing strategy analysis I have found the following outcomes –
Finding
Financial Position outcomes–
- Current ratio of PATHSHALA shows that the ability of the company to meet the current liabilities with available current assets was increased in all years but it The Quick ratio shows the decreasing trend. It indicates that the company is so much depends on the inventories to meet the current liability.
- In Asset Management PATHSHALA’s Total Asset Turnovershows increasing trend but its inconsistency trend in fixed asset turnover is a concerning factor.
- In Debt efficiency both Debt to equity ratio and Debt to total asset ratio has decreased in all 3 years which is a positive sign for Pathshala.
- In Profitability Pathshala’s both Net Profit margin and return on equity shows decreasing trend which is a concerning factor. But increasing trend in Return on Asset is a positive factor for them.
Marketing Strategy Outcomes-
- The porter 5 forces analysis shows Pathshala has high threats from its rivals and new entrantsbut its threat from substitute products, buyer and supplier bargaining power is very low. So the overall market is attractive.
- From SWOT analysis I found that The biggest strength of Pathshala is itsreputation in the market where its biggest weakness is its limited courses range.
Recommendation
Pathshala is a training oriented Service institute. Its life time is not so long. But within the short period it has shown remarkable success. Pathsala already has made an impact in photography and media industry. But still I think they have some scope of improvement. I want to them following suggestions from my little experience:
- Pathshala don’t have a proper accounting system. They should prepare an adequate accounting system to obtain all financial information.
- They should focus on more students’ involvement as they can improve their Net profit margin as well as fixed asset turnover.
- They need to offer more courses to students for obtain more profit.
- They should enhance their promotional activities to boost up their student enrolment.
- They need to rethink about the fees of few courses which are higher than its competitors.
- They need to minimize the dependency of foreign funds to reduce their risks.
- They need to organize few program, seminar, events to discuss about theimportance of photography and cinematography courses.
Conclusion
An institution’s financial management plays a vital role in the financial success of a business. Therefore, an organization should consider financial management a key factor of the general management of the organization. As an employee of finance executive job is critical and risky. Because a company’s financial sustainability depends on the efficiency of the finance executive. I try my level best to find out the financial position of Pathshala through Ratio Analysis. I also focus on the marketing strategies of Pathshala in brief.
Considering the entire financial ratio for the PathshalaIt can say that at present the overall condition of the company is good. It had a mixed period from the year 2013 to 2015. Though the The Net profit margin is decreasing but the increasing trend in Current Ratio, Total Asset Ratio,Return on equity is showing good indicator for the organization.
From the marketing strategy analysis the outcome comes as such that Pathshala has strong rivalry in market and new entrant’s also imposing threats for them. But they can adopt the market opportunities as this market is much attractive enough. But to grab those opportunities they have to eradicate their weakness as well.
Finally I want to say that the Finance executive in Pathshala has been very efficient for me. I have learned a lot of things from the vastly experienced executives of Pathshala which I will implement in my future corporate life. Very importantly I want to thank Mr. Mahamudul Haque sir for his kind supervision and assistance without which it would be impossible for me to complete the report.