Performance Evaluation of First Security Bank Limited from Different point of View:
- Trend of Assets Growth
- Growth rate of Liquid Assets & Fixed Assets
- Comparison of Operational Profit & Liquid
- Deposit & Profit Comparison
- Trend of Advance & Deposit
- Total Assets
- Asset Portfolio
- Deposits and other Account
- Loans and Advances
- Foreign Exchange and Foreign Trade
- Import
- Export
- Inward Remittance
- Total Income
- Net Interest Income
- Operating Profit
- Retained Earnings
- Earnings per share
- Capital funds
- Reserve Funds
- Investments
- Branch Network and Expansion
- Human Resources
From owners viewpoint:
- Profitability of the Bank:
- Operating Profit margin
- Net Profit margin
- Growth of the Bank:
- Return on assets (RAO)
- Return on Equity (ROE)
- Provision for loan ratio
- Interest Income Ratio
- Non-interest Income Ratio
- Equity Multiplier
Asset utilization:
- Risk of the Bank:
- Interest expense ratio
- Non-interest expense ratio
Tax ratio:
From the view point of Depositors
1. Internal Liquidity
- Current ratio
- Quick Ratio
2. Operating Performance
- Capital to deposit ratio
- Deposit to employee ratio
Loan to deposit ratio:
CAMEL Rating:
- Capital adequacy
- Asset quality
- Earnings
- Management efficiency
- Liquidity
Composite Rating:
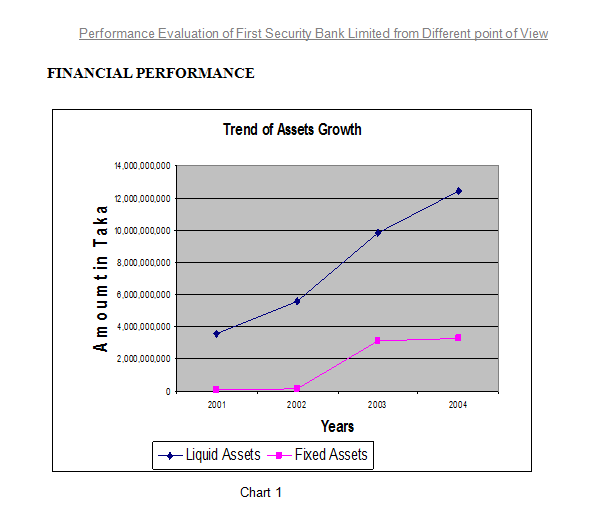
Chart 1 shows a significant improvement of the FSBL in treasury management. In successive years it has a remarkable improvement to increase its current assets while keeping investment in fixed. Even in year 2004 the fixed assets remain approximately close to previous year while there is double-digit growth in liquid asset this helped FSBL to gain from money market fluctuation in interest rate. Though in year 2003 fixed assets has increased more than 100%. But this is due to the set up cost and expansion in business. But following year it was able to maintain the fixed assets close to previous year.
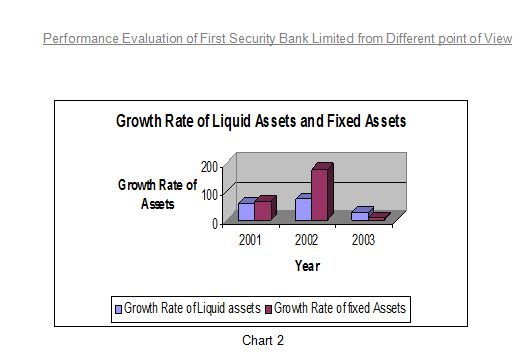
Chart 2 shows rate of growth of the liquid assets and fixed assets. In this chart we see that in year 2002 fixed assets increased more than 150% due to the expansion of business, major investment in this year was in primary cost of opening of new branches including proclamation of land and installment of computer and furniture. But in the following its investment in fixed assets increase more not over 4%. Though keeping fixed assets may help FSBL to get a good score in CAMEL rating but being a third generation newly established not more than 5 years it should invest more in land proclamation and expansion of business to be remain competitive. But an sustainable growth may be ensured keeping fixed cost same level while increasing liquid assets at the same time this can ensure profitability because of short term investment in money market to take the advantage in the fluctuation of interest rate.
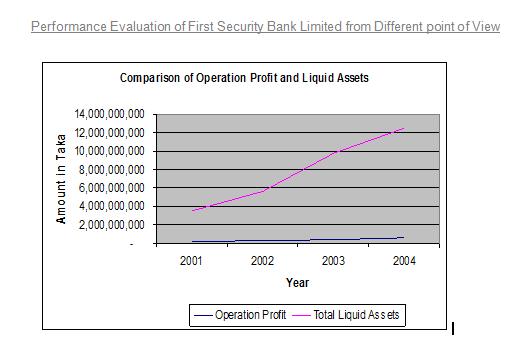 Chart 3 shows FSBL performance in Treasury Management. FSBL’s liquid assets ensured only liquidity. Where its volume of liquid assets increased sharply but it failed to ensure to profitability. It has invested more money in non interest bearing asset (cash and currencies) over the year profit has increased slightly but investment in liquid assets or non interest bearing assets increased straight upward. It is expected that over the year with more experience and strength and being acknowledge about the client transaction behavior it will shift more of it investment from non interest bearing assets to interest bearing assets like T-bills.
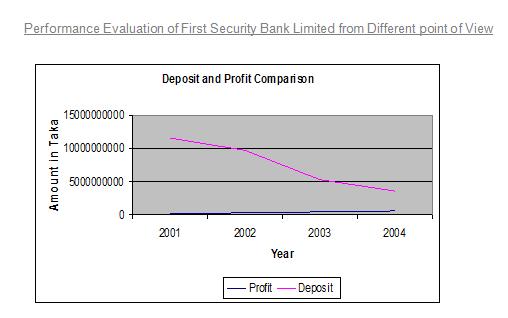

Chart 4 shows that in successive years deposit have fallen sharply. It is because in these successive years Government had taken loan from money market to meet its deficit budgets by increasing at the same time limit of investment in a single name had weaved so it fund flowed from depository financial sector to less risky Government Securities sectors. In this squeeze financial scenario it is very difficult to make any profit. But we see that in this period profit did not decrease even in year 2004 we that profit have increased slightly. Though in these periods core deposit has decreased sharply but FSBL was able to collect deposit from other financial institutions. That is a reason of FSBL to maintain high liquidity. Because it is more like that the deposit from other banks and financial institutions will be call back any time or have to repay on demand. Though this can help to keep cost of fund lower because it reduces dependent on high cost fixed deposit but at the same time it also hamper the growth rate. Over the year savings deposit even fixed deposit has decreased so it very much necessary for this moment to expand business, getting more strength by collecting money from offering saving deposit account or even fixed deposit account. Other wise growth will be stopped.
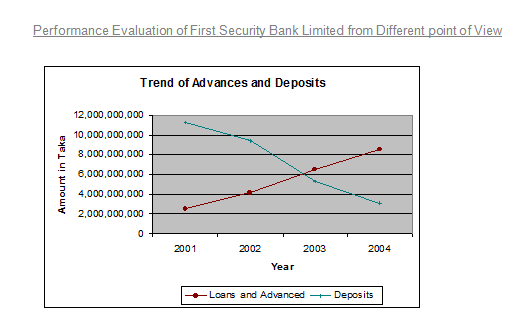
Chart 5 is showing the deposit and advance position of FSBL over the period. It depicts that though advance over the year has increase rapidly but deposit has decreased gradually. This is due to heavy dependency on borrowing from the other financial institutions. But heavy dependency on the deposit of other financial institute may not be seen a good sing. FSBL should improve it core deposit that is from small severs by offering various types of saving product other wise in case of deposit crunch a deposit run may create a heavy problem in future especially in case of contraction monitory policy.
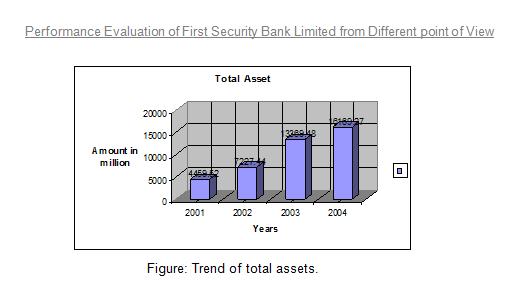
Total Assets: Trend of total asset is shown in the table from year 2001-2004.
Year | 2001 | 2002 | 2003 | 2004 |
Total Assets | Tk. 4459.52 million | Tk.7227.44 million | Tk. 13369.48 million | Tk.16169.27 million |
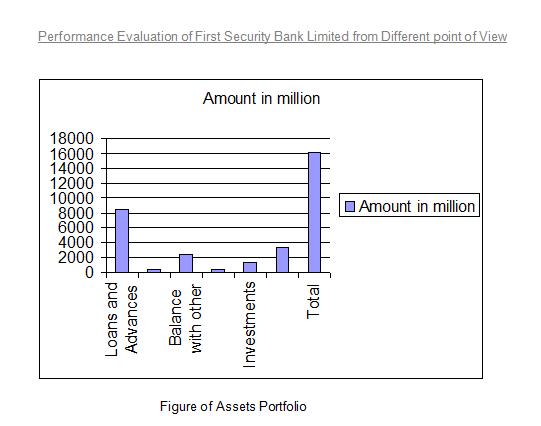
Asset Portfolio:
The bank total assets outstanding as of December 31, 2004 amounted to Tk. 16169.27 million as compared to 2003 amounted to Tk. 13369.49. Loans & advances contributed 52.57% cash 2.48% balances with others bank 14.47%, money at call and short notice 2.15%, investments 7.87% and the total other assets 20.46% as against 48.44%, 3.00%, 14.83%, 4.52%, 5.63% and 23.58% respectively in 2003.
Components | Amount in million | % Of Total |
| Loans and Advances | 8500.27 | 52.57 |
| Cash | 402.33 | 2.48 |
| Balance with other Banks | 2338.98 | 14.47 |
| Money at Call and short Notice | 347.50 | 2.15 |
| Investments | 1271.72 | 7.87 |
| Total Other Assets | 3308.47 | 20.46 |
| Total | 16169.27 | 100.00 |
Deposits and other Accounts:
Deposits are the major sources of a Banks fund. They serve surplus units y offering a wide variety of deposit accounts. During the preliminary stages of operation the volume of deposit was comparatively low. But it started increasing as its operations gets going.
The total deposit of the Bank increased sharply from Tk. 5230.30 million at the end of 2002 to Tk. 9443.57 million at the end of 2003 and at the end of the year 2004 it increased to 11231.67 million. Deposits of the bank stood at tk. 11231.67 million at the end of December 2004 as compare to tk 9773.56 million at the end of December 2003. Deposits of the bank include Savings bank deposits, Term deposits, Current and other account deposits and bills payable.
Break-up of Deposits:
(Tk. in Million)
Type | 2001 | 2002 | 2003 | 2004 |
| Savings Bank Deposits | 92.37 | 180.45 | 218.78 | 311.43 |
| Term Deposits | 2176.67 | 3688.00 | 6939.10 | 7806.26 |
| Current & Other account deposit | 602.71 | 1006.21 | 2066.68 | 2767.50 |
| Bills Payable | 97.15 | 152.97 | 208.07 | 340.32 |
| Bearer certificates of deposit | 111.28 | 203.58 | 10.93 | 6.15 |
| Total | 2968.9 | 5027.63 | 9432.63 | 11225.5 |
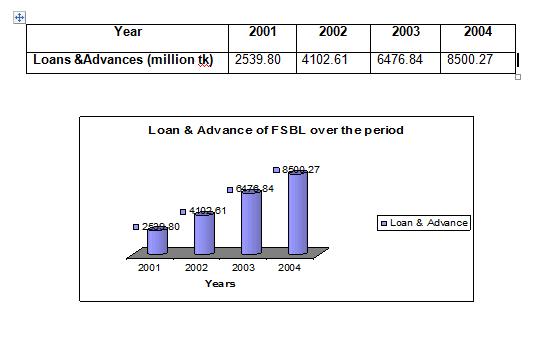
Loans and Advances:
First Security Bank Limited has been extending credit facilities to productive and priority sectors under the guidelines of Bangladesh Bank. Outstanding advances of the bank moved up from tk. 6476.84 million on the 31st December 2003 to tk. 8500.27 million on the 31st December 2004. That means the loans and advances of First Security Bank Limited has increased over time. In extending credit facilities, the bank attached due importance to sectoral needs and requirements of both public and private sectors.
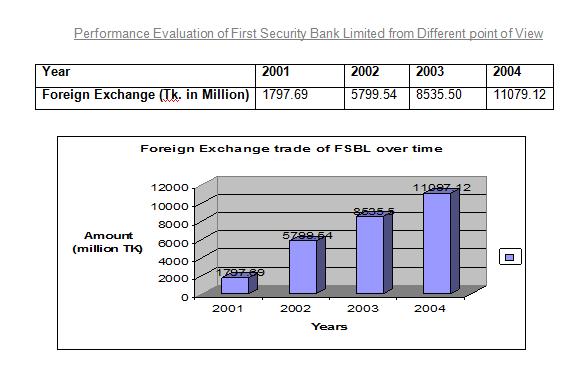
The bank has earned excellent business reputation in handling & funding international trade, particularly in boosting-up of export & import of the country. The foreign exchange and foreign trade business during the year 2004 stood at tk. 11079.12.
The comparative position of foreign exchange & trade business during the year 2001-2004 as follows –
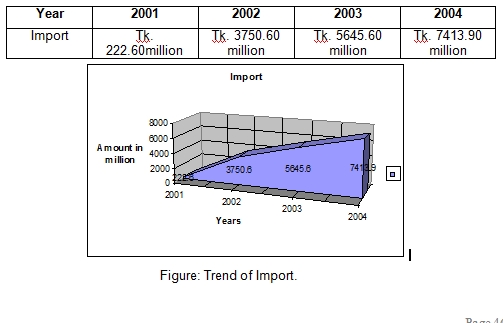
Import: The bank foreign exchange business relating to import into Bangladesh expanded markedly by 31.32% to Tk. 7413.90 million at the end of December 2004 from Tk. 5645.60 million a year ago. A year wise graphical presentation of the same is provided below.
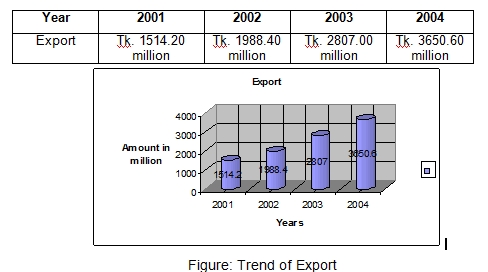
Export: Export business handled by the bank during 2004 stood at tk. 3650.60 million, showing a growth of 30.05% from Tk. 2807.00 million during 2003. A year wise graphical presentation of the same is provided below.
Branch Network and Expansion:
During the year 2002 the total number of branches of First Security Bank Limited stood at 10, in 2003 it was 11 and in year 2004 it stood at 12 branches. The Bank has proposed a long-term program to Bangladesh Bank to open more branches in phases in important locations in Bangladesh.
Human Resources:
Total number of employees stood at 467 as on 31st December 2004. The bank continued to encourage its employees to receive training and participate in various seminars and workshop to enrich their professional skills.
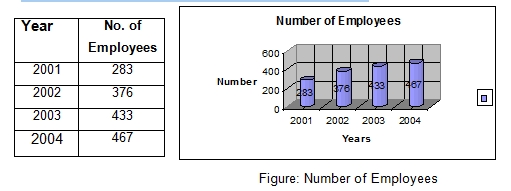

Figure: Number of Employees
Inward Remittance:
During 2004 the bank handled inward remittance from Bangladeshi workers abroad to the tune of Tk. 32.62 million against 82.90 million of 2003. A year wise graphical presentation of the same is provided below.
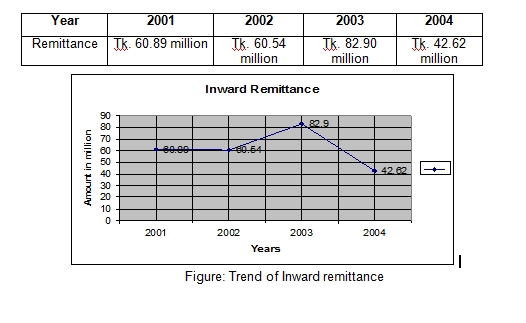
Figure: Number of Employees
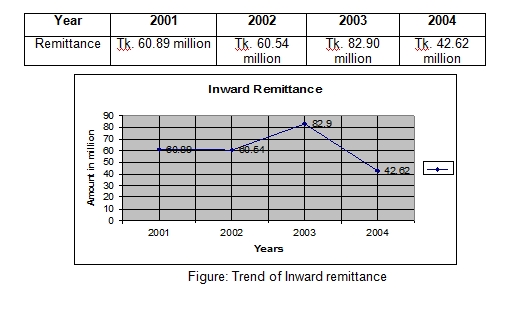
Inward Remittance:
During 2004 the bank handled inward remittance from Bangladeshi workers abroad to the tune of Tk. 32.62 million against 82.90 million of 2003. A year wise graphical presentation of the same is provided below.
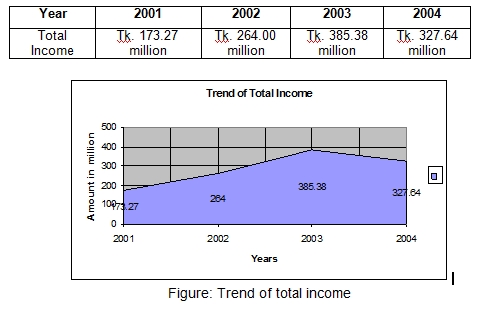
Results of Operation:
Total Income: During the year total operating income of the bank stood at Tk. 327.64 million compare to previous year total income of Tk. 385.38 million. A year wise graphical presentation of the same is provided on next page:

Net Interest Income:
The interest income of the year 2001 was 109.35 million; in year 2002 amounted to Tk. 141.79 million. In year 2003 it was Tk. 204.44 million. In year 2004 the interest income stood for Tk. 327.64 million showing a gradual increase.
Year | 2001 | 2002 | 2003 | 2004 |
Net Interest Income | Tk. 109.35 million | Tk. 141.79 million | Tk. 204.44 million | Tk. 327.64 million |

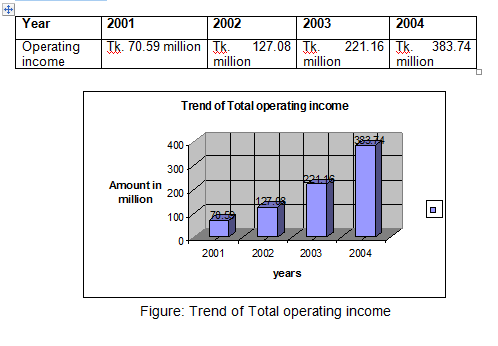
Operating Income:
The profit of the year 2002 before provision amounted to Tk. 127.08 million as against Tk. 70.59 million of preceding year showing and increased by 80.03%. But in year 2003 before provision amount is 221.16 million. In year 2004 operating profit stood for Tk. 383.74 million.
Retained Earnings:
Retained earnings were placed at Tk. 106.14 million for the year 2004 as against Tk. 44.18 million in the previous year 2003. A year wise graphical presentation of the same is provided on next page:
Earnings Per share:
Earnings per share in year 2001 was Tk. 17.26 million but decreased in 2002 to Tk. 9.21 million, after that it started to increase and in year 2003 it stood Tk. 17.45 million
In year 2004 it was Tk. 31.71 million.
Year | 2001 | 2002 | 2003 | 2004 |
EPS | Tk. 17.26 million | Tk. 9.21 million | Tk. 17.45 million | Tk. 31.71 million |
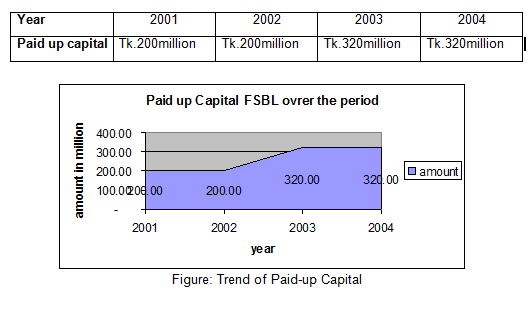
Capital funds:Authorized capital of the bank is tk. 1,000.00 million and paid up capital was tk. 200.00 million in the year 2004. Over the period 2001-2002 the paid –up capital was fixed at tk. 200.00 million and 320 over the period 2003-2004.
Performance Evaluation of First Security Bank Limited from Different Point of View:
From owners viewpoint:
As an owner of a bank we will analyze three area of a bank
1. Profitability of the Bank
2. Growth of the Bank
3. Risk of the Bank
1. Profitability of the Bank:
Operating Profit margin:
This ratio indicates operating income of the bank in relation to total revenue after taking into account operating cost.
Operating Profit margin = Operating profit / Total Revenue.
(Tk. in Million)
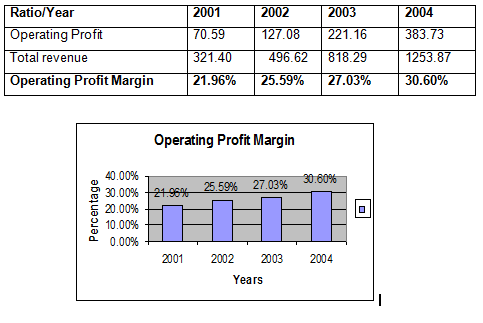
Interpretation: In case of First Security Bank Limited we observed that operating profit margin ratio increased gradually over the period this indicates that the bank is operationally efficient.
Net Profit margin: This ratio indicates net income of the bank in relation to total revenue after taking into account operating cost, financial expenses and corporate taxes.
Net Profit margin = Net income / Total Revenue. (Tk. in Million)
| Ratio/Year | 2001 | 2002 | 2003 | 2004 |
| Net Income | 50.75 | 38.37 | 116.50 | 197.66 |
| Total revenue | 321.40 | 496.62 | 818.29 | 1253.87 |
| Net Profit Margin | 15.80% | 7.73% | 14.24% | 15.76% |
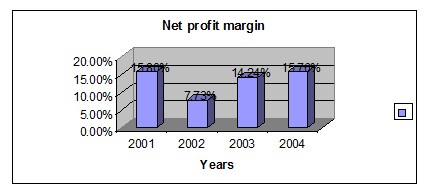
Interpretation: In case of First Security Bank Limited, we observed that net profit margin ratio increased over time except year 2002. This ratio has increased due to the decrease of administrative, general expense and income tax relative to revenue.
2. Growth of the Bank:
Return on assets (ROA): Return on assets measure the success of a firm in using assets to generate earning independent of the financing if those assets. This measure therefore separates financing activity from operating and investing activities. RAO is particularly useful in assessing the performance of business segment of firm when as is typical, financing for those segments comes form a central corporate pool of resources. ROA = Net income / Total assets
(Tk. in Million)
| Ratio/Year | 2001 | 2002 | 2003 | 2004 |
| Net Income | 50.75 | 38.37 | 116.50 | 197.66 |
| Total Assets | 4459.52.2 | 7227.45 | 13369.50 | 16169.27 |
| Return on Assets | 1.14% | 0.53% | 0.87 % | 1.22% |
Interpretation: The ratio of return on asset of First Security Bank Limited is relatively low; it is lower than 1% over the years 2002 and 2003. It had increased little in 2004 .It indicates that total asset of the bank increased but net profit did not increase with the assets. This shows the management inefficiency in using the bank asset to generate profit.
Return on Equity (ROE): This ratio indicates the degree to which the form is able to convert operating income into an after income that eventually can be claimed by the shareholder. This is a useful ratio for analyzing the ability of the firm’s management to realize an adequate return on the capital invested by the owners of the firm.
ROE = Net income / Total equity (Tk. in Million)
| Ratio/Year | 2001 | 2002 | 2003 | 2004 |
| Net Income | 50.75 | 38.37 | 116.50 | 197.66 |
| Total Equity | 211.24 | 253.66 | 429.51 | 531.00 |
| Return on equity | 24.02% | 15.12% | 27.12% | 37.22% |
Interpretation: From the above data we find that return on equity of FSBL increased in 2004 because the bank has increased its net income as well as the equity.
Provision for loan ratio:
Provision for loan loss / Total operating income (Tk. in Million)
| Ratio/Year | 2001 | 2002 | 2003 | 2004 |
| Provision for loan loss | 2.47 | 77.20 | 104.66 | 186.07 |
| Total operating income | 173.27 | 263.99 | 385.38 | 591.67 |
| Provision for loan ratio | 1.58% | 29.24% | 27.16% | 31.45% |
Interpretation: Provision for loan losses ratio of FSBL decreased in 2002, which shows the management efficiency to disburse and recovery of loan.
Asset utilization: Asset utilization ratio = Total operating income / Total asset
(Tk. in Million)
| Year | 2001 | 2002 | 2003 | 2004 |
| Total operating income | 173.27 | 263.99 | 385.38 | 591.67 |
| Total asset | 4459.52 | 7227.45 | 13369.50 | 16169.27 |
| Asset utilization ratio | 3.89% | 3.65% | 2.88% | 3.66% |
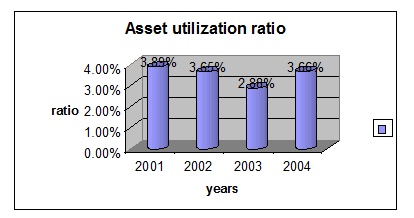
Interpretation: The data of asset utilization shows that the ratio of FSBL gradually decreased from 2001 to 2003. But in later period it increased in 2004. This indicates that the bank is most inefficient to mobilize profit from total assets.
Interest Income Ratio:
Interest Income Ratio = Interest Income / Total assets (Tk. in Million)
| Ratio/Year | 2001 | 2002 | 2003 | 2004 |
| Interest Income | 321.40 | 496.62 | 818.29 | 1253.87 |
| Total assets | 4459.52 | 7227.45 | 13369.50 | 16169.27 |
| Interest Income Ratio | 7.21% | 6.87% | 6.12% | 7.75% |
Interpretation: From the above data we see that interest income ratio decreased overtime but little increased in 2004. It indicates that the bank is trying to keep the interest income more stables and they were not successful in this area.
Non-interest Income Ratio: = Non-interest Income / Total assets
(Tk. in Million)
| Ratio/Year | 2001 | 2002 | 2003 | 2004 |
| Non-interest Income | 63.91 | 263.99 | 180.94 | 264.04 |
| Total assets | 4459.52 | 7227.45 | 13369.50 | 16169.27 |
| Non-interest Income Ratio | 1.43% | 3.65% | 1.35% | 1.63% |
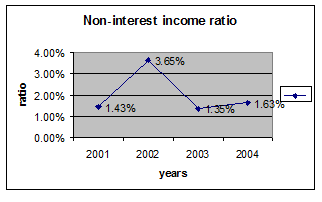
Interpretation: Above table shows the non-interest income of FSBL increased in 2002 because of more activities other than deposit.
Equity Multiplier: Equity multiplier measures the value of assets funded with each taka of equity capital. The higher the ratio, the more leverage or debt the bank is using to fund its assets. Thus the ratio is a measure of the degree of leverage the bank is using. Equity multiplier = Total assets / Total equity capital
(Tk. in Million)
| Ratio/Year | 2001 | 2002 | 2003 | 2004 |
| Total assets | 4459.52 | 7227.45 | 13369.50 | 16169.27 |
| Total equity capital | 211.24 | 253.66 | 429.51 | 530.99 |
| Equity multiplier | 41.28% | 39.39% | 40.28% | 41.02% |
Interpretation: Equity multiplier of FSBL was too high, which indicates that the bank was highly depended on leverage.
3. Risk of the Bank:
Interest expense ratio: Interest expense ratio is different method to evaluate the bank’s expense management.
Interest Exp. Ratio = Interest expenses / Total operating income
(Tk. in Million)
| Ratio/Year | 2001 | 2002 | 2003 | 2004 |
| Interest expenses | 212.05 | 354.82 | 613.85 | 926.24 |
| Total operating Income | 173.26 | 263.99 | 385.38 | 591.67 |
| Interest Exp. Ratio | 1.22 | 1.34 | 1.59 | 1.57 |
Interpretation: From the above data we see that interest expenses ratio was more over stable up to 2002 but increased more in 2003. It indicates that the bank was trying to keep the interest expenses more stables up to 2002but in later period they were unable to maintain the track.
Non-interest expense ratio:
Non interest expense /Total operating income (Tk. in Million)
| Ratio/Year | 2001 | 2002 | 2003 | 2004 |
| Non interest expense | 102.677 | 136.91 | 164.22 | 207.93 |
| Total operating income | 173.26 | 263.99 | 385.38 | 591.67 |
| Non interest expense ratio | 59.26% | 51.86% | 42.61% | 35.14 |
Interpretation: Above table shows the non-interest expenses of FSBL was decreasing over time but it was too high in 2001 because of more activities other than deposit, which had to pay high cost.
Tax ratio:
Tax ratio= Income Taxes / Total operating income
(Tk. in Million)
| Ratio/Year | 2001 | 2002 | 2003 | 2004 |
| Income Taxes | 16.24 | 19.95 | 60.65 | 96.18 |
| Total operating income | 173.26 | 263.99 | 385.38 | 591.67 |
| Tax ratio | 9.37% | 7.66% | 15.74% | 26.26% |
Interpretation: From 2001 to 2002, the tax ratio decreased, because the total operating income of FSBL was increased.
From the view point of Depositors:
1. Internal Liquidity
2. Operating Performance
Internal Liquidity: Current Ratio = Current assets / Current liabilities
(Tk. in Million)
| Ratio/Year | 2001 | 2002 | 2003 | 2004 |
| Current assets | 3724.49 | 5898.75 | 10217.77 | 12860.81 |
| Current liabilities | 4248.29 | 6973.79 | 12939.97 | 15638.27 |
| Current Ratio | 0.3329 | 0.2908 | 0.2112 | 0.2300 |
2. Operating Performance: Capital to deposit ratio = Total Capital / Total deposit
(Tk. in Million)
| Ratio/Year | 2001 | 2002 | 2003 | 2004 |
| Total Capital | 211.24 | 253.66 | 429.51 | 530.60 |
| Total deposit | 3080.19 | 5230.30 | 9443.57 | 11231.68 |
| Capital to deposit ratio | 6.86% | 4.85% | 4.56% | 4.72% |
Loan to deposit ratio: Loan to deposit ratio = Total Loan / Total deposit
(Tk. in Million)
| Ratio/Year | 2001 | 2002 | 2003 | 2004 |
| Total Loan | 2539.80 | 4102.61 | 6476.84 | 8500.27 |
| Total deposit | 3080.19 | 5230.30 | 9443.57 | 11231.68 |
| Loan to deposit ratio | 82.45% | 78.44% | 68.58% | 75.68% |
Deposit to employee ratio=Total Deposit / Total number of employee
(Tk. in Million)
| Ratio/Year | 2001 | 2002 | 2003 | 2004 |
| Total Deposit | 3080.19 | 5230.30 | 9443.57 | 11231.68 |
| Total number of employee | 283 | 376 | 433 | 467 |
| Deposit to employee ratio | 1.088 | 13.91 | 21.81 | 24.05 |
CAMEL Rating: CAMEL rating is a suitable way of analyzing bank’s financial performance. It is a technique, which is widely used by the central bank as well as financial analysts to identify bank’s financial position. Five alphabets of CAMEL means:
C = Capital adequacy
A = Asset quality
M = Management efficiency
E = Earnings
L = Liquidity
These cover all major aspects of financial indicators. To appropriately identify bank’s financial position, rating is used which is calculated by following way-
Rating | Condition | CompositeRange |
1 | Strong | 1.0-1.49 |
2 | Satisfactory | 1.50-2.49 |
3 | Fair | 2.50-3.49 |
4 | Marginal | 3.50-4.49 |
5 | Unsatisfactory | 4.50-5.00 |
Elements of CAMEL rating are calculated step by step in the following:
1. Capital adequacy: Capital adequacy of First Security Bank Limited was 7.57% in year 2004.
Rating | Condition | Range |
1 | Strong | 9.00% – above |
2 | Satisfactory | 8.00% – 8.99% |
3 | Fair | 7.00% – 7.99% |
4 | Marginal | 5.00% – 6.99% |
5 | Unsatisfactory | 4.99% – below |
Interpretation:
Since the capital adequacy ratio of the First Security Bank Limited in 2004 was -0.88%. So, the capital adequacy of First Security Bank Limited was satisfactory. That means rating was 5.
2. Asset quality: To identify of assets quality of First Security Bank Limited, classification of loans and advance and provision for loans and advances is required to know –
Particulars | 2004 | % of total loan |
| a) Unclassified | 7079.49 | 83.29% |
| b) Classified: | 1420.78 | 16.72% |
| i) Substandard | 359.96 | 4.23% |
| ii) Doubtful | 51.41 | 0.60% |
| iii) Bad & loss | 1009.41 | 11.88% |
| Total loans and Advances | 8500.27 | 100% |
Classified loan ratio = Classified loan / total loan
= 1420.78 million / 8500.27 million
= 16.72%
Rating | Condition | Range |
1 | Strong | Up to 5.00% |
2 | Satisfactory | 5.01% – 10.00% |
3 | Fair | 10.01% – 15.00% |
4 | Marginal | 15.01% – 20.00% |
5 | Unsatisfactory | Above 20.00% |
Interpretation:
Classified loan ratio of the First Security Bank Limited at 2004 was 16.72%. So, the asset quality of First Security Bank Limited is marginal. That means rating was 4.
3. Earnings: ROA = Net income / Total asset (Tk. in Million)
Ratio/Year | 2004 |
| Net Income | 197.66 |
| Total Assets | 16169.27 |
| Return on Assets | 1.23% |
Rating | Condition | Composite Range |
1 | Strong | 1.0%- above |
2 | Satisfactory | 0.85% – 0.99% |
3 | Fair | 0.70%- 0.84% |
4 | Marginal | 0.55%-0. 69% |
5 | Unsatisfactory | 0.54% and below |
Interpretation: Return on assets of the First Security Bank Limited at 2004 was 1.23%. So, the Earnings of First Security Bank Limited were strong. That means rating was.
4. Liquidity: Liquidity ratio = total liquid assets / total times demanded liabilities
= 7488.03 million / 60923.1 million = 35.38%
Rating | Condition | Range |
1 | Strong | 30.00% – above |
2 | Satisfactory | 20.00% – 29.99% |
3 | Fair | 19.00% – 19.99% |
4 | Marginal | 15.00% – 18.99% |
5 | Unsatisfactory | Below 15.00% |
Interpretation: Liquidity ratio of the First Security Bank Limited at 2004 was 35.38%. So, the liquidity of First Security Bank Limited was strong. That means rating was
Management efficiency:
The management rating is an average of the four ratings given to capital, assets quality, earnings and liquidity.
Rating [(C+A+E+L)/4] = (3 + 4 +1 +1) / 4= 2.25
Rating | Condition | Range |
1 | Strong | 1.0-1.49 |
2 | Satisfactory | 1.50-2.49 |
3 | Fair | 2.50-3.49 |
4 | Marginal | 3.50-4.49 |
5 | Unsatisfactory | 4.50-5.00 |
Interpretation: The range of rating of Management efficiency of First Security Bank Limited was 2.25, which was Satisfactory. That means rating was
CAMEL Rating:
| Capital adequacy | Unsatisfactory | 5 |
| Asset quality | Marginal | 4 |
| Management efficiency | Fair | 3 |
| Earnings | Strong | 1 |
| Liquidity | Strong | 1 |
Composite Rating: Composite rating is the average of the all ratings.
Thus, Composite rating = (3+4+2+1+1) / 5 = 2.20
Rating | Condition | Composite Range |
1 | Strong | 1.00 – 1.49 |
2 | Satisfactory | 1.50 – 2.49 |
3 | Fair | 2.50 – 3.49 |
4 | Marginal | 3.50 – 4.49 |
5 | Unsatisfactory | 4.50 – 5.00 |
Conclusion of CAMEL rating: Since the composite range of CAMEL rating of First Security Bank Limited in 2004 was 2.20. Therefore, it shows that the financial position of First Security Bank Limited was Satisfactory.