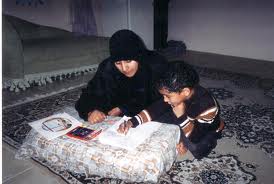
Education of Mother
According to several research findings the educated mothers are more concerned about the freedom of their female child. For this reason the future of children are brighter and they succeed in the life (Khadiza Khanom, 1998). In the following table education of mother has been identified.
There is difference between faculties and education of mother of respondents. In the Arts and Humanities faculty there are 35 respondents in this research and we can see that education of mother of the 7 respondents is below S.S.C. On the other hand although the number of respondents in the Science background is 18 mothers of 6 respondents have passed H.S.C. Mothers of two respondents are post graduated and among the 35 students Arts and Humanities faculty also mothers of two respondents are postgraduate. On the other hand three mothers of Business studies faculty of D.U are post graduated.
Before starting survey I have incorporated some theoretical discussion for searching deeply the objectives. On the basis of the data and the theoretical part discussion of collected data has been incorporated in this chapter. Before moving towards main discussion total respondents for the study has been given below in a table:
Table : Respondents for the study
The subsequent table shows respondents from D.U. and J.U. Faculties of respondents have also shown here.
| Faculty | Dhaka University | J.U. |
| Arts and Humanities | 35 | 17 |
| Social Science | 31 | 14 |
| Business Studies | 21 | 5 |
| Biology | 12 | 8 |
| Law | 1 | 1 |
| Earth | 1 | 0 |
| Mathematical | 14 | 11 |
| Pharmacy | 3 | 0 |
| Total | 118 | 56 |
174 | ||
The number of respondents have selected proportionately. Among eleven respondents of Mathematical and Physical Science faculty there are two respondents of Pharmacy department and one from Environmental Science department.
Socio-economic background of respondents
The first objective in this study is to identify the socio-economic background of respondents. Family is the cornerstone of the social life. In one scenario, school students from low socio-economic background are at a disadvantage in schools because they lack an academic home environment, which influences their academic success at school. Another scenario argues that school and neighborhood environment influences academic success, so that low socio-economic background schools are low performing, and that only extremely resilient young people can escape the fate of low academic achievement (Rothman Sheldon, 2003). On the basis of the Satisfaction of family life the work effectiveness in the other matters of life is accelerated. Socio-economic background will be analyzed below with some indicators. Those are:
1) Education of Mother
2) Occupation of Mother
3) Education of father
4) Occupation of father
5) Size of the family
6) Family income
7) Residence
8) Religion
In J.U education of mother of science faculty students is highest in H.S.C. level. Education of mother of D.U students is high in Science faculty students. In S.S.C level number of mothers is more than the D.U students.
Table : Distribution of respondents by faculty, and education of mother
| Education of Mother | D.U. | J.U. | Total | |||||||||||||||
| Arts | S.S | B.S | Biology | Law | Science | Total | Arts | S.S | B.S | Biology | Law | Science | Total | |||||
| No. | No. | No. | No. | No. | No. | No. | % | No. | No. | No. | No. | No. | No. | No. | % | No. | % | |
| Below S.S.C | 7 | 6 | 3 | 0 | 0 | 1 | 17 | 14.41 | 2 | 4 | 0 | 2 | 0 | 0 | 8 | 14.29 | 25 | 14.37 |
| S.S.C | 14 | 10 | 6 | 6 | 1 | 3 | 40 | 33.90 | 7 | 5 | 2 | 2 | 0 | 4 | 20 | 35.71 | 60 | 34.48 |
| H.S.C | 11 | 8 | 7 | 3 | 0 | 8 | 37 | 31.36 | 4 | 3 | 1 | 2 | 1 | 5 | 16 | 28.57 | 53 | 30.46 |
| Masters | 2 | 3 | 3 | 1 | 0 | 2 | 11 | 9.32 | 2 | 1 | 1 | 2 | 0 | 0 | 6 | 10.71 | 17 | 9.77 |
| Others | 1 | 4 | 2 | 2 | 0 | 4 | 13 | 11.02 | 2 | 1 | 1 | 0 | 0 | 2 | 6 | 10.71 | 19 | 10.92 |
| Total | 35 | 31 | 21 | 12 | 1 | 18 | 118 | 100 | 17 | 14 | 5 | 8 | 1 | 11 | 56 | 100 | 174 | 100 |
- Among 17 students of J.U., 7 students’ mothers have passed S.S.C. Mothers of two students have passed Masters. On the other hand among 11 students of Mathematical and Physical science 40% students mothers have passed Degree. 5 students’ mothers have passed H.S.C and the percentage is 31.25%. The students of MPS (Mathematical and Physical Science) there are no students whose mothers are below S.S.C.
- On the other hand in the Biology faculty there are 8 respondents for this study among them 33.33% student’s mothers have passed Masters, 25% students mothers have passed H.S.C.
Table : Statistical value for education of mother
Statistical functions | Results |
| Correlation | The value of the correlation of the two factors, education of mother and the faculty of the students is 0.244807 in D.U. on the other hand the value of the correlation between the two factors in J.U is 0.133803. So, data result shows positive relation between education of mother and faculty. |
Occupation of mother:
A child having a working mother is psychologically different from the child whose mother is not involved with any occupation outside the home (Juanita H. Williams, 1997). From the family the psychological set up grow up among child. In this research keeping similarities with literature the relation between occupation of mother and faculty of respondents have been shown.
In the following table two variables have shown under each University. Here five faculties have been shown specifically. In the left of the table occupation of mother will be incorporated.
- In the Arts and Humanities faculty of D.U among 35 students 8.57% mothers are teacher. On the Hand in the J.U among the 17 students 0% mothers are teacher. Mothers of 5.71% respondents in D.U of this faculty are involved with the government service. On the other hand mother of 1 respondent is involved with the government services and the percentage is 5.88%. Accordingly 29 and 16 respondents’ mothers’ are housewife. The percentage is 82.86% and 94.12%. In the D.U mother of one respondent is a Business person.
- Occupation of mother from the Law faculty respondents the respondent of D.U. opined that her mother is a teacher on the other hand mother of the respondent from J.U. have been said that her mother is a housewife.
The findings of this portion reveal that in teaching profession there are total 3 mothers of respondents from J.U. and 10 mothers from D.U. The percentage is highest among the students of D.U. The percentages of occupation in government job in J.U and D.U are 1.79% and 5.17%.
The highest percentage of occupation of mother in J.U. and D.U is housewife. The percentages are 87.5% in J.U. and 82.76% in D.U. In the others occupation 3 and 4 students mothers are involve with business, private job etc in J.U. and in D.U.
Table : Relation with faculty and occupation of mother
Faculty
Occupation | Arts | Social Science | Business studies | Biology | Science | Total | ||||||||||||||||||
| J.U. | D.U. | J.U. | D.U. | J.U. | D.U. | J.U. | D.U. | J.U. | D.U. | J.U. | D.U. | |||||||||||||
| No. | % | No. | % | No. | % | No. | % | No. | % | No. | % | No. | % | No. | % | No. | % | No. | % | No. | % | No. | % | |
| Teacher | 0 | 0 | 3 | 8.57 | 1 | 7.14 | 3 | 9.68 | 0 | 0 | 1 | 5.26 | 1 | 12.5 | 1 | 8.33 | 1 | 9.09 | 1 | 7.143 | 3 | 5.36 | 9 | 8.62 |
| Government Job | 1 | 5.88 | 2 | 5.71 | 0 | 0 | 0 | 0 | 0 | 0 | 1 | 5.26 | 0 | 0 | 1 | 8.33 | 0 | 0 | 2 | 14.29 | 1 | 1.79 | 6 | 5.17 |
| Housewife | 16 | 94.12 | 29 | 82.86 | 11 | 78.57 | 27 | 87.10 | 5 | 100 | 17 | 89.47 | 7 | 87.5 | 10 | 83.33 | 9 | 81.82 | 13 | 64.29 | 48 | 87.5 | 96 | 82.76 |
| Others | 0 | 0 | 1 | 2.86 | 2 | 14.28 | 1 | 3.23 | 0 | 0 | 0 | 0 | 0 | 0 | 0 | 0 | 1 | 9.09 | 2 | 14.29 | 3 | 5.36 | 4 | 3.45 |
| Total | 17 | 100 | 35 | 100 | 14 | 100 | 31 | 100 | 5 | 100 | 19 | 100 | 8 | 100 | 12 | 100 | 11 | 100 | 14 | 100 | 55 | 100 | 115 | 100 |
The subsequent table will show percentages of occupation of mothers of respondents according to faculties.
- In the Social Sciences there are 9.68% mothers in D.U on the other hand in J.U 7.14% respondents’ mothers are teachers. In the social sciences faculty of both Universities the highest percentage of mothers’ occupation is housewife. The percentage is accordingly 78.10% and 87.10% in Jahangirnagar and D.U.
- In Business faculty of J.U all of the respondents’ mothers are housewife. The total respondents is Business faculty is 5. On the other hand in the D.U 17students have said that their mother is housewife.
- In Science faculty of D.U 14.29% respondents’ mothers have government job and others job like business, private job etc.
From the above values though both of them are highly negative but among them in the D.U we can say that there are a few relations with the occupation of mothers and the faculty of the students then in the J.U.
Table 4.5: Statistical functions and values
Statistical application | Results |
| Correlation | The correlation between the Mothers occupation and the faculty of the respondents of the D.U is -0.01593 on the other hand in the J.U the correlation between the two variables are -0.05467. |
| ANOVA | P-value of two variables occupation of mother and faculty of respondents of D.U 0.917391. P-value of two variables in J.U is 0.907749. Results show that there is no significant relation between occupation of mother and faculty of respondents. |
Finally the findings of this portion provides the result that the occupation of mother in not much influential indicator in selection of faculty. The reason behind this is there is very few number of mothers has occupation. Though the result shows low and negative influence but the data represented in the table shows that science faculty students’ mothers in D.U. have the occupation more the J.U. science faculty students. In the social science faculty the occupation of mother of respondents from department of Journalism and Public Administration their mother has business and private job.
So, the author can conclude in this statement that the occupation o mother influence in the selection of faculty and department in both of the Universities.
Education of Father:
Parents transmit some abilities genetically, they may influence children’s development by stimulating them, and they may influence children’s decisions. This paper shows that parents’ education is an important determinant of children’s education, but hardly an exclusive part of the common family background that influences the educational attainments of siblings from the same family. From our analyses and from previous works, there is evidence that father’s education is more important in influencing children’s educational attainment (John Ermisch and Chiara Pronzato, 2010)
In the following a table has shown by incorporating the variables education of father and the faculty of respondents. Here in the left of the table the education of father will be incorporated. And under the two educational institutions these two has been shown. The findings of the above table has discussed below with some explanations broadly:
- The percentage of education of fathers below S.S.C is 12.9% in the social science faculty of D.U. On the other hand in J.U the highest percentage is in the Arts faculty with the percentage of 17.6%. In the total percentage of below S.S.C. is 6.8% in D.U. and 7% in J.U.
Table: Education of father and faculty of students
| Faculty
Education | Dhaka University | J.U. | Total | |||||||||||||||||||||||
| Arts | S.S | B.S | Biology | Science | Total | Arts | S.S | B.S | Biology | Science | Total | |||||||||||||||
| No. | % | No. | % | No. | % | No. | % | No. | % | No. | % | No. | % | No. | % | No. | % | No. | % | No. | % | No. | % | No. | % | |
| Below S.S.C. | 4 | 11.4 | 4 | 12.9 | 0 | 0 | 0 | 0 | 0 | 0 | 8 | 6.8 | 3 | 17.6 | 1 | 7.1 | 0 | 0 | 0 | 0 | 0 | 0.0 | 4 | 7.3 | 12 | 7.0 |
| S.S.C. | 5 | 14.3 | 2 | 6.5 | 0 | 0 | 1 | 8.3 | 1 | 5.6 | 9 | 7.7 | 1 | 5.9 | 4 | 28.6 | 0 | 0 | 1 | 12.5 | 0 | 0.0 | 6 | 10.9 | 15 | 8.7 |
| H.S.C | 8 | 22.9 | 7 | 22.6 | 3 | 14.3 | 2 | 16.7 | 4 | 22.2 | 24 | 20.5 | 3 | 17.6 | 2 | 14.3 | 2 | 40 | 2 | 25 | 2 | 18.2 | 11 | 20.0 | 35 | 20.3 |
| Honors | 1 | 2.9 | 2 | 6.5 | 1 | 4.8 | 0 | 0 | 2 | 11.1 | 6 | 5.1 | 1 | 5.9 | 0 | 0.0 | 0 | 0 | 0 | 0 | 1 | 9.1 | 2 | 3.6 | 8 | 4.7 |
| Masters | 3 | 8.6 | 6 | 19.4 | 9 | 42.9 | 5 | 41.7 | 4 | 22.2 | 27 | 23.1 | 5 | 29.4 | 2 | 14.3 | 1 | 20 | 3 | 37.5 | 3 | 27.3 | 14 | 25.5 | 41 | 23.8 |
| Others | 14 | 40 | 10 | 32.3 | 8 | 38.1 | 4 | 33.3 | 7 | 38.9 | 43 | 36.8 | 4 | 23.5 | 5 | 35.7 | 2 | 40 | 2 | 25 | 5 | 45.5 | 18 | 32.7 | 61 | 35.5 |
| Total | 35 | 100 | 31 | 100 | 21 | 100 | 12 | 100 | 18 | 100 | 117 | 10o | 17 | 100 | 14 | 100 | 5 | 100 | 8 | 100 | 11 | 100 | 55 | 100 | 172 | 100 |
Note: *Pharmacy and environment faculty of D.U. has been calculated with the Science faculty and Law faculty has not added in table but in discussion
- The percentage of education of father in the level of S.S.C. is 10.9% in J.U. and 7.7% in D.U. The percentage of S.S.C. pass is in the faculty of Arts in D.U. with 14.3% and in J.U. 28.6% is the highest percentage. The highest percentage of S.S.C pass of the education of father is among the respondents of Social science.
- In the level of H.S.C. highest percentage is in J.U with 5.7% among the total respondents. The highest percentage is 9.1% in the science faculty on the other hand in D.U. the highest percentage is among the students of science faculty with the percentage of 11.1%.
- In Biology faculty 37.5% students fathers have passed Masters which is highest among the respondents of J.U on the other hand in D.U the highest 42.9% respondents of Business studies faculty have said that their fathers have passed Masters. In science faculty the percentage is 41.7% in D.U.
- In terms of total of the option others that included Diploma engineering, L.L.B, M.B.B.S, and B.Sc degrees were included. This percentage is high in D.U with the percentage of 38.9% and 32.7% is in J.U. 40% is in the Arts faculty, and 38.1% is in the Business studies faculty. In J.U. 40% fathers of Business faculty students and 45.50% of science faculty students have passed engineering, L.L.B, and B.A. Two respondents of Law faculty respondents have passed B.A.
Table: Statistical values
Statistical functions | Results |
| Correlation | The relation between the two variable faculties of students and education of father is 0.180708 in JU On the other hand in D.U. the relation between two variables is 0.148668. So, there is positive relation between the two variables in both Universities. In J.U. the relation is closer than D.U. That means the higher the education of father and higher the faculty that means science faculty. This is same in D.U |
After the discussion of the table and the statistical application the author has come in this decision that the education of father influences the education of students. The Science faculty students’ fathers have more Masters, H.S.C, Honors and others (L.L.B, M.B.B.S, engineering and post doctoral degree). If the comparison comes between Universities then it can be concluded that the education of father of the respondents of D.U are higher than the respondents of J.U.
Occupation of father of respondents:
Family background is a multidimensional concept in the sense that families have different types of resources available, which are contributed by both parents. The relative influences of these resources and whether or not these relative influences changed over time can give a richer picture of the changing influence of families on the education (Maarten L. Buis, 2012). The author has said about the occupation of father as the influence in the education of students.
The following table shows that fathers’ occupation of respondents is government service. In Arts and Humanities faculty of D.U. 14.29% occupation of father is agriculture on the other hand 0% in Science faculty. In Arts and Humanities faculty of J.U. 18.75% occupation of father is agriculture and 0% in Science faculty. In Arts and Humanities faculty of D.U. 0% occupation of father is Doctor and 6.67% in Science faculty. In Arts and humanities faculty of J.U. 6.25% occupation of father is Doctor and 0% in Science faculty, 20% occupation of father is engineering.
Table 4.8: Relation between occupation of father and faculty of respondents
| Fathers’ Occupation | D.U | J.U | ||||||||||||||||||||||
| Arts | S.S. | B.S. | Biology | Science | Total | Arts | S.S. | B.S. | Biology | Science | Total | |||||||||||||
| no | % | no | % | no | % | no | % | no | % | no | % | no | % | no | % | no | % | no | % | no | % | no | % | |
| Teacher | 5 | 14.29 | 2 | 6.45 | 4 | 19.05 | 0 | 0 | 1 | 6.67 | 12 | 10.62 | 2 | 12.5 | 2 | 15.38 | 2 | 40 | 0 | 0 | 2 | 20 | 8 | 16 |
| Agriculture | 5 | 14.29 | 0 | 0 | 0 | 0 | 1 | 9.09 | 0 | 0 | 6 | 5.31 | 3 | 18.75 | 1 | 7.69 | 0 | 0 | 1 | 16.67 | 0 | 0 | 5 | 10 |
| Doctor | 0 | 0 | 1 | 3.23 | 1 | 4.76 | 0 | 0 | 1 | 6.67 | 3 | 2.65 | 1 | 6.25 | 0 | 0 | 0 | 0 | 0 | 0 | 0 | 0 | 1 | 2 |
| Engineer | 0 | 0 | 0 |
| 0 | 0 | 1 | 9.09 | 1 | 6.67 | 2 | 1.77 | 0 | 0 | 0 | 0 | 0 | 0 | 0 | 0 | 2 | 20 | 2 | 4 |
| Government service | 11 | 31.43 | 10 | 32.26 | 8 | 38.10 | 4 | 36.36 | 9 | 60 | 42 | 37.17 | 5 | 31.25 | 3 | 23.08 | 1 | 20 | 4 | 66.67 | 3 | 30 | 16 | 32 |
| Business | 7 | 20 | 7 | 22.58 | 3 | 14.29 | 3 | 27.27 | 3 | 20 | 23 | 20.35 | 3 | 18.75 | 6 | 46.15 | 1 | 20 | 1 | 16.67 | 2 | 20 | 13 | 26 |
| Banker | 1 | 2.86 | 3 | 9.68 | 3 | 14.29 | 1 | 9.09 | 0 | 8 | 7.08 | 1 | 6.25 | 0 | 0.00 | 1 | 20 | 0 | 0 | 1 | 10 | 3 | 6 | |
| Others | 6 | 17.14 | 8 | 25.81 | 2 | 9.52 | 1 | 9.09 | 0 | 17 | 15.04 | 1 | 6.25 | 1 | 7.69 | 0 | 0 | 0 | 0 | 0 | 0 | 2 | 4 | |
| Total | 35 | 100 | 31 | 6.45 | 21 | 100 | 11 | 100 | 15 | 100 | 113 | 100 | 16 | 100 | 13 | 100 | 5 | 100 | 6 | 100 | 10 | 100 | 50 | 100 |
Statistical functions | Results |
| Correlation | Correlation between occupation of father and faculty of respondents is -0.0386 in D.U. Correlation between occupation of father and faculty of respondents is -0.01643. |
| ANOVA | P-value of ANOVA test is 0.381303 between occupation of father and faculty of respondents in D.U. In J.U P-value is 0.304774. Result shows that the relation between two variables is not significant. |
Table: Statistical applications and value
Occupation of father is an influential factor in the education of respondents. Results show negative relation between two variables. But percentage shows that variation of occupation influence variation of faculties and departments.
Size of the family and faculty:
Family size and family birth order are fundamental in academic success. Parents should maintain high commitment for optimal range for academic success because the number of children in the family birth order will help in interactions, supports and financial assistance (Tenibiaje Dele Joseph, 2009).
Tenibiaji has said about the family birth and the commitment of the parents to educate child. In the present research author is going to present a table to show the relation between family size and faculty of the students.
In the academic performance the contribution of family size is significant as identified by Tenibiaji. The present author has also found some relevance with the opinion of Tenibiaji. The findings of the responses have been described below:
- In the range 0-2, 2.6% respondents of D.U and 1.8% respondents from J.U. In 1.8% 9.1 is from science faculty from the department of Pharmacy of J.U. on the other hand in D.U 6.5% from social science and 4.8% from Business studies faculty.
- The most significant range of family size is 3-5. Total 126 respondents from D.U and J.U are from this range of family members. This is important to concentrate on the matter that the family size of the science faculty students are short than other faculty students. 88.9% student’s family size is 3-5 and 60% of Arts faculty students have 3-5 range of family size. In J.U the family size is 3-5 highest in the Biology faculty 87.5%, in Business studies 80% and in Arts there is 88.2%.
- In the range of 6-8 27.3% students from science, 30.8% in social science, 12.3% from the J.U. In D.U in the range of 6-8, 40% from arts, 11.1% from science, 25% from Biology and 28.6% business studies. So, we can conclude in this way that in D.U and J.U the large family size of students is in the Arts and social science faculty.
Table : Statistical functions and value
Statistical functions | Results |
| Correlation | The value of correlation between faculty and size of family in J.U is 0.028289. On the other hand in D.U the value of correlation between size of the family and faculty of the respondents is -0.14249. |
Family income and faculty:
Parents of moderate to high income and educational background held beliefs and expectations that were closer than those of low-income families to the actual performance of their children, Low-income families instead had high expectations and performance beliefs that did not correlate well with their children’s actual school performance (Pamela E. Davis-Kean, 2005). This portion of the socio economic background has been described with the above idea.
The above table consists of three variables those are faculty, income of the family, and Universities. In the left of the table the family income has been shown this has been calculated through the frequency distribution method.
- The findings of the study reveal that Art and social science faculty students 35.29%and 35.71% from the range of family income 23600-44200 and 44200-64800. In D.U the percentage is 45.16% in the social science faculty and 48.57% in the Arts faculty are in the range of 3000-23600.
- The research further shows that in the Business faculty the highest percentage is 40% both in 64800-85400 and 85400-106000 in J.U. On the other hand in Business studies faculty of D.U the highest percentage is among the range 64800-85400 the percentage is 33.33%.
- In J.U the highest percentage of family income is in range of 85400-106000 with the percentage of 45.45%. On the other hand in D.U the highest percentage is 38.89% in the income range of 64800-85400.
- Finally in Biological faculty 50% is in 64800-85400 in J.U on the other hand in biological faculty of D.U the percentage is 41.67%. If we compare two universities the highest percentage of family income is in the range of 23600-44200 and the highest percentage of family income is an important influential factor of education.
- The findings of the table family income and the faculty of students reveal that there is relation between the faculty and family income of the respondents because in present the higher education is very much costly and for getting admission in the universities family needs money to reach the students towards a satisfactory level.
Statistical functions | Result |
| Correlation | Correlation between the two variables family income and the faculty of the respondents in D.U is 0.446801. In the relation between the faculty and family income in J.U is 0.512724. So, there is positive relation between two variable that the higher the family income the higher the faculty. |
Table : Statistical functions and values
After having the results we can conclude that the research shows that in the modern educational system generally the income level of the family should be high or moderate. The respondents with medium family income get more chance in the admission.
Residence of respondents:
In the socio-economic background residence of the respondents is an important matter of concern. In this study residence of respondents includes living in hall and in home (Dhaka). To investigate the influence of residence in higher education of women the following table has been incorporated. Parents of rural students were less likely to expect their children to advance their education. Rural schools should consider ways to assist parents and students as they consider the options for advanced education (McCracken, 1991).
Table: Relation between residence and faculty of respondents
Faculty | D.U | J.U | ||||||
Hall | Home | Hall | Home | |||||
No. | % | No. | % | No. | % | No. | % | |
| Arts | 29 | 34.94 | 6 | 17.14 | 17 | 31.48 | 0 | 0 |
| S.S. | 26 | 31.33 | 5 | 14.29 | 14 | 25.93 | 0 | 0 |
| Business Studies | 10 | 12.05 | 11 | 31.43 | 4 | 7.41 | 1 | 50 |
| Biology | 7 | 8.43 | 5 | 14.29 | 8 | 14.81 | 0 | 0 |
| Law | 0 | 0.00 | 1 | 2.86 | 0 | 0.00 | 1 | 50 |
| Science | 11 | 13.25 | 7 | 20.00 | 10 | 18.52 | 0 | 0 |
| Total | 83 | 100.00 | 35 | 100.00 | 54 | 100.00 | 2 | 100 |
Note: In D.U. Earth and Environment and Pharmacy faculty has been included in science faculty
The above figure and the table have shown that In the J.U among the 56 respondents 2 students live in the Dhaka in their home. On the other hand the 54 students live in the hall. The above table shows clearly that respondents D.U. live in Home in Dhaka. 31.43% respondents of D.U live in Dhaka and they are from Business studies faculty. In J.U 2 respondents of J.U live in Dhaka.
So, students of D.U live more in Dhaka than students of J.U. They read in University with huge facilities of Dhaka city but students of D.U. have huge problems about seats in hall. J.U. is a residential University and students have huge utility facilities with low cost the number of living in Dhaka city is very few.
Table : Statistical application
Statistical Functions | Results |
| Correlation | Correlation between residence and faculty of respondents in D.U. is 0.071268. In J.U. the value of correlation is 0.166099. So, there is weak positive relation between residence and faculty of respondents. |
Religion of the respondents:
Education is a quality of human being. It comprises some conditions. As a whole we can called it as socio-economic background. Religion is an important influential factor. Bangladesh is a Muslim country. In 2009 the population was estimated at 156 million. About 90% of Bangladeshis are Muslims and the remainders are mostly Hindus (en.wikipedia.org).
Totalfrom 172 students.
The research findings have been clearly shown that there are two totals. In the bottom of the table total shows the sum of each religion according to some faculties. In the right side of the table there is also a total showing the sum of the students in different faculties.
- The table shows that the number of students in the religion of Islam is highest than the other religions. There are total 43 respondents under the religion of Islam in J.U. In D.U total number of Islam religion is 111. The numbers of Hindu religion in selected Universities are 10 and 7 in Jahangirnagar and D.U. There are single students in the religion of Christian and Buddhist in J.U.
- In J.U though there is 30% respondent of 10 Hindu students in Science faculty but there is no students from this religion from the science background. Among 10 students the percentage of Hindu students is higher in the faculty of Arts that is 50%. On the other hand the parentages of Hindu students are higher in the faculty of Arts and humanities of D.U among 7 students. The percentage is 42.86%. But in the faculty of Science in D.U there is no one from the Hindu religion. Though in J.U.
- The result of the table shows that there are very few students from Hindu religion in both of the Universities are low. But in J.U the percentage is high than the percentage of D.U students.
Table : Statistical value
Statistical functions | Results |
| Correlation | Relation between the two variable faculty and religion of respondents in D.U is -0.14915. And in J.U the value of correlation between the two variables is -0.06443. Two results shows negative relation that the higher the religion the lower the faculty. |
| Chi test | The value of chi test between the religion and educational institution is |
0.026469. So, there is significant level of relation between the religion and educational institution.
The statistical test of the religion and faculty and educational institutions shows that there is significant relation between religion and faculties of Universities.
Higher education and empowerment:
“Education opens the door to opportunity and choice for women. It is the key to overcoming oppressive customs and traditions that have relegated girls and women to the status of second class citizens in their families and in their societies” (From the book of Nazmunnesa Mahtab, 2012). Some aspects of empowerment through education has included in the following:
- Education increases the economic, social and political opportunities available to women.
- Education empowers women to take control over life.
- Direct benefit-more knowledge, skills, income earning opportunities
In the present study the author has accumulated to connect and measure the influence of higher education to empowerment. The socio-economic background varies according to the faculties of both Universities. In case of empowerment, higher education in the Universities influence very much. In empowerment, power is shown more in terms of increasing the issues of:
- Choice
- Voice
- Control
- Autonomy
In terms of encouraging the above four things some important indicators have been selected for the measurement of empowerment those are: Influence decisions of family, Involvement with profession, choice of profession, Involvement in organization, Willingness to take risk etc.
Involvement with profession:
Some important measures have been taken to measure Autonomy of women in the research work of “Women empowerment and demographic change” by Tapash Kumar Biswas. Those are:
- Exercise control on family income and expenditure
- Buy household assets
- Initiate income generating activities (IGA) independently
- Work outside home etc.
In this segment involvement of respondents with profession will be analyzed. Percentage of respondents involve with profession will indicate the empowerment level. Not only that to measure involvement with profession here two controlling variable has been added those are residence and faculty of respondents. The following table shows relationship among three variables.
Table : Relation with involvement with profession, residence, and faculty of respondents
Faculty | J.U. | D.U. | ||||||||||||||
Hall | Home | Hall | Home | |||||||||||||
Yes | No | Yes | No | Yes | No | Yes | No | |||||||||
No. | % | No. | % | No. | % | No. | % | No. | % | No. | % | No. | % | No. | % | |
| Arts and Humanities | 0 | 0 | 17 | 36.17 | 0 | 0 | 0 | 0 | 8 | 38.10 | 21 | 33.87 | 0 | 0 | 6 | 24 |
| Social Science | 2 | 28.57 | 12 | 25.53 | 0 | 0 | 0 | 0 | 2 | 9.52 | 18 | 29.03 | 4 | 40 | 7 | 28 |
| Business studies | 0 | 0 | 4 | 8.51 | 1 | 50 | 0 | 0 | 7 | 33.33 | 5 | 8.06 | 3 | 30 | 6 | 24 |
| Biology | 1 | 14.29 | 7 | 14.89 | 0 | 0 | 0 | 0 | 3 | 14.29 | 6 | 9.68 | 1 | 10 | 2 | 8 |
| Law | 1 | 14.29 | 0 | 0 | 0 | 0 | 0 | 0 | 0 | 0 | 1 | 1.61 | 0 | 0 | 0 | 0 |
| Earth and Environment | 0 | 0 | 0 | 0 | 0 | 0 | 0 | 0 | 0 | 0 | 0 | 0 | 1 | 4 | ||
| Mathematical and Physics/ Science | 3 | 42.86 | 7 | 14.89 | 1 | 50 | 0 | 0 | 1 | 4.76 | 9 | 14.52 | 1 | 10 | 3 | 12 |
| Pharmacy | 0 | 0 | 0 | 0 | 0 | 0 | 0 | 0 | 0 | 0 | 2 | 3.23 | 1 | 10 | 0 | 0 |
| Total | 7 | 100 | 47 | 100 | 2 | 100 | 0 | 0 | 21 | 100 | 62 | 100 | 10 | 100 | 25 | 100 |
In case of involvement with the profession the respondents of Mathematical and physical science the percentage is very high and that is 42.86% and they live in hall. Among 54 students live in hall 7 students involve with the profession. Among two students live in the home they are 100% involve with the profession and the students from the Business faculty and Mathematical and Physical science in J.U.
On the other hand the percentage is high among the respondents of Arts and humanities faculty and social science in D.U. Among 83 respondents live in the hall 21 respondents are involve with profession.
- 12.50% of total students of J.U live in hall and involve with profession. 52.54% respondents are living in hall but not involve with profession. 8.47% students are involved with profession and live in Dhaka and 21.19% respondents live in Dhaka and not involve with profession.
- In the following there is a figure regarding involvement with profession according to Universities. In the horizontal line universities have been incorporated and in the vertical line the number of involvement in the organizations has been presented.
In the figure among 56 respondents 47 persons are not involve with the organization and 9 respondents are involved with profession. On the other hand in D.U 87 persons are not involved with any profession and 31 respondents are involved with profession.
Statistical functions | Results |
| Chi test |
|
| Correlation |
|
Table : Statistical test of variables
16.07% respondents of J.U involve with profession and 26.27% respondents of D.U involve with profession. Residence is a influential factor as chi test value is significant in J.U. But residence is not an influential factor in involvement with profession in D.U. So, respondents of D.U are empowered then respondents of J.U. Correlation value say that there is negative relation between faculty and involvement with profession. In D.U Arts and humanities faculty and involvement with profession has positive relation as like as the percentage shows.
Involvement with organizations:
Organization is Shared values, beliefs, and norms held by members of an organization are known as organizational culture. A supportive culture that values employees and their contributions facilitates empowerment. Creative problem solving is supported by an organizational culture with strong values for information sharing, fair and constructive judgment of ideas, and reward and recognition for new ideas (Yukul, A. Gary and Becker, Wendy S. 2006). In the University campus there are huge types of organizations and involvement of organization helps to explore some qualities of female students.
In this segment involvement of respondents with profession will be analyzed. Percentage of respondents involve with profession will indicate the empowerment level. Not only that to measure involvement with profession here two controlling variable has been added those are residence and faculty of respondents. The following table shows relationship among three variables.
The highest percentage 33.33% of involvement with organization in J.U is among the respondents of social science. Among the students of Biology faculty the percentage is 27.78% and 11.11% in science faculty. In the faculty of law there is one respondent of this study and she stay in hall and also involve with organization. In the D.U 23 respondents involve with organization and among them 30.43% respondents stay in hall and involve with organization. In the social science faculty the percentage is 26.09%, in Biology faculty the percentage is 21.74%. In D.U total 35 respondents live in Dhaka among them 8 students are involve with organization. 75% respondents of D.U live in Dhaka and involve with the organization.
Table : Relation among faculty, residence and involvement with organization
Faculty | J.U | D.U | ||||||||||||||
Hall | Home | Hall | Home | |||||||||||||
Yes | No | Yes | No | Yes | No | Yes | No | |||||||||
| No. | % | No. | % | No. | % | No. | % | No. | % | No. | % | No. | % | No. | % | |
| Arts and Humanities | 4 | 22.22 | 13 | 36.11 | 0 | 0 | 0 | 0 | 7 | 30.43 | 21 | 35 | 0 | 0 | 7 | 25.93 |
| Social Science | 6 | 33.33 | 8 | 22.22 | 0 | 0 | 0 | 0 | 6 | 26.09 | 14 | 23.33 | 6 | 75 | 5 | 18.52 |
| Business studies | 0 | 0.00 | 4 | 11.11 | 0 | 0 | 1 | 50 | 2 | 8.70 | 11 | 18.33 | 2 | 25 | 6 | 22.22 |
| Biology | 5 | 27.78 | 3 | 8.33 | 0 | 0 | 0 | 0 | 5 | 21.74 | 4 | 6.67 | 0 | 0 | 3 | 11.11 |
| Law | 1 | 5.56 | 0 | 0.00 | 0 | 0 | 0 | 0 | 1 | 4.35 | 0 | 0 | 0 | 0 | 0 | 0.00 |
| Earth and Environment | 0.00 | 0 | 0.00 | 0 | 0 | 0 | 0 | 0 | 0.00 | 0 | 0 | 0 | 0 | 1 | 3.70 | |
| Mathematical and Physics/ Science | 2 | 11.11 | 8 | 22.22 | 0 | 0 | 1 | 50 | 0 | 0.00 | 10 | 16.67 | 0 | 0 | 4 | 14.81 |
| Pharmacy | 0 | 0.00 | 0 | 0.00 | 0 | 0 | 0 | 0 | 2 | 8.70 | 0 | 0 | 0 | 0 | 1 | 3.70 |
| Total | 18 | 100.00 | 36 | 100.00 | 0 | 0 | 2 | 100 | 23 | 100.00 | 60 | 100 | 8 | 100 | 27 | 100.00 |
TableStatistical value
Statistical function | Results |
| Chi test |
The chi test in excel the value between the two variable educational institutions and the involvement with the organization is 0.000195. So, we can say that there is close relation between educational institution and the involvement with organization.
Correlation
- The value of correlation between the two variable residence and involvement with organization in J.U is 0.132453 and in D.U the value is 0.020513.
- Relation between faculty and involvement with organization in D,U. is 0.060347 in J.U. correlation between two variable is 0.016189
- So, we can conclude that though the relation is positive but very weak and there is no influence of residence in the involvement of the organization
After the above discussion we can conclude that in the J.U the percentage of the involvement in organization is 32.14% and in D.U the percentage is 26.27%. The percentage of not involving in organization is 67.86% in Jahangirnagar and 73.73% is in the D.U. So, from the side of percentage the respondents of Jahangirnagar are more involve with the organization than D.U students.
Influence decisions of family:
Here decision making power of respondents in family will be measured. Measuring decision making power will show a pathway to measure their empowerment. Influence in the decisions of family will be measured in this portion in two stages. One is relation with involvement with profession and influence in decisions of family. Another one is involvement with organization and influence in family.
In the subsequent table four variables have been incorporated those are faculty of the students, the level of influence in the family, involvement in the organization, Universities. In the left of the table faculty of respondents has been incorporated. In the top of the table under the option of the Universities the level of influence in the decisions and involvement with organization has been incorporated.
Decision making:
In J.U the highest number of influence in decisions of family is in Mathematical and Physical Science faculty with 26.92%. On the other hand in the moderate influence level Arts and Humanities faculty is highest in percentage that is 34.38%.
On the other hand in D.U 31.71% respondents of Arts and Humanities faculty influence in the decisions highly, in science faculty the percentage is 14.63%. Though the percentage is less than Arts faculty but this is more in terms of total 14 respondents of Science faculty. In the faculty of law of Jahangirnagar and D.U influenced highly in decisions of family.
Involvement with organization and decision making:
In the above table a part involvement with organization has also incorporated because this table will show both the number of respondents involve with organization and influence in decision making of the family. The part influence in the decisions includes (High, and moderate) two options and also the involvement with organization means (Yes, No).
Here in the table it shows that among 17 respondents of Arts and humanities faculty from the J.U 4 respondents are involve with organization. Among 4 respondents 12.5% respondent influence highly in the decisions of the family and involve with organization. On the other hand 30% respondents are involved with organization but they influence decisions of the family moderately.
Table 4.22: Influencing decisions of family
| Faculty | J.U | D.U | ||||||||||||||||||||||
High | Moderate | High | Moderate | |||||||||||||||||||||
Yes | No | Total | Yes | No | Total | Yes | No | Total | Yes | No | Total | |||||||||||||
| No. | % | No. | % | No. | % | No. | % | No. | % | No. | % | No. | % | No. | % | No. | % | No. | % | No. | % | No. | % | |
| Arts and Humanities | 1 | 12.5 | 5 | 31.25 | 6 | 23.08 | 3 | 30 | 8 | 38.10 | 11 | 34.38 | 3 | 30 | 10 | 32.26 | 13 | 31.71 | 4 | 18.18 | 18 | 32.73 | 22 | 28.57 |
| Social Science | 3 | 37.5 | 3 | 18.75 | 6 | 23.08 | 3 | 30 | 4 | 19.05 | 7 | 21.88 | 4 | 40 | 4 | 12.90 | 8 | 19.51 | 9 | 40.91 | 14 | 25.45 | 23 | 29.87 |
| Business studies | 0 | 0 | 2 | 12.5 | 2 | 7.69 | 0 | 0 | 3 | 14.29 | 3 | 9.38 | 2 | 20 | 8 | 25.81 | 10 | 24.39 | 2 | 9.09 | 9 | 16.36 | 11 | 14.29 |
| Biology | 1 | 12.5 | 1 | 6.25 | 2 | 7.69 | 4 | 40 | 2 | 9.52 | 6 | 18.75 | 0 | 0 | 2 | 6.45 | 2 | 4.88 | 5 | 22.73 | 5 | 9.09 | 10 | 12.99 |
| Mathematical and Physics/ Science | 2 | 25 | 5 | 31.25 | 7 | 26.92 | 0 | 0 | 4 | 19.05 | 4 | 12.50 | 0 | 0 | 6 | 19.35 | 6 | 14.63 | 0 | 0 | 8 | 14.55 | 8 | 10.39 |
| Pharmacy | 0 | 0 | 0 | 0 | 0 | 0 | 0 | 0 | 0 | 0 | 0 | 0 | 0 | 0 | 1 | 3.23 | 1 | 2.44 | 2 | 9.09 | 0 | 0 | 2 | 2.60 |
| Law | 1 | 12.5 | 0 | 0 | 1 | 3.85 | 0 | 0 | 0 | 0 | 1 | 3.13 | 1 | 10 | 0 | 0 | 1 | 2.44 | 0 | 0 | 0 | 0 | 0 | 0 |
| Earth and Environment | 0 | 0 | 0 | 0 | 0 | 0 | 0 | 0 | 0 | 0 | 0 | 0 | 0 | 0 | 0 | 0 | 0 | 0 | 0 | 1 | 1.82 | 1 | 1.30 | |
| Total | 8 | 100 | 16 | 100 | 24 | 100 | 10 | 21 | 100 | 32 | 100 | 10 | 100 | 31 | 100 | 41 | 100 | 22 | 100 | 55 | 100 | 77 | 100 | |
In the D.U there are 7 respondents involve with organization among 35 respondents in the faculty of Arts and humanities. Among students of this faculty 30% respondents influence highly in the family and involve with organization. On the other hand 32.26% respondents not involve with organization but influence the decisions of the family highly. In this faculty 18.18% respondents involve with organization and influence decisions moderately.
In Social Science faculty of J.U 6 respondents are involve with organization among 15 students. Among 6 respondents 3 involve with organization and influence highly in the family. Other 3 respondents of science faculty they involve with organization but the influence in the decisions of the family is moderate.
Highest respondents involve in the organization are from social science faculty of D.U. Among 31 respondents 13 respondents are involve with organization. 4 respondents are involved with organization and influence in the decisions of family highly. On the other hand 9 respondents are involved with organization but influence in the decisions moderately. This situation has been created because of some reasons those are:
- Family size is high
- Department of respondents
In J.U. 2 of Mathematical and Physical Science faculty students among 11 students are involve with organization and 9 students are not. But they have huge influence in the decisions of the family. The influence of the science faculty students is highest than other faculty respondents because of some reasons those are:
- Low size of the family
- High income of the family
- Influence of department is more effective than involvement in organization
- Family members are not highly educated
42.86% respondents of J.U influence highly in the decisions of family on the other hand 34.75% respondents of D.U influence highly in family. So, the empowerment level is higher in J.U.
| Statistical functions | Results |
| Chi test |
|
| Correlation |
|
Table : Statistical value
- The percentage of the influence of J.U students has more influence in their family than the D.U.
- There is very weak negative relation between the faculty, involvement with the organization and the influence of the decisions of family.
- There is deep relation between Universities and influence in the decisions of the family.
Involvement with profession and influence in decisions of family
Women in paid employment are significantly more likely to report to participate in the final decision making compared to those women who are not in paid employment (Acharya R. Dev and Bell Jacqueline S. 2010). In research work of ‘The role of higher educated women in decision making of the family’, Farzana Yesmin has said that there is high influence of educated women in the decisions of family. She has studied over forty educated women and found a significant relation between higher education and influence in the decisions of family. In this portion of present research influence of profession in decisions of family will be measured comparatively.
The following figure shows the evidence that involvement with profession has a positive relation between influence of decisions in the family and involvement with profession. 14 respondents of J.U influence highly in decisions of family among them 9 respondents are involved with profession. In D.U 49 respondents influence highly in decisions of family among them 29 respondents involve with profession.
In the two figures involvement in profession has shown in horizontal line and influence in the family has shown in vertical line. The figures show clearly that involvement with profession and decisions in family are closely related.
Table : Relation with involvement with profession and influence in decisions of family
| Involve with profession | J.U | D.U | Total | |||||||
Influence decisions of family | Influence decisions of family | |||||||||
High
| Moderate | Total | High | Moderate
| Total | |||||
No. | % | No. | % | No. | % | |||||
| Yes | 9 | 0 | 9 | 16.07 | 29 | 2 | 31 | 26.27 | 40 | 22.99 |
| No | 5 | 42 | 47 | 83.93 | 20 | 67 | 87 | 73.73 | 134 | 77.01 |
| Total | 14 | 42 | 56 | 100 | 49 | 89 | 118 | 100 | 174 | 100 |
Statistical function | Results |
| Correlation | Correlation value of involvement in organization and influence in decisions of family is 0.539396 in D.U. In J.U the value is 0.757937. |
Table: Statistical results
Types of decisions to influence
In this segment the types of decisions respondents influence have been added. These types include some decisions included in the questionnaire and not included into the questionnaire.
Table: Types of decisions to influence
| Options | J.U | D.U | Total | |||
No. | % | No. | % | No. | % | |
| Influence in the education of younger brother and sister | 35 | 42.17 | 68 | 39.53 | 103 | 40.39 |
| Decisions of buying a plot | 4 | 4.82 | 10 | 5.81 | 14 | 5.49 |
| Decision to select design of the house | 9 | 10.84 | 21 | 12.21 | 30 | 11.76 |
| Decision of elder brother or sister’s marriage | 12 | 14.46 | 29 | 16.86 | 41 | 16.08 |
| Decision of buying anything for family member | 17 | 20.48 | 34 | 19.77 | 51 | 20.00 |
| Influence in the land dispute of family | 6 | 7.23 | 10 | 5.81 | 16 | 6.27 |
| Total | 83 | 100.00 | 172 | 100.00 | 255 | 100.00 |
Note: Multiple answers were accepted
The highest influence in both University students is 42.17% in J.U and 39.53% in D.U is about influence in the education of younger brother or sister. The 2nd choice is decision of buying anything for the family members. In J.U the percentage is 20.48% and in D.U the percentage is 19.77%. The 3rd choice of the respondents is Decision of yielder brother and sisters marriage. Percentages are 14.46% in J.U and 16.86% in D.U
4th choice of the respondents is Decision of selecting the design of the house. In J.U the percentage is 10.84% and in D.U the percentage is 12.21%. 5th choices of the respondents are decision of buying a plot the percentage in J.U is 4.82% and in D.U the percentage is 5.81%. 6th choice of the respondents is Influence in the land disputes of the family. The percentages are 7.23% in J.U and 5.81% in D.U.
So, the higher important decision of the family lower the participation of the respondents but in this faculty of respondents influences very much.
Decisions of marriage and education:
Trishna in the University of Jahangirnagar from the department of Anthropology, she has said about the decisions of the family that she has influence more that is the education of her to select the subject. On the other hand she has also provided the opinion that in her marriage family will agree with her choice.
Provide suggestions to fathers’ occupation:
Amina Parvin from the department of Government and politics from the Jaahngirnagar University in the Masters she provide some important suggestions to her father to take new contract because his father is a contractor.
Selecting educational background:
Rashida Kabir, Department of Banking in the D.U shared her view that she has influence the decisions of the family in the selection of the educational background. She has chosen the commerce background with her own choice.
Opinion about the property of the family:
Rumana Yesmin a student of Nutrition and food science, in the D.U she has said that she has influenced decisions in the time when the family business of the family has been divided.
Subject and profession choice:
Touhida Islam, from the department of Law of the D.U, has said that she has selected this subject of her own and in future the profession will also be selected by her.
Buying anything for my family:
Sanzana Fareen Riva, a student of the department of Pharmacy, from the D.U has said that her family obeys her choice for buying thing for them and asks when if they buy any dress, furniture or something.
Medical of the parents:
Sumaya Haq Chandni, from the department of Pharmacy in the D.U, said that her parents are ill, for the selection of the doctor she provides the opinion.
Economic and future planning of the family:
Ishrat Jahan Ratna, from the department of Pharmacy, D.U she has provided the idea that for the future planning of the family and economic consideration for the family.
Choice of profession:
Empowerment is a process of transformation which enables a woman to exercise ‘freedom’, capability, to identify her strengths, power to use her resources skills to challenge her life situation, make their own choices and decisions and control over surroundings that affect her life (Nazmunnessa Mahtab, 2012). In this part the choice of the job by respondents will be included because this is choices that create change in their life.
Table 4.27: Likes to join job
| Like to involve in job or not | Universities | |||||
J.U. | D.U. | Total | ||||
No. | % | No. | % | No. | % | |
| Yes | 56 | 100 | 117 | 99.15 | 173 | 99.43 |
| No | 0 | 0 | 1 | 0.85 | 1 | 0.57 |
| Total | 5 | 100 | 118 | 100 | 174 | 100 |
Almost all of the respondents have said that they would like to involve with job after finishing the study. Among 174 respondents 170 respondents would like to involve with job. Percentage of respondents in J.U is 100% and in D.U the percentage is 99.15%. In D.U 1 respondent informed that she will not involve with profession because she would like to be a good housewife.
Table : Sectoral preferences for job
| Options | J.U | D.U | ||
No | % | No. | % | |
| Bangladesh Civil Services | 28 | 50 | 71 | 60.17 |
| NGO and development | 1 | 1.79 | 6 | 5.08 |
| Private job | 2 | 3.57 | 12 | 10.17 |
| Business | 2 | 3.57 | 1 | 0.85 |
| Bank job | 8 | 14.29 | 10 | 8.47 |
| Teaching | 10 | 17.86 | 11 | 9.32 |
| Politician | 1 | 1.79 | 0 | 0.00 |
| Others | 4 | 7.14 | 7 | 5.93 |
| Total | 56 | 100 | 118 | 100.00 |
In Jahangirnagar 50% respondents have said that they prefer Bangladesh Civil Service (BCS). On the other and in D.U 60.17% respondents have said about BCS. In the second position there is Teaching in the Jahangirnagar and the percentage is 17.86%. And the percentage of highest preferable job is Private Job the percentage is 10.17%. In the third position the job is Bank job and it is 14.29% in the J.U. On the other hand in D.U profession in the third position is teaching and percentage is 9.32%. In the option others this is 4th position and the percentage is 7.14%. In D.U 4th preferable job is teaching and the percentage is 9.32%. In the 5th position there are two preferable jobs in Jahangirnagar that is Business and Private Job in the percentage of 3.57% each. In the D.U the profession choice of students’ in 5th position is Bank Job and that is 8.47%. In the 6th position there are also two professions those are Politician and NGO and Development. The percentages are 1.79% each. On the other hand in the 6th position the preferable profession for the respondents of D.U NGO and Development the percentage is 5.08%.
In the above discussion there are huge similarities between Jahangirnagar and D.U students. But there are some dissimilarity also those are teaching is the 2nd choice of the respondents of Jahangirnagar but in D.U this is in 4th position and in 2nd position they prefer Private Job. Some reasons have been incorporated below about the choice of the profession comparatively.
Bangladesh Civil Service (BCS):
The 50% students of J.U prefer BCS for the future profession because this is honorable job, choice of their fathers, need to do something, social status, job security, most respectful, their family choice etc. On the other hand the 60.17% respondents of the D.U prefer this profession because it is a government job, job security, serve the people, development of the country, choice of father, dream, permanent Job etc. So, there is no huge difference between the opinions of the respondents.
Box: Case study about job selection
NGO and Development:
The 1.79% respondents of the J.U have said that they would like to be involved with job because this job is creative, like to work for society and people, self interest and good salary etc. On the other hand 5.08% percentages of the respondents would like to involve with the Ngo and development segment.
Teaching:
Students of both Universities have said about this job. Reasons to choose this job by respondents of D.U are, suitable for women, fascination to this, most prestigious then other Jobs, highly respectful, flexible. Side by side the students of J.U choose this profession because it is safe for women, social respect, flexible for women, providing moral education etc.
Bank Job:
Students of J.U prefer Bank job because this is favorable for women, own choice, more money and respect, subject field of Business studies faculty student etc. On the other hand students of D.U prefer this Job because of more salary, fair selection, social and economic security, own choice, dream to get a Bank Job.
Business:
Students of the D.U 0.85% would like to do this profession on the other hand in J.U 3.57% students would like to do this job because this is a challenging job, personal freedom, dream to be involve in a multinational company. The reasons are like to do something for the country, self dependent, and joint venture with friends.
Box .: Opinion of respondents to select job
Barriers in Higher education:
Barriers still discourage girls from enrolling into physical and natural science and applied science courses, e.g., engineering. The obstacles include cultural influence, stereotyping gender-role at home and at school, absence of women role models, misperception about non-traditional occupations, erosion of self-esteem amongst girls in their teens, particularly in poor families and non-urban areas, under-representation of women issues in text books, and myths based on a masculine view of excellence (Bangladesh Education Sector Overview, 2002).
Barriers in higher education:
This portion is included with some Barriers that the female students of Jahangirnagar and D.U face. In the part of theoretical and conceptual framework some barriers of higher education have been incorporated. With keeping mind the portion some specific options was included in the questionnaire. On the basis of those responses the following findings have shown.
Table : Barriers in higher education
| Options | J.U | D.U | Total | |||
No. | % | No. | % | No. | % | |
Yes | 6 | 10.71 | 32 | 27.12 | 38 | 21.84 |
No | 50 | 89.29 | 86 | 72.88 | 136 | 78.16 |
Total | 56 | 100.00 | 118 | 100.00 | 174 | 100.00 |
The above table is the percentage of the respondents of Jahangirnagar and D.U has some barriers in the higher education or not. In top of the table two Universities shown. In the left of the table the responses of the respondents have been incorporated. In this table it is clear that the percentage of barriers in higher education is high in the D.U that is 27.12%. In J.U the percentage is 10.71%.
- Chi test value between the two variable educational institution and the barriers in higher education is 0.01441. So, we can conclude there is close relationship that the difference of educational institution makes difference in the barriers of higher education
Some specific barriers in higher education
The above result shows that student of the D.U face more barriers then the students of J.U. There are five options for selecting barriers in higher education. The following table shows the specific barriers faced by the respondents of Dhaka and J.U comparatively. Barriers in education are matter of concern in this study because it is an empowering environment to help a person to be empowered that the author has represented in the theoretical part of this research. Among 174 students of the present research 32 respondents from D.U and 6 students from J.U have said that they face barriers in higher education for this reason the total of the respondents in this portion is 38 and percentages are calculated in the part of total from this.
Table : Percentage of most prominent barrier in higher education
| Options | D.U | J.U | Total | |||
No. | % | No. | % | No. | % | |
| Problems of seats in hall | 11 | 34.38 | 1 | 16.67 | 12 | 31.58 |
| Lack of family support | 7 | 21.88 | 1 | 16.67 | 8 | 21.05 |
| For family responsibility | 6 | 18.75 | 2 | 33.33 | 8 | 21.05 |
| Lack of cooperation of teachers | 3 | 9.38 | 1 | 16.67 | 4 | 10.53 |
| Family pressure for marriage | 3 | 9.38 | 0 | 0 | 3 | 7.89 |
| Others | 2 | 6.25 | 1 | 0.00 | 3 | 7.89 |
| Total | 32 | 100 | 6 | 100 | 38 | 100 |
Table 4.31 has presented the most important barriers in higher education that they face more. In the table two variables have been presented those are Barriers and Universities. In the D.U the most preferred option of problem is problems of seats in hall. The percentage is 34.38%. On the other hand in the option of seat problem in J.U. is 16.67%. In the D.U students cannot get seats before second year. Without any political affiliation sometimes it is very hard to get a seat in hall. Several occurrences happen regarding the hall seat issues in the D.U.
The highest percentages of problem have been shown in the option of for family responsibility is 33.33%. Seven students of D.U have said about the problem lack of family support. On the other hand 1 student from J.U said about the lack of family support.
- Eve teasing
Eve teasing is a buzz word in the modern society. It is a mental disease of some person to make someone mentally ill. In this perspective a student of D.U. from the department of marketing has provided her opinion that for this reason her higher education has hampered for two years.
- Problems created in house for the failure to get admission in Universities
Tuli, 1st year department of History, D.U, has informed that in the admission test exam he has failed several times to get chance her parents said they will give marriage to her and she has no need to educate more. But she has said that at present there is no problem like this.
- Problems to get seats in hall
The respondents of the D.U have said about this problem. For this problem they cannot get the proper facilities for learning. In a room there are 150 students in a hall of D.U. Not only that the environment and condition of the room is very poor. For getting a seat in hall sometimes political involvement is very necessary for them.
- Adjustment problems
Tamima Tanvin, a student of Department of Bangla in the D.U has said about environment of the university as the barrier of higher education. She has faced problems in the adjustment with the other students of the D.U.
- Education system:
Trishna, 1st year student from Department of Anthropology, J.U. has informed that present education system seems a barrier to her. She cannot explore her knowledge in this education system.
After the analysis of the findings the result point a direction to the decision that there are huge problems in higher education but the most prominent one is problems of seats in hall. If this problem is possible to remove then it is also possible for the minimization of other relevant problems.
Table : Chi test value of gender discrimination and Universities
Gender discrimination in University:
In the empowering environment of the Universities the gender discrimination is a negative thing. And in this part a table will be presented below about percentage of gender discrimination in the University. Because whatever the family background it is the present environment is a prominent thing in the matter of the empowerment of the female students.
Table: Percentage of gender discrimination in the University
Options | J.U | D.U | Total | |||
No. | % | No. | % | No. | % | |
| Yes | 22 | 39.29 | 17 | 14.41 | 39 | 22.41 |
| No | 34 | 60.71 | 101 | 85.59 | 135 | 77.59 |
| Total | 56 | 100 | 118 | 100 | 174 | 100 |
Table 4.33 reveals that percentage of gender discrimination in J.U. is 39.29% and in the D.U. the percentage is 14.41%. This percentage shows that in J.U. there is gender discrimination then D.U.
Statistical functions | Results |
| Chi test | The chi test value between the Universities and gender discrimination is 0.000236. So, there is relation between these variables and the change of the University change the events of gender discrimination |
Table : Statistical function and value
Statistical functions | Results |
| Chi test | The chi test value between the Universities and gender discrimination is 0.000236. So, there is relation between these variables and the change of the University change the events of gender discrimination |
In the table 4.34 the percentages of barriers in higher education is Problems of seats in the halls. But in case of gender discrimination the percentage is higher among the respondents of J.U. The type of gender discrimination in J.U. is quota system in the admission test.
The question no. 9 incorporates an option about the type of gender discrimination in Universities. There are Varieties in the difference of the discrimination. Types of gender discrimination in J.U are:
- The quota system in the admission test of the J.U.
- The number of female halls in comparison of male halls
- The mobility of female students and restriction to go out of hall in night
- Negligence of male classmates in important activities of department
The finding reveals that in the D.U types of gender discrimination includes lack of cooperation of teachers, discrimination on the basis of dress up (to wear veil by female students), Male classmates discriminate female students, Discrimination of teachers and they think that female students are not eligible to work, eve teasing. Some cases regarding gender discrimination has been incorporated in the subsequent box.
Box : Case studies of gender discrimination
After considering above findings it is clear that in terms of percentage gender discrimination is high in J.U than D.U. But the highest numbers of reasons are about the quota system of J.U. I have found that in D.U events of gender Discrimination are more sensitive and have huge impact over students.