The main objective of this report is to analysis Economic Growth and External Sector Behavior. General objectives of this reports are to study the trend of GDP growth from the year 1975-2005 and four external factors remittance, export, import and foreign aid, develop a regression model to show the relationship among these factors and GDP growth and show the level of impact of these factors on GDP, detailed study of each of the factors and show how it is affecting the GDP growth and compared the developed model with three other SAARC countries (India, Srilanka and Pakistan).
Objectives of the report
- Study the trend of GDP growth from the year 1975-2005 and four external factors remittance, export, import and foreign aid.
- Develop a regression model to show the relationship among these factors and GDP growth and show the level of impact of these factors on GDP
- Detailed study of each of the factors and show how it is affecting the GDP growth.
- Compared the developed model with three other SAARC countries (India, Srilanka and Pakistan)
Economic Growth: Bangladesh
Gross domestic product is an accepted parameter to measure the performance of an economy. As mentioned earlier in this report we will define economic growth as real GDP growth. Since its independence in 1971, the economy of Bangladesh has experienced significant strides. However, the country’s development was hindered by years of political instability and devastating natural disasters. The graph below shows the trend of Real GDP for the country for the period 1971-2005. In the computation of Real GDP the year 2000 has been taken as the base year.
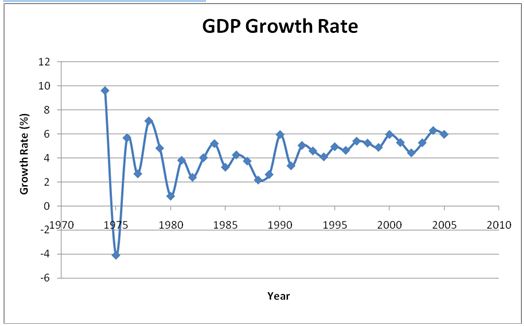
As can be seen, there were wide fluctuations in the growth rate of Real GDP over the period. This indicates that the country failed to sustain a suitable growth rate. Bangladesh have experienced negative GDP growth in the year 1975. This was mainly due to the historic 1974 famine. In 1976 it rose again. For the next decade, the value fluctuated. The country was able to maintain a growth rate of around 5% after this period. The fluctuations in the growth rate over the period are partially due to inadequate infrastructure of the economy, weak governance, and low exports. The highest growth rate attained at the end of the period benefited from strong garment exports, large remittance inflows and impressive macro stability.
The structure of the economy has also changed vastly over the last three decades. Long before and after the independence, agriculture accounted for a large proportion of the GDP. But over the years its contribution declined by more than 20%, while the manufacturing sector prospered, boosting the country’s export earnings.
The external sector, mainly export, import, foreign aid and remittance, have always played an important role in the economy. However, there were wide fluctuations on the contribution from each of these sectors through out the period. In the 1970s, the country experienced a high balance of trade deficit mainly due to domestic shocks of natural disasters and international shocks of oil and food price hikes. Hence, over the decade the country had to rely heavily on foreign aid. In the 1980s, although policy reforms took place to enhance export revenues, the country was still suffering from external dependence. 1990s was a decade of policy reforms to reduce trade dependence and achieve trade orientation. Participation of the workers in the global labor market increased remittances and lower tariffs enabled the country to increase export revenues.
Role of External Factors in Bangladesh Economy
External factors such as export, import, foreign aid and remittance have always played crucial role in Bangladesh economy. However, impact of these factors has not been consistent. If we analyze the contribution of each factor as a % of GDP over tie we will get a vivid picture.
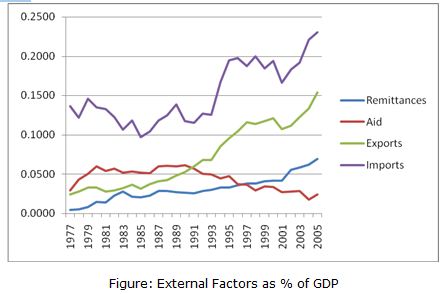
As we can see from the graph our economy was initially influenced more by imports and foreign aid compared to exports and remittance. During 1977-1985 exports comprised only of 2-5% of total GDP and remittance was 0.5-2% of the GDP. Aid as percentage of GDP was higher than both exports and remittance till 1990. Export and remittance sector have been growing significantly over the years.
In the 1980s Bangladesh economy experienced e shift from import trade policies towards export oriented policies. During this decade RMG and knit ware exports started to dominate the export sector and earned a lot of foreign currencies.
In the 1990s economic reforms gained momentum and successive governments opted for export led policies. A major boost in export was accommodated by the insurgence of RMG sector. In 1990 RMG and knit ware goods exports made up over 65% of the total exports which was 84.95% in the year 1999. During this decade Bangladesh enjoyed a reduced tariff rates by some developing country to export its commodities. Volume of FDI increased during this period and remittance became a prominent sector in the economy. Thus 1990 was a decade of transition from aid dependence to trade orientation.
As we can see from 2000 remittance overtook aid as percentage of the total GDP. Export and remittance continued to rise during this decade. In 2005 remittance was 7% of the total GDP which has been the highest in the economy. Import of goods was mainly influenced by import of petroleum products due to rise in manufacturing industry. Impact of foreign aid on the economy has been declining 2000 onwards.
Changing Features of the External Factor
Remittance
Contribution to the economy
Bangladesh is considered as one of the major labor exporting country of the world. Since independence over 4 million Bangladeshis went abroad. The cumulative receipts of remittances from Bangladeshi migrants during 1976-2003 stood at around US$22.0 billion5. In 2003, through the official channels Bangladesh received 3 billion US dollars and it is estimated that another 3 billion US dollars came in through the informal channels. Bangladesh accounted for 12% of all remittances coming into South Asia and 2% of the overall global remittances. According to Ministry of Expatriates Welfare and Overseas Employment, despite a sharp decline in manpower export, the country’s remittance earning increased by 27 percent in the year 2005 than the previous year with the total remittance crossing US $ 4 billion mark for the first time. In 2004, the earning was US $ 3.5 billion while 0.25 million Bangladeshis went abroad for job purposes this year against 0.27million last year. Careful analyses of the available household survey data indicate that remittances have been associated with declines in the poverty headcount ratio in several low income countries and in Bangladesh remittances play a significant role to decline poverty by 6 percent. In the year 2000, remittances contribute 4% in total GDP in Bangladesh. Among the top 20 remittance-recipient countries, the position of Bangladesh was fourteenth and amount was US$3.4 billion in 2004(Global Economic Prospect 2006). In Bangladesh, remittance hits a record US $653 million growth in March 2006, which is 23 percent higher in the first three-quarters of current financial year than the previous year (The Daily Star, April 06, 2006).
It is very evident from the data of remittances as percentage of GDP that remittance sector has had profound impact on the economy of Bangladesh. As we can see from the graph above that remittance inflow has been growing as percentage of the total GDP over he years. Initially GDP growth mostly was influenced by the foreign aid. It is very understandable that after independence aid had the major impact in restructuring the economy. Gradually it shifted to remittance and exports. In 1977 remittance made up only 0.45% of the GDP. But it has been growing gradually and in the 2005 it was 7% of the total GDP. Therefore remittance has played significant role in Bangladesh economy and has the potential to become the most crucial factor in the economy. Another important factor to notice is the remittance as % of foreign aid. In 1977 remittance was only 15.47% of foreign aid. It has gradually increased and in the year 2004 remittance was almost 3.5 times the foreign aid.
Remittance from Different Countries: Who Contributes More?
Bangladesh is a huge labor surplus country. Hence it belongs to the supply side of the global labor market. Increasing rate of unemployment in Bangladesh leads to financial crises. As a scope to escape from poverty, to offer a better future to families and because there is low labor force in foreign countries, it leads Bangladeshi workers to migrate to more affluent countries that can provide them more opportunities in all aspects.
Bangladeshi workers migrate to the Middle East, Southeast Asia and Europe .Middle East being the major source of short-term employment to workers has been taken in consideration in the annual labor outflow of Bangladesh from. Detailed total remittance country wise has been provided in the appendix.
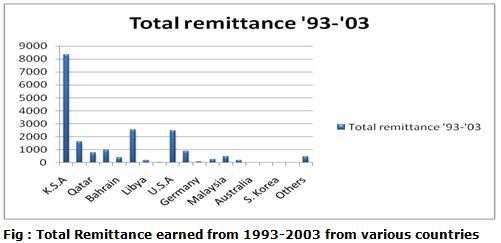
The preferred destinations are Saudi Arabia, UAE, Kuwait, Qatar, Iraq, Libya, Bahrain and Oman of which Kingdom of Saudi Arabia, alone accounts for nearly half of the total number of workers who migrated from Bangladesh during the period 1976-99 and becomes the largest employer of Bangladeshi migrant workers. From 1976 to February 1999 altogether 2,679,171 people have migrated from Bangladesh on overseas employment. Of this figure 1,126,539 have gone to Saudi Arabia during this period. Among the five countries taken in consideration Bahrain has the least number of Bangladeshi migrants. The number of Bangladeshi workers migrating to Iraq, Iran, Libya, Jordan is negligible.
No. of Migrants and Skill composition vs Remittance
However, if we consider the number of migrants working and compare it with the remittance received, the growth in remittance inflow is not as steady as it seems to be. The graph below sheds light on this issue.
| Year | No of Migrants | Increase/ Decrease % | Remittance (Million US$) | Increase/ Decrease % |
| 1976 | 6,087 | 23.71 | ||
| 1977 | 15,725 | 158.33 | 82.79 | 249.18 |
| 1978 | 22,809 | 45.04 | 106.9 | 29.12 |
| 1979 | 24,495 | 7.39 | 172.06 | 60.95 |
| 1980 | 30,073 | 22.77 | 301.33 | 75.13 |
| 1981 | 55,787 | 85.51 | 304.88 | 1.18 |
| 1982 | 62,762 | 12.5 | 490.77 | 60.97 |
| 1983 | 59,220 | 5.64 | 627.51 | 27.86 |
| 1984 | 56,714 | -4.23 | 500 | 20.32 |
| 1985 | 77,694 | 36.99 | 500 | 0 |
| 1986 | 68,658 | -11.63 | 576.2 | 15.24 |
| 1987 | 74,017 | 7.8 | 747.6 | 29.74 |
| 1988 | 68,121 | -7.97 | 763.9 | 2.18 |
| 1989 | 101,724 | 49.33 | 757.84 | -0.79 |
| 1990 | 103,814 | 2.05 | 781.54 | 3.12 |
| 1991 | 147,131 | 41.72 | 769.3 | -1.56 |
| 1992 | 188,124 | 27.86 | 901.97 | 17.24 |
| 1993 | 244,508 | 29.97 | 1,009.09 | 11.87 |
| 1994 | 186,326 | -23.79 | 1,153.54 | 14.31 |
| 1995 | 187,543 | 0.65 | 1,201.52 | 4.16 |
| 1996 | 211,714 | 12.89 | 1,355.34 | 12.79 |
| 1997 | 231,077 | 9.14 | 1,525.03 | 12.52 |
| 1998 | 267,667 | 29.76 | 1,599.24 | 4.86 |
| 1999 | 268,182 | 0.19 | 1,806.63 | 12.96 |
| 2000 | 222,686 | -16.96 | 1,954.95 | 8.21 |
| 2001 | 188,965 | -15.14 | 2,071.03 | 5.94 |
| 2002 | 225,256 | 19.2 | 2,847.79 | 37.5 |
| Total | 2,909,972 | 18058.74 |
Table: Percentage increase/decrease in number of migrants and remittance
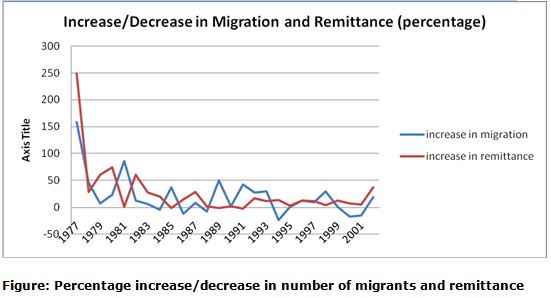
The graph compares the percentage increase/decrease in number of migrants and amount of remittance received. It can be seen that before 1990s, change in migration had significant impact on the change in remittance of the subsequent year. However, after 90s, substantial increase in migrants (1996-1998) was not followed by similar increase in remittance in the succeeding years.
Probably the reason behind this reduction in remittance growth is the increased participation of unskilled and semi-skilled migrants and less migration from Skilled and professionals in the 90s. This scenario is discussed in the following section.
Skill Composition of Migrant Workers
BMET has classified short-term migrants to Middle East and South East Asia into four categories: professional, skilled, semi-skilled, and unskilled. Doctors, teachers and nurses are considered as professional workers. Manufacturing or garment workers, drivers, computer operators and Electricians are considered as skilled, while tailors and masons as semiskilled. Housemaids, agri-labourer, hotel boy and menial laborers, i.e., cleaners, cart loader, carton pickers are considered as unskilled workers. (Detailed data for skill composition of labor has been provided in the appendix)
In order to determine which portion f workers has stronger relationship to the remittance contribution we have done a correlation analysis. The results are as followed
| Professional | Skilled | semiskilled | unskilled | |
| Pearson Coefficient | 0.239 | 0.809 | 0.542 | 0.774 |
As we can see from the findings that skilled labor has stronger relationship with total remittance inflow compared to other labor.
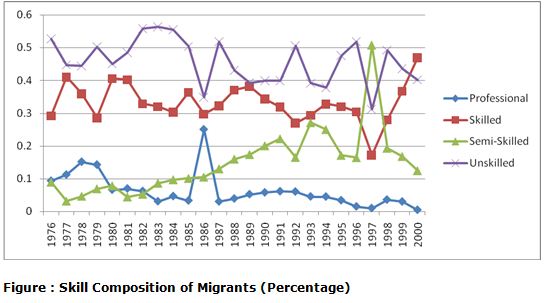
The graph states that unskilled labor constitutes the highest percentage of the migrated labor force. Since labor force is low in these countries, the unskilled labors that migrate from Bangladesh have a higher probability of getting a job.
The migration of professional workforce i.e., doctors can be attributed to both external ‘pull’ and internal ‘push’. The external ‘pull’ comes from globalization, free market economy, opportunities for professional training, higher salaries, perks and better living condition. Whiles surplus production of health personnel, resultant unemployment, less attractive salary, stagnation or underemployment coupled with lack of infrastructure act as “push” factors for the workers to migrate. The advanced countries are facing acute shortage of nursing staff owing to ageing population, shortage of nursing schools, and competing professions becoming more lucrative in terms of salaries, perks and status. This explains the parallel trend of Bangladeshi professional workforce migrating abroad.
Macroeconomic Benefit at Household Level
The remittance has significant macroeconomic impact at household level. The macroeconomic impact of remittances at household level partially depends on the characteristics of the migrants and hence the recipients i.e. whether they constitute the rural poor, or the more educated sectors of the population generally residing in urban areas. The majority of Bangladeshi migrants abroad is unskilled, and originates from rural areas (de Bruyn 2005). Unskilled workers take jobs in Saudi Arabia, the United Arab Emirates, Malaysia, and to a lesser extent US and UK as domestic staff and labourers. Saudi Arabia alone accounts for around 43% of migrants out of Bangladesh. According to official statistics, from 1976 to 2004, 46% of migrants were unskilled, lacked access to land and resources. The poverty profile of migrants is looked at more closely in the social appraisal. However the evidence clearly shows that most short-term migrants abroad are poor and from rural areas. The poorer the household, the more impact or benefits remittance income can have on alleviating poverty. In the short-term remittances help loosen the budget constraints of their recipients, allowing them to increase expenditures on both durables and non-durables products, and provides them with protection against negative income shocks. Remittances are cited as making up around 60% to 70% of recipient poor households’ total income (Bruyn 2005). Investment in health and education is valuable for long-term economic growth and poverty reduction. Studies conclusively found that migrant families invested more in these areas (Murshid et al 2002). The most comprehensive review of the literature on remittances in Bangladesh (Bruyn 2005) lays out a number of benefits that are listed in the table below
| Nutrition | Allow families of migrants to meet basic nutritional needs |
| Living condition and Housing | Living condition and housing improved |
| Education | Invest for education of children |
| Healthcare | Increased investment for healthcare |
| Social security | Social security for elderly people increased |
| Investment | Increased investment in business or income generating activities |
It is found from a study that during migration the total income of migrant households increased by 119 percent. It is also found that on an average each migrant remitted 55.65 percent of his income. Again remittance constituted 51.12 percent of the total income of these households. It is found from different survey that a higher portion of remittance is used for consumption. Another significant portion of remittance is used for purchase of land and home construction. It may be mentioned here that while going abroad a migrant worker usually manages the fund for his migration either by selling land or mortgaging land. So to retrieve the sold or mortgaged land and also purchase additional land remittance plays an important role. Moreover, some portion of remittance is used for food, clothing, health care and children’s education. A very small portion of remittance is used by the recipients for investment in business or other ventures and savings.
Government and Private Sectors Initiatives for Transferring Remittance
Bangladesh Bank continues its efforts to encourage Non-Resident Bangladeshis (NRBs) to send their money through official channels. Remittance has become a good source of income for some of the banks with strong network abroad. Earlier the Nationalized Commercial Banks (NCBs) were the main official channels to transfer remittance. The NCBs have some overseas branches in United States, Europe and Middle East. Moreover, NCBs have agreement with the foreign banks in many countries for smooth transferring of remittance. But the process of transferring remittance through NCBs is lengthy and takes some days. So, now a day the private commercial banks (PCBs) have become more aggressive in remittance business providing quick and reliable services and attracting the Bangladeshi wage earners to send money home through banking channel. Although the flow of transferring remittance in Bangladesh through official channels is increasing, but according to World Bank staff estimates based on household survey, the informal sources of remittance channel is still higher. The ‘formal’ system means the transferring through banking system and the ‘informal’ system can be through hundi system, friends and relatives, hand carried etc. Hundi is an ancient and informal method of funds transfer and part of Bangladeshi culture. Other countries have different names for the same system – Hawala in parts of India and the Middle East, Fei’chen in China, Padala in the Philippines. This informal system is based on trust and is underpinned by a loose network of traders (shop owners, money changers etc.) who settle transfers amongst themselves, using their existing trading relationships. For the remitter, the hundi system has the advantage of being inexpensive, fast and accessible. Its two significant drawbacks are that it is illegal, and is based purely on trust and is therefore theoretically a high-risk proposition. The following table shows that roughly half of remittances to Bangladesh are estimated to be generated through the formal banking system based on 2002 data.
| Formal Channels | 46% |
| Hundi | 40% |
| Friends and Relatives | 5% |
| Hand carried | 8% |
| Other | 1% |
To attract Bangladeshi wage earners by providing quick and reliable services three PCBs i.e.
National Bank Ltd., Arab Bangladesh Bank Ltd. and BRAC Bank Ltd. have made an agreement with Western Union, an US-based organization for financial services which has been covering more than 200 countries with its network. The number of branches of each bank which is transferring remittance through Western Union as following table:
| Name of Banks | Number of Centers |
| National Bank Ltd. | 76 |
| Arab Bangladesh Bank Ltd. | 34 |
| BRAC Bank Ltd. | 450 |
| Total | 560 |
| Source: Daily Ittefaq, Dated 16 April, 2006 | |
Table: Name of Banks and number of centers transferring remittance through Western Union
Government initiatives to Encourage Remittance Flow and Utilize for Economic Development
The Bangladesh Government has established the Ministry of Expatriates’ Welfare and Overseas Employment on December 20, 2001 to ensure welfare of the expatriate workers and increase of the overseas employment. The Ministry has been rendering ceaseless efforts in enhancing the flow of remittance and to provide equal opportunity for the people of all areas of the country for overseas employment and ensuring overall welfare of the migrant workers. Bureau of Manpower, Employment and Training (BMET) was established in the year 1976 by the Government of the People’s Republic of Bangladesh as an attached department of the then Ministry of Manpower Development and Social Welfare with specific purpose of meeting the manpower requirement of the country and for export of manpower as well. BMET is engaged for over all planning and implementation of the strategies for proper utilization of manpower of the country. With the support of government Bangladesh Association of International Recruiting Agencies(BAIRA) is an association of national level with its international reputation of co-operation and welfare of the migrant workforce as well as its approximately 700 member agencies in collaboration was established in 1984 with a view to explore job opportunities for skilled, semiskilled, and unskilled personnel, to facilitate the migration process of workers and provide necessary information to them, to advise the government for revising foreign policy according to the current discourse of manpower export.
Government has also undertaken different savings and investment facilities for non-resident Bangladeshis. Moreover, tax holiday and tax exemptions are also provided to encourage remittance flow and utilize it for economic development.
Savings Facilities for Non-Resident Bangladeshis
The Government is offering different savings instruments for the non-resident Bangladeshi to attract remittance that will boost the local economy. The Government is offering following savings instruments.
Non-Resident Foreign Currency Deposit (NFCD)
This deposit account can be opened any bank operating in Bangladesh. The account can be opened for one month, three months, six months or one year term in foreign currency i.e. US Dollar, Pound Starling, Euro etc. The minimum deposit requirement is US $1000 or 500 pound starling or equivalent to other currency.
US Dollar Premium Bond
The Bond is issued for three years in the name of a holder of a non-resident account against remittances from abroad to the account. The Bondholder will be entitled to draw interest on half yearly basis at 7.5% fixed rate per annum in Bangladesh currency at the USD/BDT rate. However, the Bondholder may surrender the Bond before maturity and en cash the same at the paying office in which case lower interest will be paid. The Bond will be issued in the denominations of US$500, $1000, $5000, $10,000 and $50,000 and in such other denominations as the Government may decide. The purchaser can purchase Bond of any amount in multiples of US $500 without a maximum limit. For investment of US $10,000 and above, subject to an initial investment of US$10,000 in one instance, the concerned purchaser will be provided with death-risk benefit. The death-risk-benefit will be determined according to the different slabs of investment and the age of the purchaser shall not be over 55 years at the time of his death.
Income Tax Facilities for Non-Resident Bangladeshis
The National Board of Revenue (NBR) of Bangladesh Government has undertaken various initiatives in the income tax rules for Non-Resident Bangladeshis to increase the flow of remittances. The Government has taken following steps to provide income tax rebate to nonresident
Bangladeshis:
- The amount of remittance transferred by non-resident Bangladeshis through banking channel enjoys full exemption from income tax (Finance Law, 2002).
- No Tax Identification Number (TIN) Certificate is required upon purchase of fixed assets by non-resident Bangladeshis (Finance Law, 2002).
- The interest income of non-resident Bangladeshis from ‘non-resident foreign currency deposit account’ is fully exempted from tax.
- The ‘Wage Earners Development Bond’ purchased by non-resident Bangladeshis is exempted from income tax.
- The non-resident Bangladeshis and foreign passport holders Bangladeshis and their family members don’t require income tax clearance before leaving country after visiting Bangladesh.
Investment Facilities for Non-Resident Bangladeshis (NRBs)
The government is providing tax holiday and tax exemption as well as various investment incentives for non-resident Bangladeshis.
Tax holiday and exemption
Tax holiday facilities will be available for 5 or 7 years depending on the location of the industrial
Enterprise.
Tax exemptions are allowed in the following cases:
- Tax exemption on royalties, technical know-how fees received by any foreign collaborator, firm, company and expert.
- Exemption of income tax up to 3 years for foreign technicians employed in industries specified in the relevant schedule of the income tax ordinance.
- Tax exemption on income of the private sector power generation company for 15 years from the date of commercial production.
- Tax exemption on capital gains from the transfer of shares of public limited companies listed with a stock exchange.
Export Sector
Export sector has been the major driving force of our economy. Initially this sector ws not as significant as it is now. Due to insurgence in RMG and other manufacturing industries it is the main driving force of our economy. In this section we will look into the details of export scenario and how it has been affecting our economy.
The total exports can be devided into two broad categories –
- Primary Commodities
- Manufactured goods
The percentage of manufactured good exports was always greater than that of the primary commodities export. The primary commodities export has declined over the time span and the manufactured goods export has increased in percentage.
The following regression analysis shows which export goods have the maximum impact on total exports.
| Dependent Variable | Total Export | |||||
| Independent Variable | Frozen Food, Raw Jute, Tea, Jute Goods, RMG and Knit wares | |||||
| Coefficient | Frozen Food | Raw Jute | Tea | Jute Goods | RMG and Knit wares | |
| 1.109 | 1.961 | 0.554 | 1.361 | 1.039 | ||
| Adjusted R² | 1.00 | |||||
From this model we can see that apart from tea the value of all other independent variables is more than 1. The high value of the variables indicates highest impact on total export. Here we can see that the impact of raw jute is highest. The high amount of exports of raw jute in the 1970s caused greater value of of the coefficient, but the export of raw jute has significantly fallen in the recent years. The same thing goes for jute goods. The frozen food exports had higher values in the 1980s which gave a higher value to its coefficient. Though the value of RMG and knit wears is comparatively lower than the other variables it has a higher impact on total export because there was no export in this sector before the 1980s. the exports after 1980s only gave such high value to its coefficient. Keeping all the factors in mind we can say that the RMG and knitwear have the highest impact in total export.
The Overview of export according to category
Primary Commodities
Primary Commodities: there are three basic primary commodities that are exported from Bangladesh – Frozen Food, Raw Jute and Tea. There are some other primary commodities which capture very low percentage of the total exports, such as agricultural products etc.
Frozen Food
Frozen food had a highly satisfactory trend growth rate of 16.11 percent for the whole period. But its growth rate has fluctuated highly over the period. Its percentage of total export hit the highest by consisting 14.98% of the total export in the year 1985. But after that point there was a sharp decline during 1985to 19991. Though the export figures seemed to recover in the following few years, it declined once again in 1996. The drop in the growth rate in the later period may be attributed to a fall in demand in the EU markets in the late 1980s and early 1990s. the supply constrains can be another reason for the declining growth of frozen foods in the later period.
Raw Jute
During the early 1970s upto 1985, raw jute earned the greatest sum of export revenue from the primary commodities sector. The export of raw jute was remarkably high during the 1970s; it started to decline from the late 1970s. The reasons for the decline were the growth of jute manufacturing industry in the country and falling demand for raw jute in developed countries due to extensive use of synthetic fibers. After 1985 the the exports dropped drastically and at present it is hardly exported.
Tea
The export growth of tea was comparatively lower compared to the other two primary commodities. From 1972 to 1982 the growth rate highly fluctuated; the growth was highest in the year 1973. But after 1982 the export of tea has faced a sharp decline. Though Bangladesh successfully recovered the loss of tea export earnings caused by the dislocation during the country’s war of Independence, it lost the momentum in its competition with India and Sri Lanka in the late 1980s and early 1990s. It is almost nil in the recent years.
Manufactured Goods
There are four main in the manufactured goods sector – Jute goods, Readymade garments, Knit wears and leather. There are also other products that are exported as manufactured goods, but they hold a very minor share in the total exports. Some of these products are – Naphtha, Furnace oil & bitumen, Hosiery Products, Paper products, Chemical & Pharmaceutical Products, Engineering Products, Agricultural Products, Handicrafts etc.
Readymade Garments
The readymade garments were not exported in the 1970s, the export of RMG started in 1980. After that, readymade garments exports grew at a steady rate up to 1984. After 1984, the export in this sector has grown at a very rapid rate. But after the year 2000, the exports of readymade garments have declined due to policy changes in the worldwide export.
Knitwear
Knitwear products newly entered the export market in 1989 and since then its export grew very rapidly – at a much faster rate than other readymade garments. It reached the highest in the year 2005 with 40.4% of the total exports.
The very fast growth of the readymade garments and knit wears in the export arena are the main reason behind the exports and economic growth in Bangladesh. Though Bangladesh faced setbacks in exporting jute and jute goods, the exports of the RMG product group has more than made up for the loss.
Jute goods
The status of jute goods export was very high dirung the 1970s but it started to decline in the beginning years of 1980s. It had a statistically significant low annual trend growth rate of during the early period and it had no significant growth rate after the year 1994, in the year 2005 it acquired only 3.8% of the whole exports.
Leather
The exports of leather and leather products was considerably low in the early 1970s, but there was a sharp increase in the year 1983. Though the composition of export percentage of leather has fluctuated slightly, the growth rate was high up to 1990. After that there was continuous decline in the next years. In the year 2005, the export percentage of leather goods were almost 5 percent of total export.
Overall Changes in Composition of Exports and Imports
The highly disparate growth patterns of individual export product groups have inevitably led to large changes in the export composition over time. Exports of jute, jute goods, tea and leather, constituted most of Bangladesh’s total exports in the early years. These exports precipitously fell drastically in the recent years. At present the dominance of raw jute and jute goods in the export trade of Bangladesh has weakened considerably, and the RMG product group has boomed substantially in the recent years. The share of raw jute in export earnings has fallen from 38% in the year 1972 to to 1.5 in the year 2005. Over the same period, the share of jute goods declined from 52 percent to less than 4 percent. Another main exports item, tea, declined from 6.3% to 0.12%t during the period. Tea’s relative export share did increase in some of the years in the 1980s but it declined sharply in later years. The share of leather in total exports showed a significant increase from about 1% in 1972 to more than 16 percent in the late 1980s. But it declined to 2.7 percent in the year 2005.
On the other hand, exports in readymade garments and knit wears dramatically grew over the years. The composition of readymade garments increased from 0.1 percent in 1980 to 43.2 percent in the year 2005. Knit wears export increased from 1% in the year 1989 to 40% in the year 2005. The very fast growth of the readymade garments and knit wears in the export arena are the main reason behind the exports and economic growth in Bangladesh. Though Bangladesh faced setbacks in exporting jute and jute goods, the exports of the RMG product group has more than made up for the loss. The share of frozen food increased from less than 1 percent to 5 percent during the years. Frozen food’s share in total exports was higher in the 1980s but its later decline reflected a deceleration in its growth performance in recent years.
The export performance of Bangladesh over the years was moderately good. Though it has experienced steady growth over last 35 years but the growth rate has not been highly remarkable. The above trends indicate that Bangladesh’s export performance over the last three decades was good. The government has repeatedly emphasized on the export-led growth and the introduction of several export promotion measures, but this measures was not very fruitful. Exports of traditional items are demand determined, while some of the non-traditional exports are supply constrained.
Export Incentives opt by the government
The government has provided various incentives to expand the narrow export base and to make the products more competitive. The governments have introduced several export promotion measures and replaced or modified previous measures. The following measures were taken to ensure a competitive edge for export products: (a) special or supervised bonded warehouse facilities; (b) duty drawback facilities; (c) a cash compensation benefit in lieu of duty drawback on raw materials; (d) duty exemption on capital goods applied to recognized (100%) export-oriented industries and income tax concession; (f) credit support from an export development fund; (g) export credit guarantee scheme; (h) foreign exchange retention benefit for exporters; and (i) development of export processing zone (EPZ) facilities.
(a) Special or Supervised Bonded Warehouse Facilities
There are two kinds of bonded warehouses – Special and supervised. Supervised bonded warehouse system is preferred by the custom authorities. The supervised bonded warehouse system is availed by the garments sector, it has boomed in the recent years. The exporters of other products are not comfortable with supervised bonded warehouse system due to various problems; very few industries such as leather goods, computer industry etc. use this system. As such they face high resistance from the custom authorities. As such the bonded warehouse system is unable to play a major role in the expansion of the export base.
(b) Duty Drawback System
There are two variants of duty drawback system – a) drawback at actual rate b) drawback at flat rate. The drawback at actual rates have various difficulties and is not preferred by the exporters generally. The flat rate variant is more preferred by the producers as it is easier and quicker to avail. The government has expanded the coverage of exported products under this system.
Even though the flat drawback system was better than the other system, it does not always benefit the exporters. These system involves higher delays than the officially set limit of a week or unofficial side payment. The government introduced a repayment system of drawbacks from banks on 13 items to quicken the process of duty demands.
(c) A Cash Compensation Benefit in Lieu of Duty Drawback on Raw Materials
The cash compensation in lieu of duty drawback system was first applied for the RMG sector in 1987 with a rate of 15% of final exports. Later it was revised with a rate of 25% in the year 1993. During 1989 this facility was provided to the frozen food, crust and finished leather industries. From the 1990s most of the exporters preferred to switched from duty drawback and bonded warehouse facilities to cash assistance system since it they receive more benefits from this system.
(d) Duty Exemption and Tax Concession
The government provided duty exemption on capital goods. For example handicrafts are fully exempted of tax and the tax on garments has been reduced from 0.5% to 0.25%. Before 1995 exporters were eligible for income tax rebates at varying rates up to 50 percent of the tax attributable to income from exports. After that they are entitled to a 50 percent deduction of the income from exports from the taxable income.
(e) Credit Support from an Export Development Fund
An export development fund of US $ 30 million was established in the early 1990s as a support to boost exports. IDA made a comtribution of US $ 25 million to this fund. This fund is used to lend financial support to the exporters. It provides credit support to an extent of 90% of the confirmed value and irrevocable letter-of-credit at a rate of 7 percent for selected non-traditional export items and at 12 percent for a few traditional export items.
(f) Export Credit Guarantee Scheme
Three types of export credit guarantee scheme is provided by the government against possible losses resulting from various risks. At present there are three kinds of guarantees –
- pre-shipment export finance guarantee
- post-shipment export finance guarantee
- comprehensive guarantee
the first two types are extended to the banks and the third one is directly provided to the exporters.
(g) Development of Export Processing Zone (EPZ) Facilities
The development of export processing zone (EPZ) facilities does have significant appeal to prospective investors, more especially to foreign investors. It has well-known special advantages for foreign investors.
(h) Foreign Exchange Retention Benefit for Exporters
The retention benefit of export earnings for general export has been increased from 25% to 40%. The low value added exports including garment exports get retention benefit of 7.5% from earlier 5%. Although the foreign exchange retentiomn benefit is is highly lucrative as an incentive it does not increase the rate of return on export activities.
These policies taken by the government was sometimes fruitful and sometimes it failed to enhance exports. Often the government has tried to deal with export problems of particular industries with special commodity-specific measures. It will not be an appropriate government policy to try to resolve the problems of such activities with special measures that are unlikely to make the activities concerned economically viable. It has to be prepared to both address the attendant risks, and take initiatives to access the emerging opportunities.
Import Sector
Ever since its independence in 1971, the economy of Bangladesh has been experiencing large trade deficits. Despite several export promotional efforts by the government, the export earnings of the country have fallen behind import payments.
A large portion of Bangladesh’s imports consists of consumer goods and materials for consumption that are not used for development purposes. In the 1970s and 1980s,these goods accounted for more than two third of the country’s imports. The share rose significantly mainly due to external trade liberation in the 1980s.The rest one third of the country’s import consist of capital goods and materials for capital goods, which are used for development purposes.
The graph below shows the trend of import payments compared to Real GDP for the period 1979-2005.
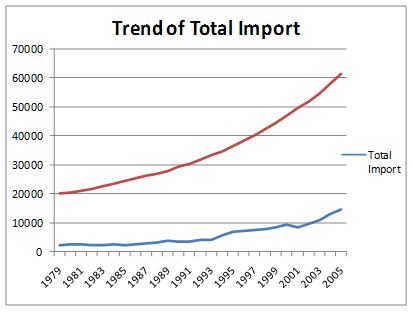
The graph shows an overall rising trend with slight fluctuations. The value reaches a maximum in the FY2005 (around 14000 million US Dollars). The overall increase in imports over the period has been about 380%. Payments for the FY2005 rose by about 20.5% compared to the previous year. Increased imports of rice, sugar, fertilizer and capital machinery contributed to this rise. Increased consumer and industrial needs increased the import of petroleum and petroleum products. High oil prices in the international market also boosted the growth.
8.3.1 Import sector composition
The main imports of Bangladesh include machinery and equipment, chemicals, iron and steel, textile, foodstuffs, petroleum products, and cement. The composition of imports can be divided into four broad categories as shown below.
| Primary Commodities | Intermediate goods | Capital Goods | Other Goods |
| Rice | Yarn | – | Sugar |
| Wheat | Petroleum Products | – | Oil seeds |
| Cotton and staple fiber | Edible Oil | – | Textiles |
| – | Fertilizer | – | Cement |
| – | – | – | Chemical Products |
During the 1970s, the sharp increase in oil prices resulted in high import payments for crude oil, petroleum and fertilizers. The Balance of Payments condition was also adversely affected due to the impact of a devastating flood, which caused the country to import large volumes of food grains for domestic consumption. Rising import prices and unstable exports earnings further fueled the rise in the deficit. Despite several export promoting measures taken by the government, the trade deficit persisted.
The deficit declined near the beginning of 1980s mainly due to import substitute policies adopted by the government. Devaluation of the Bangladesh currency also helped attain the figure. To correct the balance of payments imbalances, restrictive monetary and fiscal policies were also undertaken.
All these measure enabled the country to reduce the gap between exports and imports to about 4.19% of GDP in 1990. Throughout the decade, the trade deficit kept on declining. The country ensured this was sustained by implementing a financial sector reforms program.
Despite liberalization of import trade, the country was able to maintain improvements in current account deficit during the late 1990s mainly due to increase in export receipts, decline in deficits in services account, and increase in wage earner’s remittances.
Foreign Aid sector
Foreign aid is one of the most important parts of external sector. Bangladesh receives foreign aid in two forms – grants and loans. The grants are given withiut expecting anything in return and the loans are given at a certain payable interest rate.
From the following graph we can see the trend of the received foreign aid over the years –
From the graph we can see that the value of foreign aid is not following any particular trend, it has fluctuated highly over the years. Foreign aid had a rapid growth from 1971 to 1975. It had a very high value in the year 1975 but had a sharp decline in the following year. The complicated political situation and unrest at that period was the main reason behind this. After that the foreign aid amount eas increasing at a good rate upto the year 1980. The receipt of foreign aid highly fluctuated upto the year 1985. After that the foreign aid receipt increased considerably up to 1990, but we can see a declining trends as we move on afterwards up to the year 2002. After the sharp decline in the year 2002 the receipt of foreign aid has slightly recovered, but it faced a decline in the year 2005.
Food Aid:
The flow of aid in the food sector was highly fluctuating throughout the considered time period. In 1975 disbursement was a little higher than commitment but it declined sharply the next year, while after maintaining a relatively steady rate commitment had a sharp decline in 1978. After that both risen significantly in 1979 when disbursement was the highest and the amount of disbursement was more than US$350 million.
There was a very contradictory relationship between disbursement an commitment from 1982 to 1986; in 1982 commitment was lowest with a value of less than US$50 million, whereas disbursement maintained a moderately high value, on the other hand, in 1984 disbursement was lowest with a value of less than US$50 million having commitment at its top with a value of more than US$350.
From 1987 to 1997- during these 10 years both had maintained a similar trend. But in the earlier periods of this century, disbursement was around US$50 million while commitment was very low.
From the analysis we can see that disbursement and commitment both had more or less similar highest and lowest value, but at different time periods.
Project Aid:
Regarding the project sector a similar trend is seen in both disbursement and commitment- starting from a low value of US$500 milliion.in both cases, this was the lowest value and the trend went upwards after this.
There is continuous fluctuation in commitment with a moderately high value. Commitment was highest in 1998 with a value of US$2000 million. The fluctuation was relatively significant after 1987 to 2001, after a steady trend of a short period of 1985 to 1987.
The fluctuation in disbursement was very slow with a sudden fall in 2003 to less than US$1000 million from more than US$1000 million in 2002. It increased in 2004 with its highest value of almost US$1500 million in 2005.
From the graph it can be inferred that disbursement was almost always lower than commitment and the growth of commitment was faster than that of disbursement while fluctuation was much sharper in commitment.
Commodity Aid:
In the case of commodity, both disbursement and commitment had more or less same value in the starting and also in 2005-the last year of our consideration. Like the project sector, in commodity sector, fluctuation was much visible in commitment than in disbursement.
Disbursement had a moderately steady trend from 1978 to 1993 and after that there was a sudden drop in 1997 with a value of US$100 million. It sharply rose in 1998 but dropped again in 2003 having the lowest value of US$00 million. Disbursement was highest in 1988 with a value of more than US$500 million.
Fluctuation in commitment was very regular with high differences which were noticeably low in 1995 having the same lowest value as disbursement during the same time period. It had its highest value twice- in 1977 and in 1989 which was US$600 million.
From 1979 to 1994, disbursement had a steady situation while at that period commitment was highly fluctuating and within this time period, disbursement was lower than commitment when commitment had a high value due to fluctuation.
Change in Aid Disbursement: Loan and Grant
Loan and grant are the two types of foreign aids thatBangladesh recives. The development need of the country is financed through grant while loan is repaid after a certain period of time with interest.
In this case it is seen that starting with a vlaue of around US$500 million in 1976 loan dropped and from that very year grant started rising- both maintained a fluctuating trend over time. In 2004, there was a shap decline in both cases.
From 1978 to 1984, there is seen a steady scenario in loan after which it fluctuated upto 1991 and then there was another steady phase upto 2000. Loan was lowest in 1976 with a value of almost US$ 300 million and highest in 2004 with a value of more than US$1200 million.
Grant had the same lowest value as loan at the same time period whereas its highest value was a little more than US$800 million in 1994. Fluctuation was almost regular regarding grant.
From the analysis, it can be inferred that except for the period of 1978 to 1984, loan was always higher than grant. Though both increased over time, after 1994 grant showed a gradual decline whereas loan increased relatively sharply and was on rise upto 2005- the last year considered.
The Regression Model: SAARC Countries
Till now we have analyzed the impact of external factors on the economy of Bangladesh on the basis of the regression model that we have developed. How does this model relate to the other countries? In order to do so we have used the same model in case of some SAARC countries – India, Pakistan & Sri lanka.
India
India is the powerhouse in the SAARC community. It is one of the largest economies in the world. Analyzing the external factors and the GDP of India we have come with the following results.
| Coefficients | Remittance | Foreign Aid | Export | Import |
| -13.76 | 4.04 | 6.01 | 2.841 | |
| R | 0.996 | |||
| Adjusted R² | 0.990 | |||
So the equation stands, Y=77976.46-13.76*R+4.04*FA+6.01*X+2.841*I
As opposed to Bangladesh economy we see that there is a negative regression coefficient for Indian economy. The main reason can be that, remittance covers a very small portion of the huge Indian economy. So, the impact is not that significant compared to export, aid and imports. Export has been the most dominant external factor for India. Import also has a positive impact of the GDP growth. That shows that India has been very successful utilizing its import goods for the production and contribution to GDP.
The economy of India is the twelfth largest in the world, with a nominal GDP of 1.25 trillion. India is the second fastest growing major economy in the world of 9.4% for the fiscal year 2006-2007. India’s GDP segmentation are as follows. India’s economy is diverse, encompassing agriculture, textile, manufacturing and multitude of services.
Real GDP of India has been growing very consistently over the years. In the year 2005 the GDP stood $644 billions which increased by 9.23% from the year 2004. For such a huge economy this kind of growth shows strong productivity of the economy. From 1999-2001 tit was a dry spell for Indian economy. In 2001 GDP growth was only 3.21% which mainly due to the loss suffered from Gujarat earthquake. But from 2002 onwards annual GDP growth has been more than 8%. Goldman Sachs predicted that India’s GDP in current prices will overtake France and Italy by 2020, Germany, UK and Russia by 2025. By 2035, it is projected to be the third largest economy of the world, behind US and China.
It is evident from the graph below that export and import have been behaving oppositely. From the year 1976 to 1993 aid as percentage of GDP had been comparatively stable. But since then aid is on the decline. As a percentage aid has always been below 1.5% of the GDP. Although India is one of the largest remittance earning country compared as a percentage to the GDP is quite negligible. So, GDP growth of India has not been strongly influenced by the change in remittance. Trade balance is the most crucial factor for Indian economy. Although India has been “net import” all throughout the trade balance is decreasing constantly. From 1996 onwards export made up more than 10% of the GDP. Trade balance has been in the lower ends most of the times ranging between 1% to 3%
Pakistan
| Coefficients | Remittance | Foreign Aid | Export | Import |
| -2.26 | .129 | 6.013 | -1.11 | |
| R | 0.981 | |||
| Adjusted R² | 0.957 | |||
Y=23765-2.26*R+.129*FA+6.013*X-1.11*I
Pakistan economy is highly dependent upon export. Its impact is highest in relation with the increase in export and decrease in import. Export has been the most dominant factor for the GDP growth. Import also has a positive impact of the GDP growth. This shows that Pakistan’s economy is more dependent on export and foreign aids compared to import and remittance – which have little effect on remittance and import.
For the past 30 years, the remittance of Pakistanis living abroad has played an important role in Pakistan’s economy and foreign exchange reserves. Pakistan received $5.493 billion as workers’ remittances during the last fiscal year 2006. It is seen that workers’ remittances contribute 4% to the GDP of Pakistan and are equivalent to about 22 percent of annual exports of goods and services. However, the relationship of the Remittance to GDP growth is strongly negative stating that the economy is moving forward with the remittance decreasing over the years.
Pakistan’s exports stood at $17.011 billion in the recent financial year 2006-2007. Pakistan exports rice, furniture, tiles, textiles, clothing, leather goods, sports goods, surgical instruments, electrical appliances, software, carpets, livestock meat, chicken, powdered milk, seafood (especially shrimp/prawns), vegetables, processed food items, defense equipment (submarines, tanks, radars), engineering goods, and many other items. The exports in relation to GDP have been very impressive as the relationship have very strong correlation.
Pakistan’s imports stood at $30.54 billion in the financial year 2006-2007, up by 8.22 percent from last year’s imports. Pakistan’s single largest import category is petroleum and petroleum products alongside machinery, trucks, automobiles, computers, medicines, pharmaceutical products, food items, civilian aircraft, defense equipment, iron, steel, electronics, and other consumer items. The import is negatively correlated in relation to the GDP growth which is a positive factor since the country will be adding more to the GDP growth with declines in the import segment. It will also encourage Pakistani local producers to invest and in return, add to the GDP consequently.
From the multiple-regression model, for the past 30 years, export and import are seen to have the opposite effects as the growth of export is highly correlated to GDP growth and the less the import, the more contribution of GDP it has. It is one of the largest remittances earning country compared as a percentage to the GDP so the growth of the country has been strongly influenced by the change in remittance – as remittance decreases, GDP increases. Pakistan has had a “net export” although the trade balance is decreasing constantly.
Srilanka
| Coefficients | Remittance | Foreign Aid | Export | Import |
| 1.186 | 1.109 | 1.49 | -0.46 | |
| R | 0.993 | |||
| Adjusted R² | 0.983 | |||
Y=4567.2+1.186*R+1.109*FA+1.49*X-0.46*I
Since Sri Lanka began to shift away from a socialist orientation in 1977, the government has been deregulating, privatizing, and opening the economy to international competition. Twenty years of civil war slowed down economic growth, diversification and liberalization in the country. Sri Lanka’s garment industry is heavily dependent on the United States, with 63 percent of all garment exports bound for the United States.
Sri Lanka’s economy is highly correlated to remittance, aids and export. The export has been the most dominant factor for the GDP growth of Sri Lanka. Import has a positive impact of the GDP growth as the import decreases, the GDP increases, showing a reduction in dependence of the country over the years. This impact, however, is much negligible compared to the other three factors which have almost twofold or threefold impact on GDP.
From the analysis of the last 30 years, it is seen that the remittance of Sri Lankan workers from abroad earned $2,088 billion as workers’ remittances during the last fiscal year 2005, about 33% more compared to that of the fiscal year 2006. Export contributes about 20.7% of the economy. The relationship of the Remittance to GDP growth is positive – this means that the economy is quite positively affected by the changes in the remittance and is efficient in using the foreign remittance.
The exports of Sri Lanka stood at $7,887 billion in the fiscal year 2005. Sri Lanka mainly emphasizes on exporting garment products to its neighboring countries, Europe and The United States. The exports in the most recent year have increased by exactly 2-folds. The exports in relation to GDP have been positive – thus showing a correlation that the export will have a positive impact on the increase the GDP growth. The imports stood at $42.1 billion in the financial year 2004-2005, up by 5.63 percent from last year’s imports. The import is negatively correlated in relation to the GDP growth which is a positive factor since the country will be adding more to the GDP growth with declines in the import segment. However, export is not very strongly correlated with GDP.
From the model, it is seen that one of the largest remittance earning country compared as a percentage to the GDP so the growth of the country has been strongly influenced by the change in export. Sri Lanka also has a positive correlation of remittance and foreign aid whereas the imports are negatively correlated.
Recommendations and Conclusion
Based on the study that e have conducted we believe that following recommendations will be effective. As we have seen that the export and remittance sector have been the most emerging we are recommending export and remittance policies.
Export Policies
- Tax benefits for RMG industries: As we have seen from our analysis that RMG has the most emerging sector of our economy. Over the years RMG has been the major contributor to our economy. So, policy makers should make the RMG sector as the “USP” of Bangladesh economy. Therefore to attract more investors to invest in this sector proving these investors with tax benefits can be useful.
- Quality improvement: If our RMG products want to capture new target market it is compulsory to maintain quality standard. In order to make trendy products fashion institute can be established.
- Revival of jute goods: revival of jute industry and producing attractive jute products can certainly create a new vibe in the international market.
- Strengthen backward linkage industries: if proper channel of backward linkage is ensured our economy can certainly ensure proper utilization of resources. In the process it can create more employments.
- Participating in global trade fairs: In this way we can create more exposure of our goods to foreign market.
- Ensuring conducive environment for the exporters: Government needs to ensure that exporters can operate hassle free way.
Remittance policies
- Establish more technical institutes: The government as well as private sector can establish more high quality technical, polytechnics and vocational institutes that can supply skilled and professional personnel.
- Encourage the remittance recipients for productive investment: Government as well as NGOs can play important roles in this respect. The government should eliminate regulatory constraints of transferring remittance for NGOs.
- Creating Enabling environment to invest Remittances in Capital Market: Moreover, the government can make easy access to the capital market for the remittance recipient families. Although at present there is a provision for quota of foreign investors or nonresident Bangladeshis during Initial Public Offering(IPO) of issuing shares, but this process is so critical that most of the time this quota doesn’t fulfilled. The government should make this quota system of issuing IPO also applicable for the families of the non-resident Bangladeshis, so that they can invest in the capital market.