Product design:
Product Design can be defined as the idea generation, concept development, testing and manufacturing or implementation of a physical object or service. It covers more than the discipline name – Industrial Design. Product Designers conceptualize and evaluate ideas, making them tangible through products in a more systematic approach. The role of a product designer encompasses many characteristics of the marketing manager, Product management, industrial designer and design engineer.
This evolving role has been facilitated by digital tools that allow designers to communicate, visualize and analyze ideas in a way that would have taken greater manpower in the past.
As with most of the design fields the idea for the design of a product arises from a need and has a use.
Product designers are equipped with the skills needed to bring products from conception to market.
Aesthetics is considered important in Product Design but designers also deal with important aspects including technology, ergonomics, usability, human factors and material technology. The values and its accompanying aspects which product design is based on vary, both between different schools of thought and among practicing designers.
What is our product?
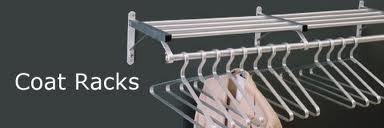
The name of our product is Office Coat Hanger.
An office coat hanger is very important for those who use coat at office. Nowadays the importance of an office coat hanger has increased. And if the coat hanger can be of multipurpose use, it will increase the importance even more. Coat is an expensive clothing. So one will take good care of his/her coat.
We are trying to build an office coat hanger that will be more suitable and acceptable for the consumers.
Objective:
Our objective was to design, development and fabrication of an Office Coat Hanger.
Design Analysis of (Office Coat Hanger)
Market Survey:
A market survey is an important requirement for initiating any successful business. The objective of a market survey is to collect information on various aspects of the business. This survey is a tool through which we can minimize risk. After the market survey, the results must be analyzed in order to finalize a business plan.
As a part of the course our group was given assignment on designing an office coat hanger. We performed market survey to measure product satisfaction among customers. We asked the customer to rate certain attributes of a product, such as quality, features, ease-of-use and durability.
We went to different offices and markets to find out what are already in the market and what their features are.
Customers demand is an economic principle that describes a consumer’s desire and willingness to pay a price for a specific good or service. Holding all other factors constant, the price of a good or service increases as its demand increases and vice versa.
In order to verify the current market situation that is to see customer responses to different aspects of this kind of product, a survey was performed among them. We went to the houses and offices of different parts of Dhaka city.
The following questions are in the survey:
Results of Survey Questionnaires:
- Are you familiar with office coat hanger?
- Have you ever used an office coat hanger?
- Which kind of hanger would you prefer?
- Which material would you prefer for your coat hanger?
- Which color would you prefer for your hangar?
- What is your opinion if the hanger is made for multipurpose use?
- How much weight will you prefer?
- Your expected life time for a hanger?
- Have you used any kind of coat hanger before?
- If you have used it earlier then rate your satisfaction level?
- What’s your opinion if we add tie hanger, cap hanger and key hanger?
- Rate the following features as your priority list between 1 to 10.(1 as minimum and 10 as maximum)
- If multipurpose then what kind of other services you want from a coat hanger?
- Do you want your product to be environmental friendly?
- Are you willing to pay extra money for environmental corrosion protection?
- What is your expected price range for an office coat hanger?
- If you go to a market, then would you buy a product like this?
- At this point you have get at least a blurred design of our product in your imagination, do you like it?
- Will you recommend your friend to buy this?
Quality Function Deployment:
A quality function deployment (QFD) diagram is a matrix used to depict customer requirements. A QFD is used to capture the voice of the customer and translate it into technical information that an organization can use in order to create or improve a product.
It is often called a HOUSE OF QUALITY because:
Customer information is shown horizontally.
Technical information is shown vertically.
Possible Benefits of QFD:
The possible benefits for using the QFD processes are:
- Creates a customer driven environment
- Reduces the cycle time for new products
- Uses concurrent engineering methods
- Reduces design to manufacture costs
- Increases communications through cross functional teams
- Creates data for proper documentation of engineering knowledge.
In our product, first we prepared some questions as shown before to find out what customers want and which we will be capable to fulfill in terms of our engineering facilities. Then we use that question/answer to build the HOUSE OF QUALITY for both customer requirements and technical requirements. We turn the answers in a percentage value in respect to the amount of customer we asked those questions and put those in customer’s importance column. We also rate our product for now and for future in the basis of functionalities we had targeted to achieve. Also rate the best competitor in the market we have. According to the data we collect we made the relation between customer requirements and technical requirements.
Table 2.2.1: House of Quality
The legend for the QFD is as follows:
- Strong Interrelationship (5)
- Moderate Interrelationship (3)
- Weak Interrelationship (1)
The following Bar chart consists of the Importance rating of the customer requirement done on the product.
Functional Analysis:
An organized method of presenting a product’s operations is called Functional Analysis. It helps to define a system in terms of its functions or operations before completing the physical design. Functional Analysis (or decomposition) is one means of accomplishing objectives like Documentation, Personnel transitions, Future Modifications.
The goal of this analysis is to help the designer for producing a product that captures all of the functional goals (doesn’t miss anything) and does so in an optimized manner (helps find “best” solution). Functions can be determined from a customer needs list, but the technique is most easily applied to existing products (then it called physical decomposition). Since most of the design work of engineers is redesign of existing parts/things, this is the method that should be used in that case. So, here we will be analyzing a Office Coat Hanger.
Black Box Diagram:
In science and engineering, a black box is a device, system or object which can be viewed in terms of its input, output and transfer characteristics without any knowledge of its internal processes. So without knowing its internal processes it is called Black Box. The reason to use this type of Diagram is to find out the importance and working method of specific parts or object in system, in future modification those diagrams can be very useful for knowing necessary changes in other components working method.
Design Analysis:
Design Specification:
Where it will be used:
- Home
- Office
Some portion of the product:
- Hanger based with main stand
- Hanger for coat
- Hanger for cap or hat
- Hanger for tie
- Holder for brush
One can put his/her coat in office
It is weir resistant
As it is TIG welded it has very high strength
It is for multipurpose use such as tie, coat, brush, shoe can also be kept in it
Stress Analysis:
In this part of the report we have tried to find out the critical points of the product and calculate the stresses developed in those points and find the minimum factor of safety and diameter of the part to get the maximum life of the product.
Design for Manufacture and Design for Assembly:
Design for manufacturing (DFM) & Design for Assembly (DFA) are the integration of product design & process planning into one common activity.
Design for Manufacture (DFM) aims to eliminate the often expensive and unnecessary features of a part that make it difficult to manufacture. It helps prevent the unnecessarily smooth surface, the radius that is unnecessarily small, and the tolerances that are unnecessarily high.
Design for Assembly (DFA) techniques aim to reduce the cost and time of assembly by simplifying the product and process through such means as reducing the number of parts, combining two or more parts into one, reducing or eliminating adjustments, simplifying assembly operations, designing for parts handling and presentation, selecting fasteners for ease of assembly, minimizing parts tangling, and ensuring that products are easy to test.
The goal of design analysis is to design a product that is easily & economically manufactured.
In DFM 70% of manufacturing cost depends on Design decision. It includes cost of materials & processing assembly. 20% of manufacturing cost depends on Production decision.
Here we will talk about how we have implemented DFM & DFA guidelines in our product “Office Coat Hanger”.
(A) Design for Manufacture (DFM)
- 1. Reduce total no of parts: The total no of parts of the product should be reduced. In our product “Office Coat hanger” we have reduced the body parts by combining them into one. Tie hanger and ID hanger is combined.
- 2. Develop a Modular Design: According to DFM a modular design should be developed. In our hanger there are four modules:
i. Hanger body(Base + main stand)
ii. Main stand(Main pipe + other holders)
iii. Coat hanger(L shape pipe + hanger)
3. Use of Standard Components: Use of Standard Components means using standard size so that they are easily available. In case of Office coat hanger we used same size of the coat hanger bar which is standard and used in the market.
4. Design parts to be multifunctional: There should be some parts of the product which complete multiple functions. In this product we are using the tie hanger which can also be used as ID card hanger.
Besides those guidelines some other things like easy for top down assembly, simplify operation, design for minimum assembly are being considered in the time of designing this product.
(B) Design for Assembly (DFA)
1. Simplify Design & Reduce no of parts: The design of the “Office coat hanger” is very simple. It has a body which consists of base and and the stand in the upper base consists the coat hanger, tie hanger, cap or hat hanger, brush holder.
2. Standardize and use common parts: Standardize parts are used in this product like the standard size of a coat hanger is 16 – 17 inch.
3. Design for ease of fabrication: It has an easy design so the fabrication is easy and no difficulties will be arise in the time of fabrication.
4. Mistake proof Product design: The design of “Office coat hanger” is revised over and over again and a sample was also made at first time so that the design is mistake proof.
Material and Process Selection:
OFFICE COAT HANGER
M.S. Mild Steel
S.S. Stainless steel
C.I. Cast iron
Al. Aluminum
Alternative material selection is a process by which we can choose the perfect metal for different parts of the product in manufacturing process by considering all the properties of different types of materials. From the charts below we have selected the material to manufacture different parts of our product. We have got some scores for different materials. And from the scores we have chosen the material which has the highest score. By doing so, we have chosen material to manufacture all the parts of our product.
All the ratings are out of 10
1. Base
| Selection criteria | Importance | M.S. bar | S.S. bar | C.I. | Wood | ||||
| (%) | Rating | Score | Rating | Score | Rating | Score | Rating | Score | |
| Strength | 30 | 8 | 2.4 | 9 | 2.7 | 4 | 1.2 | 3 | 0.9 |
| Low cost | 20 | 8 | 1.6 | 3 | 0.6 | 9 | 1.8 | 9 | 1.8 |
| Appearance | 5 | 6 | 0.3 | 8 | 0.4 | 5 | 0.25 | 6 | 0.3 |
| Heavy weight | 15 | 8 | 1.2 | 5 | 0.75 | 6 | 0.9 | 3 | 0.45 |
| Durability | 15 | 7 | 1.05 | 9 | 1.35 | 6 | 0.9 | 5 | 0.75 |
| Wear resistance | 10 | 7 | 0.7 | 5 | 0.5 | 6 | 0.6 | 5 | 0.5 |
| Corrosion | 5 | 7 | 0.35 | 9 | 0.45 | 6 | 0.3 | 10 | 0.5 |
| Total weighted score | 100 | ||||||||
7.6
6.75
5.95
5.2
Table 2.4.1: Weighted score of Different Materials for Base
Total weighted score ranking shows that M.S. (Mild steel) bar is better than S.S. (Stainless steel) or C.I. (Cast iron) or Wood for making the part as it has the highest score.
2. Stand
| Selection criteria | Importance | M.S. pipe | S.S. pipe | Al pipe | C.I. | ||||
| (%) | Rating | Score | Rating | Score | Rating | Score | Rating | Score | |
| Strength | 25 | 8 | 2.0 | 9 | 2.25 | 7 | 1.75 | 4 | 1.0 |
| Low cost | 20 | 8 | 1.6 | 4 | 0.8 | 3 | 0.6 | 9 | 1.8 |
| Appearance | 5 | 6 | 0.3 | 8 | 0.4 | 8 | 0.4 | 5 | 0.25 |
| Light weight | 15 | 5 | 0.75 | 6 | 0.9 | 9 | 1.35 | 3 | 0.45 |
| Durability | 10 | 7 | 0.7 | 9 | 0.9 | 9 | 0.9 | 6 | 0.6 |
| Corrosion | 5 | 7 | 0.35 | 9 | 0.45 | 9 | 0.45 | 6 | 0.3 |
| Bending characteristics | 20 | 7 | 1.4 | 8 | 1.6 | 3 | 0.6 | 5 | 1.0 |
| Total weighted score | 100 | 7.1 | 7.3 | 6.05 | 5.4 | ||||
Table2.4.2: Weighted score for different materials for main stand
Total weighted score ranking shows that S.S.(Stainless steel) pipe is Better than M.S(Mild steel) or C.I(Cast iron) or Al(Aluminum) for making the part as it has the highest score.
3. Holder (cap, tie, brush holder and tie hanger)
| Selection criteria | Importance | M.S. pipe | S.S. pipe | Al pipe | C.I. | ||||
| (%) | Rating | Score | Rating | Score | Rating | Score | Rating | Score | |
| Strength | 30 | 8 | 2.4 | 9 | 2.7 | 7 | 2.1 | 4 | 1.2 |
| Low cost | 15 | 8 | 1.2 | 4 | 0.6 | 3 | 0.45 | 9 | 1.35 |
| Appearance | 10 | 6 | 0.6 | 8 | 0.8 | 8 | 0.8 | 5 | 0.5 |
| Durability | 20 | 7 | 1.4 | 9 | 1.8 | 9 | 1.8 | 6 | 1.2 |
| Corrosion | 10 | 7 | 0.7 | 9 | 0.9 | 9 | 0.9 | 6 | 0.6 |
| Joining process | 15 | 8 | 1.2 | 5 | 0.75 | 4 | 0.6 | 7 | 1.05 |
| Total weighted score | |||||||||
100
7.5
7.55
6.65
5.9
Table 2.4.3: Weighted score of different materials for holder.
Total weighted score ranking shows that S.S.(Stainless steel) is Better than M.S(Mild steel) or C.I(Cast iron) or Al(Aluminum) for making the part as it has the highest score.
Alternative Manufacturing Process Selection:
Alternative manufacturing process selection is a process by which we can select the best manufacturing process for different types of parts of our product. In this process we have compared different types of processes and then we choose the best process for our product.
Selected Manufacturing Process for Our Product
| Name of the Parts | Material | Manufacturing Process |
| Base | Mild Steel Plate | Flame cutting |
| Grooving | ||
| Bench Type Drill | ||
| TIG Welding | ||
| Stand | Stainless Steel | Power Saw Cutter |
| Hanger | Stainless Steel | Manual Bending |
| TIG Welding | ||
| Cap Holder | Stainless Steel | Manual Bending |
| TIG Welding | ||
| Tie Holder | Stainless Steel | Manual Bending |
| TIG Welding | ||
| Shoe Holder | Stainless Steel | Manual Bending |
| TIG Welding | ||
| Bruss Holder | Stainless Steel | Manual Bending |
| TIG Welding |
Table 2.5.1: Alternative Manufacturing Processes for Office Coat Hanger
From above table we can see what types of machining processes we need during this product manufacturing. We compared among different machine for each and every process to find out the best suitable machines for a particular job with lowest possible cost.
Manufacturing Process Selection for
Cutting of M/S Bar (BASE)
Selection Criteria | Weight of Importance | Shearing | Sheet Cutter | Flame Cutting | |||
Rating | Score | Rating | Score | Rating | Score | ||
Quality | 23 | 5 | 1.15 | 6 | 1.38 | 8 | 1.84 |
Easy to operate | 21 | 7 | 1.47 | 7 | 1.47 | 9 | 1.89 |
Finishing | 19 | 6 | 1.14 | 8 | 1.52 | 8 | 1.52 |
Operation time | 15 | 5 | 0.75 | 8 | 1.2 | 6 | 0.9 |
Low cost | 22 | 7 | 1.54 | 5 | 1.1 | 6 | 1.32 |
Total | 100 | 6.05 | 6.67 | 7.47 | |||
Table 2.5.2 : manufacturing process selection for cutting M/S bar
The above chart shows that the weighted score of Flame cutting is better than the other alternatives. So, Flame cutting can be selected for cutting M/S bar.The above chart shows that the weighted score of Sheet cutter is better than the other alternatives. So, Flame cutting can be selected for cutting M/S bar.
Manufacturing Process Selection for
Pipe Cutting
Selection Criteria | Weight of Importance | Power Saw Cutter | Flame cutter | Lathe | |||
Rating | Score | Rating | Score | Rating | Score | ||
Quality | 23 | 8 | 1.88 | 6 | 1.38 | 7 | 1.61 |
Easy to operate | 21 | 7 | 1.47 | 8 | 1.68 | 8 | 1.68 |
Finishing | 19 | 7 | 1.33 | 7 | 1.33 | 8 | 1.52 |
Operation time | 15 | 8 | 1.2 | 6 | 0.9 | 5 | 0.75 |
Low cost | 22 | 9 | 1.98 | 7 | 1.54 | 7 | 1.54 |
Total | 100 | 7.86 | 6.83 | 7.1 | |||
Table 2.5.3: manufacturing process selection for pipe cutting
The above chart shows that the weighted score of Power saw cutter is better than the other alternatives. So, Power saw cutter can be selected for pipe cutting.
Manufacturing Process Selection for
Joining
Selection Criteria | Weight of Importance | Arc Welding | TIG Welding | MIG Welding | |||
Rating | Score | Rating | Score | Rating | Score | ||
Easy to operate | 12 | 9 | 1.08 | 7 | 0.84 | 7 | 0.84 |
Finishing | 24 | 6 | 1.44 | 8 | 1.92 | 8 | 1.92 |
Operation time | 10 | 7 | 0.7 | 7 | 0.7 | 8 | 0.8 |
Low cost | 24 | 8 | 1.92 | 6 | 1.44 | 5 | 1.2 |
Strength | 15 | 7 | 1.05 | 8 | 1.2 | 8 | 1.2 |
Durability | 15 | 6 | 0.9 | 8 | 1.2 | 7 | 1.05 |
Total | 100 | 7.09 | 7.3 | 7.01 | |||
Table 2.5.4: manufacturing process selection for joining
The above chart shows that the weighted score of Arc Welding is better than the other alternatives. So, Arc Welding can be selected for Joining.
Manufacturing Process Selection for
Pipe Bending
Selection Criteria | Weight of Importance | Roller Bending | Manual Bending | ||
Rating | Score | Rating | Score | ||
Easy to operate | 30 | 6 | 1.8 | 8 | 2.4 |
Operation time | 25 | 7 | 1.75 | 7 | 1.75 |
Low cost | 30 | 7 | 2.1 | 8 | 2.4 |
Quality | 15 | 6 | 0.9 | 7 | 1.05 |
Total | 100 | 6.55 | 7.6 | ||
Table 2.5.5: manufacturing process selection for pipe bending
The above chart shows that the weighted score of manual bending is better than the other alternatives. So, Manual Bending can be selected for Bending.
Cost Analysis (Office Coat Hanger)
Here we are going to discuss about all the different kind of costs that will be needed for the mass production of our product. To figure out the cost of production per unit, the cost of production is divided by the number of units produced. This analysis will consist of all the costs from factory setup cost till sell. Production costs can be used to compare the expenses of different activities within the company. Let us assume that yearly we will manufacture 9000 pieces of this product. All the prices here are given in taka. So the total cost analysis is given below:
Cost Analysis:
Factory Setup Cost:
Land (advance) : 1,500,000
Building Construction: 1,000,000
Rent : 20,000 [1 year, 20000*12=240000]
Others setup : 80,000
Total : 2,600,000
Life=15 years
Salvage=200000
Depreciation=(1000000-20000)/15
=53333.333 or 55000
(All the prices are in taka)
Machine Cost:
As our product, different types of Machines are needed. This will be brought from China.
Machine name | Price | Salvage | Lifetime(years) | depreciation |
Power saw cutting machine | 30,000 | 8,000 | 4 | 5,500 |
Tig welding machine | 15,000 | 3,000 | 3 | 4000 |
Manual bending machine | 170,000 | 40,000 | 6 | 21,500 |
Hand grinding machine | 5,000 | 2,000 | 2 | 1,500 |
Arc Welding | 2000 | 500 | 2 | 750 |
Total | 222000 | 33250 |
[Depreciation= (price – salvage)/lifetime]
Manufacturing Cost:
Cost
Parts | Machine Cost (Per Year) | Machine cost (per piece) | Raw Material Cost (Per piece) | Labor cost (Per year) | Labor cost (per piece) |
Base | 4900 | 0.544 | 500 | 120000 | 13.33 |
Stand | 6000 | 0.666 | 600 | 120000 | 13.33 |
Ball | 3000 | 0.333 | 30 | 120000 | 13.33 |
Hanger & Holders | 4900 | 0.544 | 210 | 120000 | 13.33 |
Total | 18800 | 2.087 | 1340 | 480000 | 53.32 |
Table 3.1.1: Manufacturing cost table
*Here we used 5 employees for our machine to operate.
Labor cost (per year) = (5 * 8000 * 12) = 480000
Labor cost (per piece) = (120000 / 9000) = 13.33
Transportation Cost:
Price : 1,500,000; [Total fixed cost]
Salvage : 500,000
Life : 12 years
Maintenance : 150,000 (driver wages + oil + others); [Transportation overhead cost]
Depreciation for first year: 83000
3.1.5 Overhead Cost: (Per Year)
Salary:
- Managing Director
- Engineer
- Stuff
- Clerk
Sub Total = 1,680,000
Space Rent : 180,000
Electricity, Gas, Water and other Bill : 300,000
Maintenance : 50,000
Safety Measurement : 30,000
Advertising : 40,000
Factory Insurance : 100,000
Trade License : 50,000
Opportunity Cost (12% of initial Investment : 800,000
Total = 3,230,000
Overhead cost per piece = (3230000 / 9000) = 358.89
Break Even Point:
Fixed Cost = Factory Setup Cost + Machine Cost + Overhead Cost + Transportation Cost + maintenance cost
= 55000 + 33250 + 3,230,000 + 83,000+ 150,000
= 3551250
Variable Cost = Direct Material + Labor Cost
= 1340+53.31
= 1,394; [per piece]
Selling Price = {(Direct Cost + Machine Cost + Overhead Cost) * Quantity} + Profit
= (1340+2.087+358) + Profit (17.64% profit)
= 1700+(1700*17.64%)
= 2000; [per piece]
So the Break Even Point Q is,
Fixed Cost + Variable Cost * Q = Selling Price * Q
Or 3551250 + 1,394 * Q = 2,000 * Q
Or, Q = 5860 or 5900
Pay Back Period:
Determination of Pay Back Period
Initial cost | Recurrent cost per year (Direct labor + Overhead cost ) (TK) | Variable cost per unit (TK) | Total variable cost (for the forecast demand) (TK) | |
Sources | Cost (TK) | |||
Factory Setup | 2,600,000 | 3,710,000 | 1,394 | 9,000 * 1,394 = 12,546000 |
Machines | 222,000 | |||
Transport | 1,500,000 | |||
Table 3. : Determination of Pay Back Period
Pay Back Period Calculation
Period(year) | Cash flow | Cumulative cash Flow |
0 | -4,322,000 (-Initial cost) | -4,322,000 |
1 | -4,322,000– 3,710,000 -12,546,000 + 18,000,000 (-Recurrent cost-Total variable cost+ Sales) | -2,578,000 |
2 | -2,578,000– 3,710,000 -12,546,000 + 18,000,000 (-Recurrent cost-Total variable cost+ Sales) | -834,000 |
3 | -834,000-3,710,000 -12,546,000 + 18,000,000 (-Recurrent cost-Total variable cost+ Sales) | 910,000 |
Table 3.3 : Calculation of Pay Back Period
So the total investment will be recovered (834000/18000000) = 0.046 of the way through the 2nd year. In this situation the predicted payback period is thus 2.046 years.
Discussion
In this product design and development sessional we design Office Coat Hanger. We followed the steps of product design and development. After the survey we did material selection process. To make Office Coat Hanger we used mild steel for base and stainless steel pipe for stand, hanger and holder. As mild steel is one of the most common metal and one of the least expensive materials, we used it of our product. IT can be easily welded and also it has poor resistance corrosion. Then we did manufacturing process selection.
From this sessional we learnt about the product design and development process under the guidance of our course teacher. It was very complex. Proper guidance of our teacher and hard work of our group member made it possible.
Conclusion:
Product Design and Development Sessional was a registered course of our third year first semester undergraduate studies of Industrial and Production Engineering. This sessional was for teaching us practical knowledge and obstacles which we can face in future.
We made office coat hanger in our product design sessional. It was the first time that we made a product by ourselves so it was totally new & difficult for us. But in the end we learnt a lot things and we finally made it. In our report, throughout information and analysis are provided about a moderate design of office coat hanger. The results of the product were satisfactory.
Our product design is our own. We do our best to provide accurate documentation of all aspects of the projects and the results in this report. We have posted material that we believe is important, useful, and informative to readers
Recommendation:
Developed product is not similar just like designed product. Because, lack of machining process. In future we will try to produce the similar job if we get the enough machining process.
In our product, we have used mild steel in base so it became a little bit heavy. which can be solved by further calculation.
In our product we can also work to reduce the size of the product as it is a little bit big.
By generating new ideas it can be of more multipurpose used.
There are also many problems which can be solved by calculating again and again.
Bibliography
Kenneth S. Eduards, Jr. and Robert B. McKee, Fundamentals of Mechanical Component Design, McGraw-Hill, Inc, New York, U.S.A, 1991.
Andrew Pytel Ferdinand & L. Singer, Strength of Materials- Fourth Edition.
R. K. Jain, Engineering Metrology-Nineteenth Edition.
J. P. Holman, Experimental Methods for Engineers- Seventh Edition ,Tata McGraw-Hill Publishing Company Limited.
