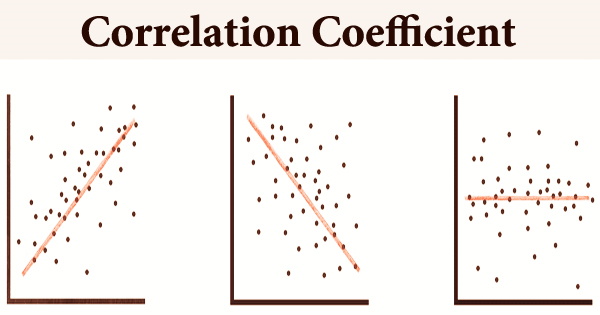
A correlation coefficient is a statistical measure of how strong a link exists between two variables’ relative movements. Two columns of a given data set of observations referred to as a sample or two components of a multivariate random variable with a known distribution can be used as variables. Correlation coefficients are unit-free, allowing for direct comparison of coefficients across research. The range of values is -1.0 to 1.0.
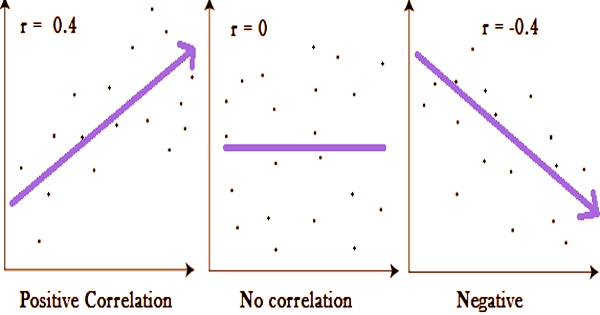
There was an error in the correlation measurement if the computed number was higher than 1.0 or less than -1.0. A perfect negative correlation is represented by a correlation of -1.0, whereas a perfect positive correlation is represented by a correlation of 1.0. A correlation of 0.0 indicates that there is no linear link between the two variables’ movements. Correlation coefficients have a number of drawbacks as analytical tools, including the potential for outliers to skew some kinds and the risk of wrongly inferring a causal link between variables.
A correlation value of 1 indicates that for every positive rise in one variable, a set proportion of the other increases as well. Shoe sizes, for example, increase in (nearly) exact proportion to the foot length. There is no positive or negative rise for any increment of zero. It has applications in finance and investment.
To measure the amount of connection between the price of crude oil and the stock price of an oil-producing firm, such as Exxon Mobil Corporation, a correlation coefficient might be determined. Because oil corporations benefit more when oil prices rise, there is a strong positive connection between the two variables.
The degree of correlation in data can be measured in a variety of ways, depending on the type of data: whether it’s a measurement, ordinal, or categorical data. In statistics, the Pearson correlation is the most often utilized. This metric assesses the strength and direction of a two-variable linear connection. The Pearson Product Moment Correlation (PPMC) is the full term for the linear relationship that exists between two sets of data.
The Pearson product-moment correlation coefficient is generally referred to when the phrase “correlation coefficient” is used without qualification. A value of exactly 1.0 indicates that the two variables have a perfect positive connection. There is a positive rise in the second variable for every positive increase in the first.
A score of -1.0 indicates that the two variables have a complete negative connection. This demonstrates that the variables move in opposing directions, with a positive rise in one variable and a decline in the other. There is no linear relationship between two variables if their correlation is 0. When quantitative measurements are conducted on units that are grouped into groups, the intraclass correlation (ICC) is a descriptive statistic that may be employed; it shows how closely units in the same group resemble each other.
In certain disciplines of research, analysts do not consider correlations significant until the value exceeds 0.8. A correlation coefficient of 0.9 or more, on the other hand, would indicate a very strong link. The link between the ranks of two variables, or two rankings of the same variable, is measured by rank correlation. The polychoric correlation coefficient determines how closely two ordered-categorical variables are related.
To put it another way, investors can utilize negatively correlated assets or securities to hedge their portfolios and decrease market risk caused by volatility or extreme price swings. Because they seek the dividend income or yield from the stock or security, many investors hedge their portfolio’s price risk, thus reducing any capital gains or losses. The sign of the coefficient indicates whether the variables are moving in the same or opposing directions: a positive value indicates that they are moving in the same direction, while a negative value indicates that they are moving in opposite ways.
Investors may also use correlation statistics to see when the correlation between two factors changes. Because results vary so much between subject disciplines, there are many alternative criteria for evaluating the correlation coefficient. It is computed by first finding the covariance of the variables, then dividing that number by the product of the standard deviations of those variables. Any of many metrics that total up the difference between actual values and the values anticipated under the model to determine how well a statistical model matches data.
Analysts will occasionally use correlation coefficients to forecast how a change in an external factor, such as the price of a commodity or an interest rate, would affect a certain asset. Pearson’s Correlation Coefficient is a linear correlation coefficient with values ranging from -1 to +1. A -1 indicates a high negative connection, whereas a +1 indicates a significant positive association. A 0 indicates that there is no correlation, often known as zero correlation.
Information Sources: