Introduction
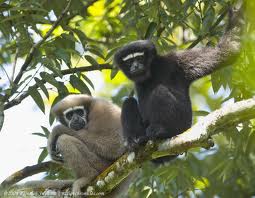
Gibbons are the least known among the apes, since more attention has been traditionally devoted to the great apes (Geissmann 2002). Gibbons hold a very important position in the ecology of tropical forests and have been under considerable threats primarily due to habitat destruction (Preuschoft et al. 1984, Chivers 2001). Among the gibbons, Hoolock Gibbons (Hoolock hoolock) are perhaps under the greatest threat throughout their geographic range (Mootnick et al.1987, MacKinnon and MacKinnon 1987, Islam and Feeroz 1992, Feeroz 1999, 2001, Choudhury 2001) habitat destruction being the principal cause of decline (e.g. Gittins and Akonda 1982, Gittins 1984, Gittins and Tilson 1984, Chivers 2001, Islam et al. 2004). They are distributed in various states in India, with a current total population of more than 2600 individuals Molur et al. (2005). There distribution in southern China and Myanmar is recognized, but population estimates are from the eighties (Mootnick et al. 1987, MacKinnon and MacKinnon 1987). In Bangladesh, hoolock populations have been estimated to be around 3000 individuals in the mid-eighties (Gittins and Akonda 1982). This number had subsequently declined to about 200 individuals in the early nineties (Feeroz and Islam 1992) and continued the declining trend in many areas of Bangladesh, with some areas having lost all of its hoolocks (Feeroz 2001, Das et al. 2003, Islam et al. 2004). Interestingly, however, total population has remained close to 200 individuals (Islam et al. 2004) indicating that hoolocks are tenaciously holding on to the last of the suitable habitat patches in Bangladesh. Currently, hoolocks are classified as endangered globally (IUCN 2005) and in Bangladesh, they are classified as critically endangered (IUCN 2000).
This study was initiated in 2002 with the following objectives: i) to carry out a more comprehensive survey of all known hoolock habitats in Bangladesh with the hopes of providing a robust population estimate of the hoolocks of Bangladesh; ii) to assess suitable habitats of these hoolock populations to determine long term viability of hoolocks; iii) to initiate monitoring of hoolock populations of particular importance (high probability of survival and iv) to create awareness among people living in and around hoolock habitats to aid in the conservation of the species. Surveys conducted in the first year resulted in visual records of 123 individuals in 42 groups in 14 of the 24 sites studied (Islam et al. 2004). It was, however, clear that more hoolocks could be found if certain new sites were surveyed. The habitats of these hoolock populations were also studied with a 12 out of 14 habitats having the bare minimum requirements of the hoolock gibbon (closed canopy structure, mixture of fruiting trees and availability of contiguous areas). Two small populations (Chunati and Horinchara) were still surviving in spite of all these bare requirements and extinction seems to be inevitable for these populations. The population in Lawachara in the northeast was deemed to be the largest and worthy of conservation efforts. The area has been one of the most studied for hoolock ecology and general primate ecology (Ahsan 1984, Feeroz 1991, Feeroz 1999, Kabir 2002, Hasan 2003) and the existing hoolock population has remained relatively constant. Kaptai was identified as a potential site in the southeast with large tracts of closed canopy and mixed fruiting trees. Monitoring activity in this area was recommended to complete the population survey and ascertain the population size (Islam et al. 2004). The study was extended for a second year to complete the unfinished parts of the project.
This report is divided into six major chapters. The first chapter briefly describes the background. Chapter 2 summarizes the study sites to set the stage for the subsequent chapters. The third chapter reports the total counts of hoolocks made during the course of this project and estimates the hoolock populations of Bangladesh. The fourth chapter assesses the availability of habitat suitable for the survival of hoolocks. The fifth chapter explores the long-term viability of the existing hoolock populations through mathematical modeling. The final chapter takes a closer look at conservation and management concerns and provides recommendations for sustaining hoolocks in Bangladesh.
Study Area
For the present study 35 sites were selected to survey of the Hoolock Gibbon (Table 2.1). Descriptions of these areas are given below. Lawachara National Park and Kaptai National Park (Karnafuli Range) were selected for the monitoring purposes. Especial emphasis is given to these areas during the description. A total of 25 sites was surveyed in the southeastern and 10 sites in the northeastern regions of Bangladesh (Map 2.1).
Baralekha
Baralekha is a forest range of Moulvibazar district under the Sylhet Forest Division. Total area of this forest is 3809.09 ha of which 3206.29 ha are Reserve Forest. This Range has three forest beats: Baralekha beat, Madhabchara beat and Shomanbag beat. The area of Baralekha beat is 1817.47 ha of which 1024.11 ha area is natural forest and 161.94 ha is planted forest. It is a part of Patharia hill and the area is covered by many small hillocks. There are many water streams that pass through, some of which originate in India. Baralekha has some natural forests. Main tree species of these forests are Artocarpus chaplasha, Anthocephalus chinensis, Lagerstroemia parviflora, Ardisia solanacea, Antidesma ghasembilla, Syzygium grandis, Ficus religiosa, Ficus benghalensis, Ficus glaberrima, etc. Most of the area is covered with bamboo thickets. Baralekha is also rich in faunal diversity with populations of Rhesus macaque, Assamese macaque, Capped langur and hoolock being recorded in the past
Juri (2 sites: Lathitila and Shagarnal)
Juri is a forest range of Moulvibazar district under Sylhet forest division with a total area of 6844.67 ha. This range is divided into four forest beats. These are (i) Lathitila beat (2278.28 ha), (ii) Putichara beat (1368.01 ha), (iii) Shagarnal beat (1700.4 ha) and (iv) Ragna beat (1497.98 ha).
In Juri the forest type is semi-evergreen with the dominant tree species being Dipterocarpus turbinatus, Tectona grandis, Lagerstroemia sp., Syzygium grandis and Salmalia sp. Undergrowth comprises of mostly various types of bamboo (Bambusa sp.), Eupatorium odoratum, etc. Rhesus macaque, Capped langur and a number of bird species are known to occur within the forest.
Gazipur Tea Estate
Gazipur tea estate area is covered almost entirely with tea garden. Reserve forest occurs adjacent to the tea garden. Very few scattered forest patches remain within the area. Dominant tree species are Dipterocarpus turbinatus, Syzygium grandis, and various types of bamboo species. Rhesus macaque, Capped langur and Assamese macaques occur in the area in addition to a host of birds.
Lawachara National Park
Lawachara is a National Park and currently covers an area of 1250 ha within the West Bhanugach Reserve Forest in the Moulvibazar Forest Range of the Sylhet Forest Division (FD/MoEF 2000a). It is located at 7 km east of Srimangal upazila. The topography of the area varies from medium to steep hilly slopes. Many water streams (locally called chara) pass through and around the numerous hillocks (locally called tila of height about 25-30 m). There are four forest villages (Khasia Punji) of which two are in Lawachara National Park. In Magurchara Punji there are 40 families comprised of 250 people and at Lawachara Punji there are 23 families comprised of about 150 people. Betel leaf cultivation is the main source of income of these villagers. The climate of Lawachara is warm and humid. Humidity ranges from 90 to 95 percent at 6 am and 63 to 87 percent at 6 pm during summer. The total annual precipitation is 2000 mm.
The brown forest soil is a sandy clay loam with low organic content with good drainage properties. The forest is of a semi evergreen type and the canopy height varies from 10-30 m (FD/MoEF 2000a). The top canopy comprises of Tectona grandis, Artocarpus chaplasha, Tetrameles sp., Hopea sp., Pygeum sp. and Ficus sp. The second storey consists of Quercus sp., Syzygium sp., Gmelina sp., Dillenia sp. and Ficus sp. The undergrowth includes Bambusa, Geodorum sp., several ferns and epiphytes. The forest is largely secondary growth forest, much of the trees have been planted in the early to mid 1900´s. Some areas have been planted very recently (Kalachara areas, late 1990´s) while patches of tea gardens also exist (e.g. Jankichara). Lawachara is rich in faunal diversity; especially in avian diversity, with more than 200 species being represented. Among mammals, 6 species of primates (out of 10 known from Bangladesh) are found here. Orange-bellied squirrels, Himalayan squirrel, Large Indian civet, Barking deer, Leopard cat, Crab-eating mongoose also occur in this forest.
Chauitoli
This is a forest beat of Moulvibazar Forest Range under Sylhet Forest Division and is adjacent to Lawachara. Most of the natural cover of the area has been replaced with plantation of Tectona grandis (Shegun) and only a few small scattered natural patches occur in the area, that support Syzygium sp., Artocarpus chaplasha (Chapalish), Ficus sp. (Dumur) and bamboo thickets. The area is not so suitable for the hoolocks due to inadequate fruiting trees. However, a group of hoolock was recorded during the survey along with Rhesus macaque and Pig-tailed macaque. Besides, avian fauna of the site is also notable.
Adampur
Adampur is situated southeast of Lawachara. It is under the jurisdiction of Rajkandi Forest Range, under Kamalganj thana of Moulvibazar district. Total area of this forest is 5295.55 ha. The Dhalai River flows adjacent to this forest. Numerous hillocks with water streams form part of the topography of Adampur. There are two-forest villages within this mixed evergreen forest. Major trees of this forest are Dipterocarpus sp., Alangium agallocha, Artocarpus chaplasha, Anthocephalus chinensis, Tectona grandis, Lagerstroemia parviflora, Ardisia solanacea, Hibiscus macrophylus, Antidesma ghasembilla, Syzygium grandis, Ficus religiosa, Ficus benghalensis, Ficus glaberrima, etc. Various species of Bambusa, Coccinea cordifolia, Eupatorium odoratum, Heliotropium indicum, etc. form rich undergrowth.
Adampur forest beat has three forest blocks- (i) Lewachara block, (ii) Daluachara block and (iii) Baghachara block. In Daluachara block most of the forest is natural and in Lewachara and Baghachara blocks some areas are newly planted. In Lewachara block a total of 156.72 ha was deforested gradually between 1997 and 2001. In these deforested areas 81 ha were planted during 1999-2000 and 2000-2001. The planted species are Artocarpus chaplasha, Lagerstroemia parviflora, Diptertocarpus spp. Syzygium grandis, Shorea robusta, Swietenia mahagoni, and Xylia dolabiformis with 75.72 ha of cane plantation, planted during 1998-1999, 1997-98 and 2001. Cane species are Calamus tenuis and Daemonorops jenkinsianus. Like Lawachara, Adampur is also rich in faunal diversity, particularly in avifauna. Among the primates, rhesus macaques, pig-tailed macaques, capped langurs, slow loris and hoolocks occur in the area. Orange-bellied squirrel, Himalayan squirrel, large Indian civet, leopard cat, crab-eating mongoose also occur in this forest.
Horinchara
Horinchara is situated in Srimangal upazila of Moulvibazar district. It is about 25 km away from the Srimangal town. On the north of Horinchara is Srimangal town; on the southeast is the border of India (Tripura). Horinchara is a tea estate of Finlay Tea Company, Bangladesh with a total area of 875.29 ha and it contains scattered patches of trees mostly planted and maintained by the estate. The hillocks in this area are also covered by tea gardens. There are three forest villages known as Khasia Punji at Horinchara. These are Nirala Punji, Chalta Punji and Nehal Punji. Nirala is the largest containing more than 3000 families. The main occupations of the villagers are betel leaf cultivation and shifting cultivation. Some hillocks are covered with bamboo thickets and low scrub vegetation. Some large trees such as Albizia sp., Acacia sp., Ficus sp., Artocarpus sp. are found scattered throughout the area. Rhesus macaque, Wild boar, Barking deer and many species of birds are known to occur in the area.
Rema-Kalenga Wildlife Sanctuary
Rema-Kalenga Wildlife Sanctuary lies in the Tarap hills which are situated in the reserve forests of the southern part of Sylhet region. This sanctuary is under the Habiganj Forest Range of Sylhet Forest Division. The Habiganj Forest Range is divided into four beats namely Kalenga, Rema, Chanbari and Rashidpur. This sanctuary comprises of both Rema and Kalenga beats. The sanctuary is 7 km northeast of Chunarughat upazila of Habiganj district and 10 km south of Moulvibazar district. Tea plantations bound the north and northwest, villages bound the west and south and the Indian border bound the east of this sanctuary. The wildlife sanctuary covers a total area of 1795 ha. There are numerous hillocks and valleys within the topography of Rema-Kalenga. The hillocks are composed of narrow, broken ridges rising about 50 m above numerous valleys, but mostly with gentle slopes. These valleys are fertile and local forest villagers use it for cultivation. An earthen road from Srimangal virtually bisects the forest into two parts, namely eastern and western. The forest exists only on the hilltops and slopes of the hills. Soils vary from clay loam on level ground to sandy loam on hilly ground. The soil consists of yellowish-red, sandy clay, mixed with granules of mangiferrous iron ore (FD/MoEF, 2000b). Most of the natural forest was clear-felled and then planted in different blocks since 1922 by the Forest Department. The blocks were planted with monoculture species, most of which are timber yielding and commercially important. The Forest Department also planted a mixture of both evergreen and deciduous species, but the majority of the plant species found in this forest have grown naturally over the last 80 years.
The upper canopy of the forest is mainly composed of Artocarpus chaplasha, A. lakoocha, Dipterocarpus turbinatus, Tectona grandis, Aphanamixis sp., Anthocephalus chinensis. The middle canopy is mainly composed of Terminalia sp., Lagerstroemia sp. Dillenia pentagyna, Chickrassia tabularis, as well as different species of Ficus and Albizia. Different types of bamboo species comprise the undergrowth. Some areas are covered with cane plantation. Some exposed areas exist mainly in the periphery of the forest. These are mainly covered with sun grass (Imperata arundinaceae) and rarely have some scattered trees. Rema-Kalenga is very rich in wildlife fauna. Six species of primates occur in this forest. Avian diversity is rich and is essentially similar to Lawachara.
Satchari National Park
Satchari is under the jurisdiction of Satchari Forest Range under Sylhet Forest Division (Habiganj district). The forest patch lies within the Raghunandan Hill Reserve Forest and is bounded on the south by the international boundary with India´s Tripura State. Area of this forest is about 242.91 ha. The area occupies the higher ridges of the northernmost extension of Dupitila, Tipam and Surma sedimentary rocks extending from the Chittagong Hill Tracts through Tripura State of India. The area has a moist tropical climate, with high rainfall concentrated during the monsoon from June to September and generally 4 to 5 months of dry period. Among primates Rhesus macaque, Capped langur, Phayre´s langur, Slow loris and hoolock occur in Satchari.
THE SOUTHEASTERN REGION
Dighinala
Dighinala is under the Forest Range of Khagrachari. It has forested areas and scattered bamboo thickets. Local villagers grow homestead forests. Rhesus macaques, hoolocks and other small mammals occur along with a rich abundance of birdlife.
Pablakhali Wildlife Sanctuary
Pablakhali is situated 45.5 km away from the Rangamati town. Pablakhali is a Forest Range of Rangamati Forest Division of the Chittagong Hill Tracts. This Wildlife Sanctuary is part of the Kassalong Reserve Forest located in the Chittagong Hill Tracts. It was declared as Wildlife Sanctuary in 1983 and occupies an area of 42,087 ha. There are six forest beats under Pablakhali Forest Range. These are (i) Pablakhali, (ii) Mahilla, (iii) Mahilya, (iv) Klapa Kunji, (v) Gatachara and (vi) Pangipara. A total of 12389.06 ha was deforested gradually between 1980 and 1984 in Mahilla, Gatachara and some areas of Pablakhali beat.
This sanctuary is composed of hills running from north to south and spurs branched off the ridges forming a mass of hills and valleys. Northern part of the area is rugged and broken with steep slopes and the rest is of small hills with gentle slopes and valleys. Altitudes of the hills range from about 100-300 m. Kassalong River passes along the west boundary of the sanctuary. The soil on the valleys is clays or clayey loams or sandy loams. The soils are impregnated with iron and have a reddish or yellowish tinge. The climate is subtropical with a long dry season extending from November to May. Average rainfall is about 2500 mm and average temperature varies from 75ºF in December to 95ºF in May. Humidity is very high throughout the year.
The forest is tropical semi-evergreen type. Some of the major species include Swintonia floribunda, Dipterocarpus sp., Quercus sp. and Pterigota alata. Now the forest is disappearing in a rapid rate due to illegal felling and political unrest. Pablakhali is rich in wildlife fauna. The few remaining pair of the critically endangered White-winged Duck (Cairina scutulata) is thought to occur in the area. Among reptiles, pythons (probably both the known species) and two land tortoise species have been recorded from the area, all of which are critically endangered (IUCN 2000).
Ramgar
Ramgar is a Forest Range of Khagrachari Forest Division. Although the total area of this range is 19236.78 ha, it has no forested area. Scattered bamboo thickets occur and local villagers have some homestead forests in the area. Rhesus macaques and other small mammals occur along with a rich abundance of bird species.
Korerhat
Korerhat is situated in Mirsharai upazila of Chittagong district. It is about 70 km north of Chittagong town. Korerhat is a forest range of Chittagong Forest Division. The total area of this range is 9997.16 ha. Korerhat range has four forest beats. These are (i) Korerhat (4896.35 ha), (ii) Koyla beat (1435.22 ha), (iii) Hiako beat (1659.92 ha), and (iv) Andharmanik beat (2005.67 ha). Korerhat beat includes four blocks, namely, i) Korerhat check station, ii) Feni block, iii) Laxmichari block (south) and iv) South Koyla block.
A small patch of natural forest exists in Korerhat. Some big trees are found in both sides of the Korerhat-Khagrachari road. These trees are mainly Dipterocarpus sp., Artocarpus chaplasha, Tectona grandis, Albizia sp. and Swietenia mahagoni. In Laxmichari block small hillocks are covered with new plantations of Alangium agallocha, which were planted in 2001. Koyla, Hiako and Andharmanik beats have mainly Teak forest. Density of coverage is very poor. Small bamboo thickets cover some areas. Small mammals such as Large Indian Civets still occur in the area. Many bird species are also represented.
Hazarikhil Wildlife Sanctuary
Located in the Ramgarh-Sitakunda forests, the proposed but long maintained Hazarikhil Wildlife Sanctuary covers an area of 2,909 ha. It is 45 km north of Chittagong town. The terrain of the sanctuary is irregular and composed of ridges from which numerous spurs run off on all directions. Average altitude of the area is about 350 m from the sea level. The forest cover of the sanctuary is of semievergreen type. Important tree species include Dipterocarpus spp., Artocarpus chaplasha, Tectona grandis, Albizia sp., Swietenia mahagoni, Eugenia sp., and Tetrameles sp. The main animal species include Rhesus macaque, Capped langur, Wild boar, Barking deer, lesser cats, a variety of reptiles and birds.
Bishari
Bishari is under the jurisdiction of Eidgar Forest Range in Cox´s Bazar Forest Division. The total area spans 1052 ha and the major plants include of trees: Dipterocarpus turbinatus, Swintonia floribunda, Syzygium sp., Dillenia pentagyna, Phyllanthus emblica, Terminalia belerica, Entada phaseoloides, Lagerstroemia sp., Albizia procera, Bursera serrata and several species of bamboo. Plantations are primarily of Tectona grandis.
Bengdepa
Bengdepa lies within the jurisdiction of Joarinala Forest Range of Cox´s Bazar Forest Division. It has an area of 518.6 ha, most of which is classified as natural forest. Important tree species include Dipterocarpus turbinatus, Swintonia floribunda, Syzygium sp., Dillenia pentagyna, Phyllanthus emblica, Terminalia belerica, Entada phaseoloides, Lagerstroemia sp., Albizia procera, Bursera serrata and several species of bamboo. Plantations are of Tectona grandis.
Rampahar
This forest beat of Kaptai Range is mostly bisected by the flow of Karnafuli River into Rampahar and Sitapahar blocks. This 688.88 ha forest beat of Rangamati South Forest Division consists of 617.81 ha natural vegetation of Bursera serrata, Ficus sp., Syzygium grandis, Terminalia belerica, Garuga pinnata, Phyllanthus emblica; 71.47 ha mixed plantation of Shorea robusta, Hopea odorata etc. and monoculture of Tectona grandis. The area has hoolock, Rhesus macaque, Pig-tailed macaque, Capped langur and Phayre´s langur. Asian elephant, Wild Dog, Sambar are the occasional visitors of the area. The area is a stronghold of parakeets, woodpeckers and hornbills.
Karnafuli
Karnafuli represents a considerably high quality forest of southeastern part of the country under Rangamati Forest Division. It is a part of Kaptai National Park that was notified in 1999. The total area of the Forest Range is about 3268.92 ha of which 2213 ha have been designated as reserve forest, 143.31 ha as unfertile forest land, 567.85 ha remain under water of associated Karnafuli River and 342.98 ha in Hydro Electric Project (HEP). The range consists of four forest beats (Karnafuli, 597.55 ha; Kaptaimukh, 809.71 ha; Kalmichara and 450.48 ha; Frinkhiong, 184.21 ha) and three forest camps (Chitmorom, 161.91 ha; Chakua, 168.82; Patachari, 160.72 ha). The Karnafuli River and one of its tributaries, the Kaptai Khal, have separated the area into three major blocks (Kaptaikhal West Block, Kaptaikhal East Block and Kaptaimukh Block). The Kaptaimukh beat office and Kolabunia tribal village (Marma tribe) of the Kaptai Khal West Block are inside the reserve forest. On the other hand, camps of army, Ansar and BDR as well as two tribal villages, the Chitmorom and the Chakua, are on the periphery. A deer-breeding center has recently been established in the Kaptaimukh block. The area enjoys a pleasant climate for the associated Karnafuli River. The temperature of the area usually varies from 15ºC to 30ºC and humidity remains between 60% and 80 %. Rainfall is very heavy from May to October.
Most of the reserve forest that stands there now is from plantation of the British period, which has been gradually changed into semi natural condition. The reserve forest mostly exhibits mixed plantation of Tectona grandis, Dipterocarpus sp., Lagerstroemia sp. etc., natural vegetation of Artocarpus chaplasha, Bursera serrata, Syzygium sp., Ficus sp., etc. and some plots of monoculture by Acacia sp., Xylia dolabriformes, Tectona grandis, Dipterocarpus sp., etc.
The area seems to be one of the most important wildlife habitats of the country and it supports a large portion of country´s hoolocks along with Rhesus macaque, Pig-tailed macaque, Capped langur, Phayre´s langur, Slow loris, Asian elephant, Sambar, Leopard, etc. Besides, considerable number of threatened birds such as Kalij Pheasant, Oriental Pied Hornbill, Green peafowl, Red jungle fowl, etc. were also reported from the area.
Chunati Wildlife Sanctuary
Chunati Wildlife Sanctuary is situated at a distance of about 90 km south of Chittagong port city on the west side of Chittagong-Cox´s Bazar highway. It was established and notified in 1986 and the total area of this sanctuary is 7763.97 ha, which is divided into 7 forest beats. These are (i) Chunati (811.34 ha), (ii) Satghar (347.78 ha), (iii) Harbang (1451.42 ha), (iv) Puichari (1354.65 ha), (v) Napora (1609.31 ha), (vi) Jaldi (1148.58 ha), and (vii) Chambal (1040.89 ha). The sanctuary consists of broken hillocks of 20-50 m height in the north-south direction with narrow strips, valleys and streamlets. The sanctuary is close to the Bay of Bengal and enjoys moist tropical climate with a low range of temperature variation. November to February are the coldest months. Humidity varies from 89 to 93 percent at 6 pm.
In recent years, due to illicit felling of trees, encroachment forest land and cultivation of betel-leaf and paddy, the sanctuary have lost most of its natural forest (Gain, 2002; Kabir and Muzaffar, 2002). Trees such as Dipterocarpus sp., Artocarpus sp., Albizia sp., Quercus sp., Syzygium sp., Lagerstroemia sp. etc. still occur here although mostly growing in isolated individual trees or in small, scattered patches. The undergrowth consists mostly of bamboo thickets and Assamlota (Eupatorium odoratum). Some natural forest areas were replaced by short rotation of new plantation in 1997. The newly planted species are mostly Acacia sp., Dipterocarpus turbinatus, Pinus sp. and Shorea robusta.
Asian elephant, have been known to be an important agent in causing damage to crops and people in the area. Other species, such as Capped langur, Rhesus macaque, Barking deer, Wild boar and some species of reptiles still occur here. Birds are relatively well represented.
Satghar
Satghar is a forest beat under the Chunati Forest Range. The region consists of broken hillocks of 20-50 m height. People use the valleys for paddy and betel-leaf cultivation. Once the area was covered with mixed evergreen forest, but due to illegal felling now the area has no natural forest at all except some Dipterocarpus sp. Recently Forest Department has planted some monoculture species such as Tectona grandis, Acacia sp., Pinus sp. Some hillocks are covered with small bamboo thickets. Among primates Rhesus macaque and Capped langur occur in the area. Elephants, wild boars and many species of birds may also occur in the area.
Bamu
This site is 656.6 ha in area and is within the Lama Forest Division in Bandarban. It is on the bank of Matamuhuri River and hillocks of different sizes form part of the landscape. Most of the area is classified as natural forest and is primarily composed of Dipterocarpus turbinatus, Hopea odorata, Artocarpus chaplasha, Ficus sp., Microcos paniculata, Dillenia pentagyna, Entada phaseoloides, Duabanga grandiflora, Bursera serrata, Mangifera sylvatica, Phyllanthus emblica and different species of bamboo. The main species in plantations is Tectona grandis.
Thanchi (Tindu mouza
Thanchi is a Forest Range of Bandarban Forest Division. It has a total area of 6870.45 ha. Important tree species include Ficus sp., Bursera serrata, Syzygium sp., Michelia champaca, etc. Plantations include species such as Michelia champaca, Tectona grandis, etc.
Kudhukoza
Kudhukoza falls within the Rangamati Forest Range of Rangamati district. Ficus sp., Swintonia helferi, Duabanga grandiflora, Gmelina sp. constitute the most common plant species along with different species of bamboo.
Dopachari
Dopachari falls within the Dohajari Forest Range of the Chittagong Forest Division. With a total area of 2814.64 ha, of which 2556.65 ha is classified as natural forest and 217.29 ha is classified as plantations. The important plant species include Albizia chinensis, Dillenia indica, Artocarpus chaplasha, Swintonia helferi, Swintonia floribunda, Ficus sp., Dipterocurpus turbinatus, Derris sp. and Bursera serrata. Plantations are mostly of Tectona grandis.
Sangu
Sangu Forest Range falls under Lama Forest Division of Bandarban district. Important trees include Albizia sp., Cerbera sp., Bursera serrata, Syzygium sp., Artocarpus chaplasha, Phyllanthus emblica, Ficus sp., Ficus bengalensis, Quercus sp., and Muz, etc. Plantations include Hevea brasiliensis and Tectona grandis.
Alikadam
This site falls within the Matamuhuri Forest Range under the Bandarban District. Syzygium sp., Ficus benghalensis, Lagerstroemia sp. are some of the common plant species.
Rajghat
With an area of 566.8 ha, Rajghat occurs in the Fulchari Forest Range of Cox´s Bazar (north) Forest Division. Important species include Dipterocarpus sp., Bouea oppositifolia, Ficus benghalensis, Syzygium grandis, Artocarpus chaplasha, Swintonia floribunda.
Bhomarighona
Bhomarighona is a forest beat under Eidgaon Forest Range, 33 km north of Cox´s Bazar town. The area comprises of many hillocks with gentle slopes and local people cultivate paddy in the valleys. Only a small patch of Dipterocarpus turbinatus represents the forest of this area. Some of the hillocks are covered with small bamboo thickets. Occasional Asian elephant presence is reported while Rhesus macaque and bird species occur at all times.
Fashiakhali
Fashiakhali is situated about 40 km north of Cox´s Bazar town, beside Dhaka-Chittagong highway. Many small hillocks form part of the landscape, and part of Chakoria Sundarbans falls within Fashiakhali. Main tree species of the forest includes Tectona grandis and very few Dipterocarpus turbinatus. A few Heritiera minor are also present in the coastal part of the forest. The area is mainly covered with low scrub vegetation. Elephants occasionally enter into the area while Rhesus macaque and many species of birds occur at all times.
Himchari
Himchari is located 7.82 km south of Cox´s Bazar town. It was established as a National Park in 1980 and has an area of 1729 ha. The terrain is irregular and slopes are mostly precipitous. The hill runs north to south boundary on the west by the branch of the Bay of Bengal. Soil varies from sandy loam to coarse sands. It was classified as a wet evergreen type forested area, originally dominated by Dipterocarpus sp. The forest now consists of isolated patches of trees, and is dominated primarily by scattered scrub vegetation (Gain, 2002). Bamboo occurs as undergrowth mixed with canes, palms, orchid and ferns and sometimes as pure stands. Small mammals occur in this park along with many species of birds and snakes.
Inani
Inani is situated between Himchari and Teknaf and is 21.9 km away from Cox´s Bazar town. The eastern side is continuous with the forest of Ukhia and in the west is Bay of Bengal. Inani is a Forest Range of Cox´s Bazar Forest Division. Total area of this range is 8161.69 ha of which 7769.64 ha are reserve forest and 392.05 ha are protected forest. Inani forest range has four forest beats; these are (i) Jalia Palong, (ii) Inani, (iii) Raja Palong, and (iv) Chuankhali. The terrain is irregular and slopes are mostly precipitous. Soil varies from sandy loam to coarse sands and numerous streams traverse the hills.
The forest is of mixed evergreen type. The upper canopy of this forest is mainly composed of Artocarpus chaplasha, A. lakoocha, Dipterocarpus turbinatus, Tectona grandis and Xylia dolabiformis. The middle canopy of this forest is mainly composed of Terminalia sp., Lagerstroemia sp., Dillenia sp., Chickrassia tabularis, Mesua nagassarium, Aphanamixis polystachya, Alstonia scholaris, Syzygium grandis, Acacia catechu, Salmalia sp., as well as different types of Ficus spp. Undergrowth comprises of mostly various types of bamboo (Bambusa sp.), Eupatorium odoratum, Heliotropium indicum, Coccinea cordifolia, etc.
Inani is rich in wildlife fauna. Capped langur, Rhesus macaque, hoolock, Asian elephant have been recorded from the area. Barking deer, civets, wild boars, many species of snakes and birds may also occur.
Ukhia (Thankhali)
The Thankhali beat of Ukhia Range under Cox´s Bazar South Forest Division is about 40 km north of Teknaf town. The forestland is 3394.88 ha of which 3160.72 ha natural forest and 234.16 ha planted forest. Many wildlife fauna such as Rhesus macaque, Capped langur, hoolock and Asian elephant have been recorded from the area along with an abundance of birds.
Teknaf Game Reserve
Teknaf is located 82 km southeast of Cox´s Bazar town. In the east of it is the Naf River and Myanmar is just on the opposite bank of the Naf River and on the southwest is the Bay of Bengal. Teknaf is categorized as a Game Reserve that was declared in 1983.
The area is hilly, comprising high hills and numerous hillocks. It is a township on the river Naf and just at the end of the hilly region of Cox´s Bazar. There are some small water streams criss-crossed the hilly area. Some hillocks are covered with grasses and some with bushes. Naf is a big river in the south of Cox´s Bazar district. The water of this river is saline due to its same level of the sea. The bank of the Naf River is muddy and covered by mangrove vegetation. The soil of this area is blackish brown and tan. Its surface is sandy and some parts are rather different to bring under plough.
The area is closest to the Bay of Bengal thus it enjoys a moderate climate and the temperature variation is low. Heavy rainfall occurs during the rainy season because of the effect of southwest monsoon. The annual minimum and maximum temperature are between 14.3ºC and 10.7ºC and 26.1ºC and 31.1ºC respectively. In summer, temperature may go up to 41.7ºC. Humidity ranges from 63-95%.
Teknaf peninsula does not have any more unbroken forest because of illegal felling of trees (Kabir and Muzaffar 2002). Species of Dipterocarpus, Salmalia, Albizia etc., occur as scattered trees or patches. The mangrove forest patches in the coasts include species such as Sonneratia apetala, Acanthus illicifolus, Aegialitis rotundifolia, etc. Bamboo occurs as the main undergrowth, while banana, climbers, and epiphytes also occur. The undergrowth dominates the area. Small mammals and a range of bird species occur in the area. It is probably one of the last strongholds of crab-eating macaques in the country and is used extensively by migratory birds as a stopover area.
Upper Rezu
With an area of 619.1 ha, Upper Rezu is located in the Razarkul Forest Range of Cox´s Bazar (south) Forest Division. Of the total area, about 393.1 ha is classified as natural forest and 221.5 ha as plantation. It consists mostly of plantations of Sweitenia mahagoni, Acacia sp., Tectona grandis, Syzygium sp., and Shorea robusta
Table . Coordinates, location and areas of sites surveyed (blank spaces indicate areas that are not available)
| Surveyed sites
| Coordinates
| Area (hectares) | District
| |
| 1 | Baralekha | N-24º41.674´ E-92º11.305´ | 1817.47 | Moulvibazar |
| 2 | Lathitila | N-24º34.201´ E-092º13.859´ | 2278.28 | Moulvibazar |
| 3 | Sagarnal | N-24º27.330´ E-092º07.026´ | 1700.4 | Moulvibazar |
| 4 | Gazipur Tea Estate | N-24º29.637´ E-92º03.620´ | 764 | Moulvibazar |
| 5 6 | Lawachara NP Chaoutoli | N-24º19.595´ E-91º47.246´ N-24º22.258´ E-91º47.315´ | 1250
| Moulvibazar Moulvibazar |
| 7 | Adampur | N-24º15.886´ E-91º53.592´ | 5295.55 | Moulvibazar |
| 8 | Horinchara | N-24º10.280´ E-91º43.288´ | 875.29 | Moulvibazar |
| 9 | Rema-Kalenga WS | N-24º11.074´ E-91º37.635´ | 807.69 | Habiganj |
| 10 | Satchari NP | N-24º7.105´ E-91º27.487´ | 242.91 | Habiganj |
| 11 | Dighinala | Khagrachari | ||
| 12 | Pablakhali WS | N-23º04.057´ E-92º14.689´ | 42087 | Rangamati |
| 13 | Ramgar | N-22º59.830´ E-91º43.821´ | 19236.78 | Khagrachari |
| 14 | Korerhat | N-22º55.524´ E-91º34.047´ | 9997.16 | Chittagong |
| 15 | Hazarikhil WS | 2909 | Chittagong | |
| 16 | Bishari | N-21º31.295´ E-92º09.292´ | 1052 | Cox´s Bazar |
| 17 | Bangdepa | N-21º30.501´ E-92º08.329´ | 518.6 | Cox´s Bazar |
| 18 | Karnafuli | N-22º27.730´E-92º14.542´ | 3268.92 | Rangamati |
| 19 | Rampahar | N-22º30.425´ E-92º10.446´ | 688.88 | Rangamati |
| 20 | Chunati WS | N-21º55.822´ E-92º03.749´ | 811.34 | Chittagong |
| 21 | Satghar | N-21º57.020´ E-92º04.757´ | 347.78 | Chittagong |
| 22 | Bamu | N-21º48.973´ E-92º12.103´ | 656.6 | Cox´s Bazar |
| 23 | Thanchi | N-21º42.639´ E-92º30.101´ | 6870.45 | Bandarban |
| 24 | Kudhukhoza | N-23º11.628´ E-92º13.450´ | Rangamati | |
| 25 | Dopachari | N-22º14.155´ E-92º06.696´ | 2814.64 | Chittagong |
| 26 | Sangu | N-21º31.144´ E-92º13.810´ | Bandarban | |
| 27 | Alikadam | N-21 º37.018´E-92º18.936´ | 41295.54 | Bandarban |
| 28 | Rajghat | N-21º35.233´ E-92º06.270´ | 566.8 | Cox´s Bazar |
| 29 30 | Bhomarighona Fashiakhali | N-21º34.043´ E-92º05.640´ N-21º40.686´ E-92º04.829´ | 1439.67 942 | Cox´s Bazar Cox´s Bazar |
| 31 | Himchari NP | N-21º21.248 E-92º01.706´ | 1729 | Cox´s Bazar |
| 32 | Inani | N-21º13.179´ E-92º04.853´ | 8161.69 | Cox´s Bazar |
| 33 | Ukhia (Thankhali) | N-21º10.268´ E-92º05.569´ | 3394.88 | Cox´s Bazar |
| 34 | Teknaf GR | N-20º54.414´ E-92º16.305´ | 11615 | Cox´s Bazar |
| 35 | Upper Rezu | N-21º21.406´E-92º 07.283´ | 619.1 | Cox´s Bazar |
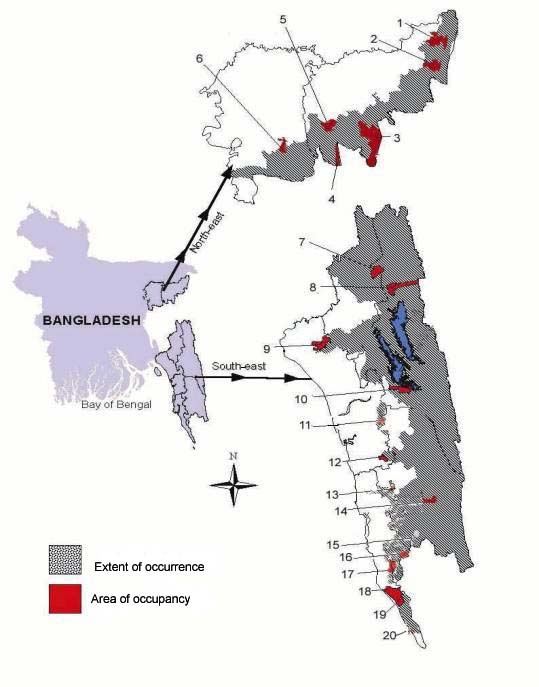
Map . Hoolock Gibbon survey sites in Bangladesh.
(1-Baralekha, 2-Lathitila, Sagarnal, 3-Adampur, Gazipur Tea Estate, Horinchara, 4-Rema-Kalenga, 5-Lawachara, Chautoli, 6-Satchari, 7-Dighinala, Ramgar, 8-Pablakhali, Kudhukhoza, 9-Korerhat, Hazarikhil, 10-Rampahar, Karnafuli, 11-Dopachari, 12-Chunati, Satghar, 13-Bamu, 14-Thanchi, 15-Alikadam, 16-Sangu, 17-Fashiakhali, Bhomarighona, Bangdepa, Bishari, Rajghat, Apar Rezu, 18-Inani, 19-Ukhia, 20- Teknaf)
Population Estimation
Assessing the number of individuals of hoolocks is key to understanding their status and developing a conservation plan. Generally assessing primate populations is a difficult task that invariably leads to inaccurate estimates (Ross and Reeve 2003, Nijman 2004) and this is particularly true for gibbon species due to the fact that they use the forest canopy for movements and foraging (O´Brien et al. 2004). When this work was started, it became evident that habitats available were extremely fragmented and was being subject to constant loss (Islam et al. 2004). For this reason, standard survey techniques such as transect or strip census techniques (Southwick et al. 1996, Feeroz et al. 1995) would be unsuitable for assessing population size. We therefore emphasized maximizing the number of days spent in sites with evidently a large number of (or reports of a large number of) hoolocks.
Field Methods and data analyses
At each site, local people were consulted for identifying possible locations of hoolock groups. One local guide was taken and existing paths within the forest patch or streams were walked on foot by a team of 2-4 individuals. The team conducted census walks between 0500 and 1730 hours with a total of two hours break throughout the entire period. Every 5-10 minutes the members of the team would stop to look around for signs of hoolock presence. This included hearing for calls; scanning the tree line with binoculars for hoolocks in the canopy; looking for important fruiting trees (such as fig species, Ficus). When calls were heard, there was an attempt to assess the direction of the call and then to locate the group. Once located, the age-sex structure of the group was ascertained, with the assignment of each individual to either adult male, adult female, sub-adult male, sub-adult female, sub-adult (undetermined sex), juvenile or infant following Feeroz (1991) and Ahsan (1994). When counting hoolocks in high-density areas (such as Lawachara and Kaptai), extra time and effort was given to ensure that double counts were not made by visiting the sites repeatedly and ascertaining numbers and age-sex structure. The coordinates of the encounter were determined using a hand-held Global Positioning System device. The GPS coordinates were recorded into a computer and the locations of the groups plotted on digital and paper maps of the area. When the group could not be located, the group size was conservatively assumed be 2 individuals and the coordinates were recorded, along with the direction and approximate distance from the calling group. The total distance traveled during walks was estimated from the GPS readings of the starting and ending points, and from the GPS coordinates taken from various locations during the census walk (including those of hoolock encounters).
Results and Discussion
Two hundred and fifty eight hoolocks in 80 groups were observed during this survey over all the sites. Additionally, 12 distinct groups with an estimated 24 individuals were heard calling, making the total population to be an estimated 282 individuals in 96 groups. This constitutes the most comprehensive count of hoolocks in Bangladesh to date.
It is clear that hoolock populations have undergone massive declines since the 80s attributable primarily to habitat destruction. Here, find evidence indicates that hoolocks continue to survive in small pockets of fragmented forests in Bangladesh. We recognized the importance of several sites in the northeast and southeast earlier (Islam et al. 2004). The largest population in the northeastern region is arguably that in Lawachara National Park within West Bhanugach Reserve Forest (Table 3.1). The population in Lawachara has been studied extensively and had so far been regarded as the best in Bangladesh (Feeroz 2001, Islam et al. 2004). Additional populations in Adampur, Baralekha and Lathitila are of importance, each having larger than the numbers required to have a viable population (see Chapter 5). The southeastern region has so far been questionable with respect to Hoolock Gibbons due to acute habitat loss and political unrest (Gain 2002). Within our limited survey work, we identified Karnafuli of Kaptai, a secondary forest, seemingly having sufficient habitat to hold large number of hoolocks (Islam et al. 2004). Extended monitoring activity in the area revealed the largest stronghold of hoolocks in the country with 84 individuals. Rampahar beat of Kaptai Range, slightly separated from Karnafuli, was noted to have 16 individuals, further elevating the number of hoolocks in the area.
The rest of the scattered populations of less than 9 individuals vary in terms of importance. Some have been covered entirely (e.g. Kalinji, Rema-Kalenga, northeast; and Dighinala, Pablakhali, Hazarikhil, Teknaf, southeast) and are unlikely to have any more individuals. Since they are isolated from other populations, they may be of value only for translocation projects (see Chapter 5). The likelihood of these populations surviving into the next 15 years is minimal (see Chapter 4). Other populations have not been surveyed adequately (e.g. Thanchi, Kudhukoza, Dopachari, Sangu, all in the southeast) and have large tracts of forestland with only small numbers recorded during brief visits. We believe that only a fraction of the population has been noted and the forest patches may harbor larger numbers (see Chapter 3).
We conclude that the total Bangladesh population in the current estimate is higher than that made in the nineties (around 200 individuals, Feeroz and Islam 1992). This could partly be a reflection of the number of sites covered, although Feeroz and Islam (1992) had previously covered a similar number of sites to estimate the population size. Many of the previously important sites (e.g. Horinchara, Chunati) are now devoid of hoolocks and this is cause for concern. The subsequent chapters will attempt to identify populations and habitats of importance and assess their future survival.
Table . Hoolock Gibbon (HG) populations recorded at 35 sites during the period of 2002-2005 (based on observed groups and calling groups)
| Sites | Days of counting | HG groups counted | HG individuals counted | HG groups calling | HG numbers callinga | Estimated number of groupsb | Estimated numbersc |
| Northeast (10 sites) | |||||||
| Baralekha | 9 | 3 | 10 | 3 | 10 | ||
| Lathitila | 2 | 1 | 5 | 2 | 4 | 5 | 9 |
| Shagarnal | 2 | 0 | 1 | 2 | 1 | 2 | |
| Gazipur Tea Estate | 6 | ||||||
| Lawachara NP Chautoli | 40 2 | 11 1 | 42 4 | 11 1 | 42 4 | ||
| Adampur | 13 | 8 | 21 | 8 | 21 | ||
| Horinchara | 6 | ||||||
| Rema-Kalenga WS | 8 | 2 | 2 | 2 | 2 | ||
| Satchari NP | 11 | 2 | 7 | 2 | 7 | ||
| Southeast (25 sites) | |||||||
| Dighinala | 7 | 1 | 2 | 1 | 2 | ||
| Pablakhali WS | 7 | 1 | 4 | 1 | 4 | ||
| Ramgar | 6 | ||||||
| Korerhat | 6 | ||||||
| Hazarikhil WS | 8 | 1 | 4 | 1 | 4 | ||
| Bishari | 2 | 2 | 8 | 2 | 8 | ||
| Bengdeba | 2 | 2 | 7 | 1 | 2 | 3 | 9 |
| Karnafuli (Kaptai NP) Rampahar (Kaptai NP) | 27 9 | 23 4 | 78 14 | 3 1 | 6 2 | 26 5 | 84 16 |
| Chunati WS | 11 | ||||||
| Satghar Fashiakhali | 6 6 | ||||||
| Bamu | 5 | 4 | 14 | 4 | 14 | ||
| Thanchi (Tindu mouza) | 2 | 2 | 4 | 1 | 2 | 3 | 6 |
| Khudhukhoza | 1 | 2 | 5 | 2 | 5 | ||
| Dopachari | 3 | 2 | 5 | 1 | 2 | 3 | 7 |
| Sangu | 1 | 1 | 2 | 1 | 2 | ||
| Alikadam | 2 | ||||||
| Rajghat | 1 | 1 | 2 | 2 | 2 | ||
| Bhomarighona | 8 | ||||||
| Himchari NP | 7 | ||||||
| Inani | 8 | 2 | 6 | 2 | 6 | ||
| Ukhia (Thankhali) | 9 | 5 | 14 | 5 | 14 | ||
| Teknaf GR | 6 | 1 | 2 | 2 | 2 | ||
| Upper Rezu | 1 | ||||||
| TOTAL | 250 | 80 | 258 | 12 | 24 | 96 | 282 |
a. number of HG groups calling X2 (individuals/group)
b. number of HG groups counted + number of HG groups calling.
c. number of HG individuals seen + estimated number of HG calling
Background
Habitat destruction is regarded as one of the key causes of hoolock population declines in Bangladesh and India (Islam et al. 2004). Key features of the habitat may disappear without necessarily reducing the area over which hoolocks can possibly live, effectively reducing the population. We identified two key features during the early part of this study, namely closed canopy structure and diversity of fruiting trees, which were critical to the existence of hoolocks. We postulated that the absence of either one of these would result in decline and disappearance of hoolocks from an area (Islam et al. 2004). The qualitative information available near the beginning of this study suggested that this was indeed the case. Subsequently, quantitative studies of the habitat structure were conducted to assess the validity of our previous assumptions based on qualitative studies.
Habitat quality across sites
Maps of each study site were collected from individual beat offices or acquired from the digitized map database available in the Forest Department, Ministry of Environment and Forest. These maps divide each site into i) natural forests, ii) plantations, iii) agricultural lands and iv) other uses (combined use of hydropower, forest village, etc.). We derived the list of all the species of plants and trees that hoolocks use for feeding (on leaves, shoots, fruits, flowers) from Feeroz et al. (1994), Feeroz and Islam (1992). In each study site, we recorded the total species richness of food-trees present, based on existing information and corroborated on the ground by field workers. We also ranked each study site (from 1-5) in relation to connectivity between plots (to provide information on the extent of closed canopy structure). This was done based on the maps available and each ranking incorporated artificial and man-made barriers (such as roads, monoculture plots, agricultural lands, villages) to estimate the extent of edge area in given forest patches. This would serve as a suitable surrogate for the assessment of closed canopy structure.
Once all the above variables were entered into a worksheet, we standardized the data to allow multivariate statistical analyses (McGarigal et al. 2000). Suitable data on all the variables were available on 21 of the 33 sites visited. We chose Principal Components Analysis (PCA) to assess the relative importance of each of the standardized variables described above to the number of hoolocks. We plotted the first two Principal Component scores against one another to look for trends in the relationships by site or region. Variables that were clearly very important (had high correlation with hoolock numbers) were then isolated and subjected to Linear Regression. Sample sizes (of sites) in some cases were higher than the 21 sites above, since only two or more variables were being compared. The alpha level was set to 0.05 for all tests.
Habitat characteristics in Lawachara and Kaptai
Since more time was spent in Lawachara and Kaptai (Karnafuli Range), additional data to assess tree density, tree size and species composition was collected. Following Ganzhorn 2003, we quantified tree density by using the Point-Quarter Sampling method (also called the Point-centered Quadrant Sampling). Here, individual points were randomly chosen. The distance of the centre of the tree nearest to the point in a direction northwest, northeast, southeast or southwest of the point was measured. A total of four trees in these four directions were therefore identified (to species when possible) and their diameters at breast height determined. Only trees with a DBH of more than 10 cm were considered. The mean distance (d) of the four trees was used to calculate the density using the formula: A/d2, where A=area (See Ganzhorn 2003 for details of the method). We randomly selected 86 such points in Lawachara and 206 points in Kaptai (a total of 1168 trees measured). The heights of the trees were also determined using an 8 m pole held against the tree. Tree height and DBH were compared between Lawachara and Kaptai using one way ANOVA to investigate differences in habitat structure. Relative Cover (dominance), relative frequency and relative density were calculated for each species to ascertain structure and composition of the habitat following Glover and Mitchell (2001). Principal components analyses (using all the tree species recorded in the point samples) were conducted to ascertain which of the three measures (relative cover, relative density or relative frequency) of the habitat contributed more towards the composition of tree species in the two areas.
Results
Habitat quality across sites
The Eigenvalues of the Principal Component Scores suggested that 66.4% of the variability in the data was explained by the first two Principal Component Scores. The loading plot of the variables with respect to the first two Principal Components clearly isolated tree species, the fragmentation index and the total extent of natural forest as being closely linked with hoolock numbers in the 21 sites in the analysis (Fig. 4.1). The plots of the Principal components grouped by site, tree species diversity and fragmentation ranking showed variable patterns (Fig 4.2). The number of food tree species was ranked from 0-5 (where 1=0 food-tree species; 2=1-3 food tree-species; 3=4-7 food-tree species; 4=15 or more food-tree species). Sites with high and medium food-tree species (ranked 4-5) clustered together but also overlapped with sites with poor food-tree species diversity (ranked 3, Fig 4.2A). The sites with little or no food-tree species (ranked 0-2) clustered together although some of these sites overlapped with sites with medium diversity of food-tree species (ranked 3), indicating similarities between sites with low to medium food-tree species diversity.
Grouping of the Principal components by sites ranked for fragmentation (1-4) showed that less fragmented sites (sites with greater extent of closed canopy, ranking 3 and 4) were clustered closer together compared to highly fragmented sites (less closed canopy, ranking 1-2, Fig 4.2B). Sites that were moderately fragmented (ranked 3) overlapped with both highly fragmented and less fragmented sites, showing that sites that were moderately fragmented were similar in other ways to more fragmented sites. Sites grouped by region (1=northeast and 2=southeast) showed that even though there was generally clustering among regions, there was some overlap, indicating similarities between sites from these distinct regions
Habitat characteristics in Lawachara and Kaptai
The overall tree density was higher in Kaptai (598.08/ha) compared to Lawachara (528.54 /ha). The height of trees in Lawachara was significantly lower than those in Kaptai (One Way ANOVA, df.=1167, F=37.49, P<0.001). This difference is also reflected in the frequency of different tree heights in the two areas (Fig. 4.4), with Kaptai showing a higher abundance of taller trees compared to Lawachara. The DBH of trees in Lawachara were also significantly lower than trees in Kaptai (One Way ANOVA, df.=1167, F=7.67, P=0.006). The relative density, relative cover and relative frequency values varied between species and between Lawachara and Kaptai (Table 4.1). A total of 25 species was identified in Lawachara in the 86 point samples (with 344 trees) taken, compared to the 32 species in the 206 point samples (with 824 trees) in Kaptai. The relative density, relative frequency and relative cover of Tectona grandis was higher in Kaptai compared to Lawachara, resulting in the highest importance values among all tree species in Kaptai. Even though Tectona grandis relative density was highest compared to other species in Lawachara, the relative frequency and relative cover of Artocarpus chaplasha scored the highest, making the importance value of this species greater than all other tree species in Lawachara. Dipterocarpus species were represented in high relative density, relative frequency and relative cover in Lawachara and Kaptai. However, Lagerstroemia speciosa had a higher importance value in Kaptai compared to Lawachara. Syzygium trees were of similar high importance in both areas, although the relative cover for the species was higher in Kaptai. Protium serratum occurred in higher relative density, relative cover and relative frequency in Kaptai. Tetrameles spp. were also of higher importance in Kaptai, although Ficus spp. scored higher in Lawachara. Principal components analysis showed that the greatest divergence in the habitat of Lawachara and Kaptai was due to relative cover, although differences in relative density and relative frequency were also evident.
Discussion
Habitat destruction is a particularly important cause of declines in the populations of primates including gibbons worldwide (Ganzhorn 2003, Setchell and Curtis 2003). With habitats facing continuous threats from surrounding human populations, conservation becomes a very difficult task. Habitat is composed of a variety of interlinked characteristics that can be measured, but finding out which factors are important remains a challenge.
Habitat quality across sites
Factors such as abundance of natural forests, plantations and agricultural lands were seemingly not related to hoolock numbers. This seemed odd because it may be expected that natural forests would have some important food-tree species that are so critical. Incidentally, the category referred to as natural forests in the Forest Department´s database is actually very vague and includes shrub vegetation, open patches, and other kinds of habitat that were originally “natural forests” but have become modified over the years. These areas have not undergone replanting efforts and are still categorized as natural forests causing confusion in terminology (Kabir and Muzaffar 2002). The category referred to as plantations also suffers from similar problems. Plantations do not just refer to monocultures and may well contain a very diverse, mixed secondary forest (as is seen in Lawachara National Park). These problems in categorization led to no clear, consistent pattern in the relationship between plantations, natural forests and hoolock numbers.
This study was able to relate two important habitat characteristics to hoolock abundance. The link between food-tree species richness was suspected but never quantified and analyzed as such (Fig 4.3A). Similarly, the availability of closed canopy structure, quantified as the extent of fragmentation in a given site, was also linked to hoolock numbers (Fig. 4.3B). This establishes two important needs of hoolocks, which are essential in their habitats if they are to persist in the long run. Additionally, this helps us rapidly assess potential hoolock habitat quality by measuring these two variables that are relatively easy to measure, given that manpower and expertise are both limited for wildlife conservation studies. We will discuss this further in the context of conservation management.
Habitat characteristics in Lawachara and Kaptai
Both Lawachara and Kaptai had a high diversity of tree species documented by the point-centered quadrat data, although clearly, each area varied with respect to the composition of tree species (Table 4.1). Tectona grandis was by far the dominant of the tree species in Kaptai. This is understandable, since Tectona grandis is one of the prime timber species, particularly in the southeastern regions of Bangladesh (Gain 2002). Tectona grandis leaves or flowers are not eaten by hoolocks, although hoolocks occasionally venture into Tectona grandis stands, to feed on moth larvae Hyblea purea (Teak Skeletonizer) occurring on the bark. A variety of food species for hoolocks including Artocarpus chapalasha, Bixa orellana, Dipterocarpus spp., Syzygium spp., Mangifera sylvatica, Protium serratum, Entada spp., Ficus spp. and Lagersrtoemia speciosa were represented in the point samples from both sites. The relative frequency and relative cover of Artocarpus chaplasha was the highest in Lawachara and and among the top three important species in Kaptai. This species is an important source of food for hoolocks and their higher representation in the habitat is of great significance to hoolock persistence in degraded areas (Ahsan 1994, Ahsan 2001, Hasan 2003). Dipterocarpus was better represented in Lawachara with much higher relative cover compared to Kaptai. Trees such as Syzygium were of similar importance in both the sites.
The importance values, which are a composite of relative density, relative frequency and relative cover are more strongly influenced by the former two measures. The importance of certain species in the composition of the species is elevated due to higher frequency and density, in spite of lower cover (e.g. smaller size). The food species represented in point quarter samples show that many species are present in high densities and frequencies, but constitute a smaller proportion of the cover of the forest. Trees with high frequencies and densities and low cover indicate smaller size. This suggests that many tree species, evidently of importance to hoolocks, are common in both Lawachara and Kaptai, but are in various early stages of regeneration compared to more commercially important species. Trees in Kaptai were better distributed with respect to size compared to Lawachara (Fig. 4.4). There was also a greater percentage of larger trees based on DBH and height indicating the overall better-quality habitat compared to Lawachara. These trees will be of great significance to hoolocks as they become older and extra attempts have to be made to protect this diversity of fruiting trees in both areas. Additionally, timber trees of commercial value that are old enough to be logged should be replaced by new batches of a combination of the such food species, in order to maintain and even enhance this diversity. Chapter 5 discusses restoration of forests further.
Table . Comparison of the relative density (RD), relative cover (RC) and relative frequency (RF) of tree species in Kaptai NP (Karnafuli Range) and Lawachara NP
| Species | Karnafuli | Lawachara | ||||||
| RD | RC | RF | IV | RD | RC | RF | IV | |
| Mangifera sylvatica | 1.33 | 2.99 | 2.69 | 7.01 | 0.28 | 0.23 | 0.73 | 1.24 |
| Mangifera sp. | 0.28 | 0.25 | 0.73 | 1.26 | ||||
| Holigarna caustica | 0.48 | 0.22 | 1.19 | 1.89 | 0.28 | 0.01 | 0.73 | 1.02 |
| Bixa orellana | 1.21 | 0.36 | 2.39 | 3.96 | 0.28 | 0.03 | 0.73 | 1.04 |
| Bombax ceiba | 0.12 | 0.33 | 0.29 | 0.74 | 0.28 | 1.47 | 0.73 | 2.48 |
| Protium serrratum | 3.51 | 3.73 | 6.89 | 14.13 | 1.45 | 1.29 | 3.70 | 6.44 |
| Terminalia belerica | 0.24 | 0.92 | 0.59 | 1.75 | ||||
| Terminalia chebula | 0.12 | 0.22 | 0.29 | 0.63 | ||||
| Dillenia indica | 0.60 | 0.85 | 1.19 | 2.64 | ||||
| Dipterocarpus sp. | 8.37 | 7.07 | 10.00 | 25.44 | 10.17 | 11.10 | 14.08 | 35.35 |
| Hopea odorata | 0.48 | 0.54 | 0.89 | 1.91 | 0.00 | |||
| Macaranga denticulata | 0.84 | 0.24 | 1.79 | 2.87 | 2.03 | 0.15 | 5.18 | 7.36 |
| Albizia chinensis | 0.24 | 0.04 | 0.59 | 0.87 | ||||
| Albizia procera | 0.12 | 0.02 | 0.29 | 0.43 | 0.28 | 0.48 | 0.73 | 1.49 |
| Entada sp. | 0.48 | 0.11 | 1.19 | 1.78 | ||||
| Saraca indica | 0.12 | 0.02 | 0.29 | 0.43 | ||||
| Xylia dolabriformiis | 2.30 | 1.71 | 2.39 | 6.40 | 0.58 | 2.20 | 0.73 | 3.51 |
| Lagerstroemia speciosa | 3.76 | 6.12 | 8.09 | 17.97 | 3.48 | 3.21 | 5.18 | 11.87 |
| Michelia champaca | 0.60 | 1.12 | 1.49 | 3.21 | 1.74 | 0.34 | 2.96 | 5.04 |
| Swietenia mahagoni | 1.57 | 3.40 | 2.39 | 7.36 | 0.28 | 0.67 | 0.73 | 1.68 |
| Artocarpus chaplasha | 2.54 | 10.70 | 5.39 | 18.63 | 10.17 | 29.04 | 17.78 | 56.99 |
| Artocarpus lakoocha | 0.12 | 0.51 | 0.29 | 0.92 | 0.58 | 0.77 | 0.73 | 2.08 |
| Ficus lacor | 0.28 | 4.16 | 0.73 | 5.17 | ||||
| Ficus sp. | 1.21 | 2.88 | 2.39 | 6.48 | 1.45 | 5.57 | 3.70 | 10.72 |
| Gmelina arborea | 1.09 | 1.35 | 2.69 | 5.13 | 2.32 | 3.19 | 4.44 | 9.95 |
| Syzygium sp. | 4.12 | 6.44 | 9.89 | 20.45 | 4.65 | 3.32 | 9.63 | 17.60 |
| Garuga pinnata | 0.60 | 0.49 | 1.49 | 2.58 | 1.74 | 5.39 | 3.70 | 10.83 |
| Litchi sp. | 0.12 | 0.04 | 0.29 | 0.45 | ||||
| Duabanga grandiflora | 0.48 | 0.87 | 1.19 | 2.54 | ||||
| Tetrameles sp. | 0.72 | 4.61 | 1.79 | 7.12 | ||||
| Sterculia villosa | 0.12 | 0.02 | 0.29 | 0.43 | ||||
| Grewia microcos | 2.42 | 1.17 | 3.89 | 7.48 | 2.90 | 1.87 | 4.44 | 9.21 |
| Tectona grandis | 20.50 | 39.35 | 25.18 | 85.03 | 10.75 | 24.34 | 14.82 | 49.51 |
| Anthocephalus chinensis | 0.12 | 0.54 | 0.29 | 0.95 | 0.58 | 0.30 | 1.47 | 2.35 |
Swertia chirata | 0.28 | 0.32 | 0.73 | 1.33 | ||||
| Acanthus illicifolius | 0.28 | 0.15 | 0.73 | 1.16 | ||||
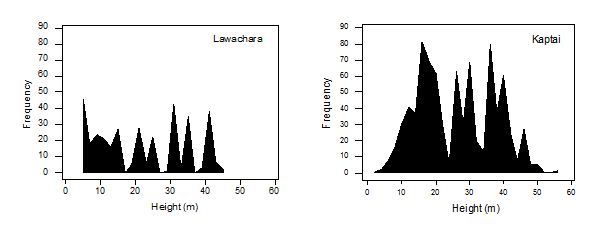
Fig. . Frequency of trees of different heights in Lawachara and Kaptai.
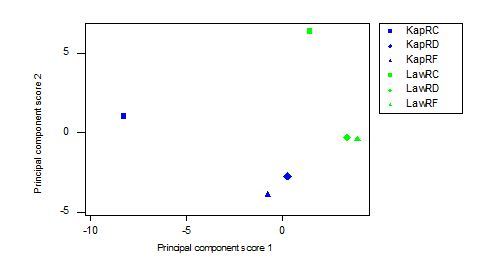
Fig.Principal component scores of relative frequency, relative density and relative cover of tree species (all species in point quadrant samples) in Lawachara and Kaptai.
Population Viability Analysis
The long-term survival of wildlife is key to conservation efforts directed towards specific aspects of the life histories of the species concerned (Preuschoft et al.1984, Chivers 2001, Alberts and Altmann 2003). Attaining long-term life history data however has been traditionally difficult and this has hampered our understanding of life history strategies of long-lived wildlife, in general, and primates in particular. There has been a recent trend in using demographic population models to assess the viability of populations of a variety of wildlife including primates (Dobson and Lyles 1989, Alberts and Altmann 2003). Population viability analysis is an aspect of population modeling that allows us to predict the future of populations of animals given existing conditions and threats (Alberts and Altmann 2003). Additionally, it allows us to conduct an assessment of the different factors that affect population parameters, thereby helping us to weigh out conservation efforts and direct them in a manner that would help protect species from further declines. This latter component (referred to as sensitivity analysis) is of great importance to conservation given the limited data on the life histories of many long-lives primate species. The importance of this is illustrated in the population modeling and conservation of Javan Gibbons and the role of multidisciplinary approaches to conservation is recognized (IUCN/SSC 1994, Asquith 2001).
Very limited long-term data exists on the groups of Hoolock Gibbons (e.g. Choudhury 1990, Islam et al. 2004) and a Population and Habitat Viability Analysis workshop was organized in Dhaka to bring together a large number of hoolock specialists. The group discussed and agreed upon the best approximation on demographic parameters of hoolocks to help run viability models. This approach has been used for other endangered primates with great success (e.g. Orangutan PHVA, Singleton et al. 2004). The objective was to determine the viability of existing hoolock populations in Bangladesh so that conservation efforts could be focused on populations most likely to survive. The workshop culminated in the publication of a report that outlines the overview of the findings (Molur et al. 2005). We built further on the model to incorporate parameters not included by Molur et al. (2005).
Methods and Materials
The software package Vortex Version 9.57 was used to run population viability models (Lacy 1993) of hoolock populations in Bangladesh. The package allows the user to specify parameters, which we have enlisted in Table 5.1. The PHVA workshop (Molur et al. 2005) ran a baseline model using similar parameter values. Based on this baseline model, we further fine-tuned the population viability of hoolocks in Bangladesh. We simulated all the known populations of hoolocks (with more than 10 individuals) in Bangladesh using primarily the parameters obtained from Molur et al. 2005. We assumed an effect of inbreeding (built into the model) and assumed two catastrophes that may possibly occur in a given year (tropical storms and unspecified diseases). The role of good quality habitat has already been established (Chapter 4) and we modeled the effect of increased habitat by increasing the carrying capacity in relation to the actual amount of habitat present in each population. Simulations on populations with less than 15 individuals indicate dramatically high extinction probabilities (Molur et al. 2005), but we included populations with 10 individuals nevertheless to assess the role of mitigation measures (such as increased habitat). Additionally, we added individuals (supplementation in Vortex) to simulate translocation of individuals into populations deemed to have some good habitat but with potential for improvement by restoration. We individually conducted sensitivity analyses on these populations by varying inbreeding depression and catastrophic events. Additionally, we varied adult mortality, fecundity and juvenile mortality since the changes in these parameters are expected to make changes in the model. We also modeled 0.5% reduction in carrying capacity annually to portray the realistic rates of habitat decline in Bangladesh. A conservative approach to modeling populations of hoolocks was taken by keeping adult mortality high (3%) since this has been deemed to be an important determinant of model stability (Molur et al. 2005).
Results
Decreasing the amount of habitat
Decreasing the carrying capacity by 0.5% had the effect of reducing populations to very low levels making them very susceptible to extinction. When annual adult mortality was held at 1%, populations greater than 15 individuals were more stable but would be expected to gradually decline (Fig. 5.1A), although populations such as Lawachara and Kaptai are expected to have a very low probability of extinction even after 100 years of simulation. When these same populations were modeled using increased mortality in adults (3%) all populations were seen to decline (Fig. 5.1B) although the probability of becoming extinct in 100 years was much higher in the populations that had less than 15 individuals (Bamu and Ukhia) (Fig. 5.1C and 5.1D).
Increasing the amount of habitat
Increasing the amount of habitat caused a gradual rise in populations that were greater than 14 individuals (Fig. 5.2). Populations that were smaller than 14 individuals were modeled separately and in most populations, just increasing carrying capacity did not improve the numbers of hoolocks (Fig. 5.3A, 5.3B). Rather, the populations showed very high fluctuations in numbers, particularly when mortality was set at 3%.
Increasing habitat and translocation of individuals
Simulation of translocation of individuals in conjunction with a restoration plan to increase habitat (i.e. carrying capacity) showed that populations with individuals less than 15 individuals could be effectively improved by adding 4 individuals once every 2 years (Fig. 5. 4). Populations with an assumed 1% adult mortality showed consistent increases and stability, provided the addition of individuals resulted in a population size of well over 20 individuals. Populations such as Hazarikhil, although stable did not continue to rise in numbers (Fig. 5.4A). When mortality was assumed to be 3%, populations such as Baralekha, Satchari, Hazarikhil and Pablakhali did not exceed 20 individuals during the years in which the addition of individuals were modeled. These populations remained small subsequent to the addition of individuals and retained a high probability of extinction whereas others improved (Fig. 5.4C).
Removal of individuals from populations
Kaptai and Lawachara populations were modeled to simulate removal of individuals. Both populations showed recovery after four individuals (2 adult females and 2 adult males) were removed from each population between years 3 and 12 and years 3 and 9 of simulation (Fig. 5.5). Each population showed a decline following the removal, but since populations did not diminish to less than 20 individuals, they recovered to original levels.
Discussion
Population modeling is a useful and insightful technique that is widely used in conservation biology of a wide variety of species (Dobson and Lyles 1989, Asquith 2001, Alberts and Altmann 2003). Molur et al. (2005) produced the baseline set of simulations to allow further exploration of population modeling in hoolocks. Our results provide some clear directions for improving and sustaining the remainder of the hoolock populations in Bangladesh.
Declining habitat
Habitat destruction is by far the most-cited cause of the decline of gibbon populations world-wide (Preuschoft et al. 1984, Chivers 2001). The simulation of hoolock populations with declining carrying capacity showed that a 0.5% decline could gradually result in the extinction of populations. The largest populations in Bangladesh (Kaptai and Lawachara) would also undergo declines, although at such rates of decline, the populations will still be safe in 100 years. All other populations, however, are expected to have higher and higher extinction probabilities by as early as 20-30 years. Clearly, habitat destruction has to be halted if populations of hoolocks are to survive.
Increasing habitat
Increasing carrying capacity only had a positive effect on populations with much greater than 20 individuals. Molur et al. (2005) suggested that 15 individuals may be the critical number below which populations are doomed. We modeled inbreeding and the effect of catastrophes and this had an added toll on populations. Even populations such as Bamu and Ukhia (14 individuals each) did not improve significantly over 100 years of simulated increase in carrying capacity (Fig. 5.3A). Moreover, with 3% adult mortality, populations less than 14 individuals showed rapid fluctuations and exhibited high rates of extinction (Fig. 5.3B and C). Just protecting and increasing the extent of habitat can therefore not be deemed suitable for the viability of populations of hoolocks with less than 14 individuals.
Increasing habitat and addition of individuals
Habitat increase in conjunction with addition of individuals seemed to have the most powerful effect on the long-term viability of hoolock populations. With 1% adult mortality, all the 14 populations showed increases in numbers and relative stability (Fig. 5.4A). The populations with barely above 20 individuals (e.g. Hazarikhil) did not consistent increases, showing that lowered populations may experience a bottleneck from which they cannot recover with any degree of ease. Increasing adult mortality to 3% further illustrated this phenomenon, with populations such as Satchari, Baralekha, Hazarikhil and Pablakhali not increasing to levels greater than 20 (even after additions) (Fig. 5.4B). These populations, increased slightly after the additions, but quickly diminished to original levels and maintained high extinction probabilities (Fig. 5.4C). Other populations (Inani, Ukhia, Dopachari, etc.), however, showed remarkable improvements in the extinction probabilities as a consequence of increase in carrying capacity and addition of individuals.
Effect of removal of individuals
Supplementing small populations with a supply of individuals would require removal from large populations. The only two populations that could possibly be used for this purpose are Kaptai and Lawachara. Simulations showed that both populations could recover if individuals were removed in a carefully planned manner, even under conditions of 3% adult mortality.
Summary
This chapter illustrates the power of population modeling in assessing and strategizing conservation priorities for the Hoolock Gibbons in Bangladesh. The results of these simulations, although based on the best available data on hoolocks (e.g. Molur et al. 2005), are nevertheless inaccurate, since long term demographic data on hoolocks are non existent. In spite of these shortcomings, the simulations confirm some intuitive problems of population decline in hoolocks. Additionally, increasing habitat and addition of new individuals seems to be the only workable management option that could help sustain the last hoolocks of Bangladesh. The final chapter will explores this aspect by looking into specific management initiatives, based on the condition of population concerned, the extent of habitat and the geopolitical reality of such interventions.
Table . Demographic input parameters to run models using Vortex for the Hoolock Gibbon in Bangladesh (modified from Molur et al. 2005)
Model Input Parameter | Baseline values |
Breeding system | Long-term monogamy |
Age of first reproduction | 8/10 years |
Maximum age of reproduction | 30 years |
Inbreeding Depression | Yes |
Annual % adult females reproducing (SD) | 33 (4) |
Overall offspring sex ratio | 0.5 |
Adult males in breeding pool | 100% |
% annual mortality | |
0-3 years | 18 (3) |
3-6 years | 9 (2) |
6+ years | 3 (1) |
Catastrophe | tropical storm and/or disease |
Annual frequency of occurrence | 5-10% |
Severity: Reproduction | 0 |
Severity: Survival | 0.75 |
Initial Population size | variable |
Carrying capacity (K) | variable |
Conservation and Management
Introduction
Hoolock Gibbons are globally endangered and their status and distribution in Myanmar and southern China are currently unclear (Haimoff et al. 1987). Total counts of this species in India is slightly larger than 2600 individuals scattered across the states of Arunachal Pradesh, Assam, Meghalaya, Mizoram and Tripura (Das et al. 2003). The hoolocks in Bangladesh are considerably smaller in numbers, with at least 282 individuals in 35 sites (Chapter 3, Table 3.1). Further, another 15 sites within the northeastern and southeastern regions have been identified that may have additional hoolocks (Molur et al. 2005). Hoolock gibbons in Bangladesh can thus be regarded as being in a crisis situation and their conservation will require carefully planned management of populations, protection of habitats, management of people and their activities, legislation and its enforcement and the training of manpower to implement key actions. One thing however is disturbingly clear: hoolock gibbons will not survive into the next two decades without a well-coordinated set of actions over a period of several decades. This chapter summarizes key actions necessary to conserve the last hoolocks in Bangladesh in light of our findings and the recommendations of the Hoolock Gibbon Population and Habit Viability Assessment workshop (Molur et al. 2005).
Government Will
The management of forestlands in Bangladesh has traditionally been with the objective of generating revenue. The Forest Department of the Ministry of Environment and Forest continue to practice this brand of forestry. Corruption and greed have infiltrated into the department and most reserved forests are seriously degraded (Gain 1998, Gain 2001, Gain 2002, Kabir and Muzaffar 2002). Since forestry practices are directed towards revenue generation concerns associated with wildlife and biodiversity conservation have been of limited interest (Molur et al. 2005). This has been critical in the decline of wildlife populations in general, and hoolock populations in particular.
The government of Bangladesh is a signatory to the Convention on Biological Diversity (CBD) and the Ramsar Convention. Whereas major steps have not been taken to fulfill the criteria of these conventions, some steps, such as inventorying and reviewing the existing animal and plant species (and the threats to their existence) of many areas in Bangladesh has begun (e.g. NCSIP-1, 2001a, 2001b, IUCN 2000). The recognition by the government of the importance of the conservation of wildlife and biodiversity will be crucial in saving the last of the wild animals of Bangladesh.
The need for protected areas has been well recognized only in paper. Management of protected areas continues to be poor and large-scale degradation and destruction of habitat has occurred even after designation of areas as protected (Kabir and Muzaffar 2002). The widely cited reason for not being able to protect habitat is illegal felling and acute population pressure. Whereas these are important causes of forest declines in Bangladesh, the greater problem lies in the short-term monetary motives of the government that have resulted in clear-cutting of areas without consideration of the consequences (Gain 2002).
The government’s attitude towards the remaining forest patches needs to change. Currently, the revenue-generating forestry practices need to be replaced by an ecosystem-friendly forestry that supports people and life. The first step towards such a change is to develop more protected areas to at least bring them under some sort of legislation. Public outcry and international pressure to comply with the bindings of the various conventions has already started to have an effect on how the government approaches these issues (NCSIP-1 2001a, 2001b). Continued pressure and conservation goals centered on keystone species such as the hoolock is likely to improve the conditions currently faced in these forest lands.
Habitat improvement
To support hoolocks in Bangladesh, there is an acute need for appropriate habitat. Hoolock populations have become extinct from apparently large areas (e.g. Horinchara, Chunati) over the last 15 years (Molur et al. 2005). In tandem with an attitude change in the government, there is a need to improve the habitat by planting diverse tree species (with a suitable combination of food trees, Chapter 4). Currently, habitat improvement efforts should focus on 3 areas in the northeast (Satchari, Baralekha, Adampur) and 5 areas in the southeast (Bamu, Bishari, Bengdepa, Inani and Ukhia). Each of these sites has relatively large areas and planned planting efforts could substantially improve their quality for hoolock conservation. Important tree species such as Artocarpus spp. and Ficus spp. planted across all these sites could be of use in the long-term. Additionally, we suggest the tagging of all fruiting and roosting trees in these sites to get a quantitative idea of tree diversity in these areas. The improvement of habitat will go in conjunction with hoolock translocation.
Translocation of populations
Many populations of hoolocks in Bangladesh today are likely to become extinct simply because of their small size (e.g., Dighinala, and others, Chapter 5). The translocation of such populations to areas that not only have relatively better hoolock numbers, but also have more diverse tree species, is an action worth the attempt. Based on the population viability of all populations, we can suggest the translocation of individuals from Rema Kalenga and Shagarnal (and possibly Lathitila) into Satchari, a recently declared national park in the northeast. Satchari is also an attraction for bird watchers and nature lovers and is therefore illegal activities in the area do not go unnoticed. In the southeastern region, we suggest the translocation of 2 individuals from Dighinala and 2 individuals from Thanchi into Bamu (currently with 14 individuals). Additionally, the 2 individuals from Sangu should be translocated into Ukhia (currently with 14 individuals). Each of the translocations should be monitored to determine successes and failures. Wild-captured hoolocks, if translocated quickly, are likely to adjust to the new habitat at a quicker rate compared to individuals re-introduced after prolonged captivity. If these translocations are successful, then populations such as Kaptai (Karnafuli) may be tapped for removal of more individuals over a course of 10 or more years to facilitate translocations into medium-sized populations.
Public Awareness
Bangladesh is a poverty-stricken country with innumerable problems. Basic sustenance is at stake in many parts of Bangladesh and the existing large populations exert a very large pressure on shrinking natural resources (Gain 2002). Under these circumstances, wildlife conservation is exceedingly difficult since it ranks low in priority to the most village communities. This project showed that people living in and around protected areas can be made to understand that the presence of certain wildlife species, such as hoolock gibbons, may indicate good quality habitat. The importance of these and other species may have been well known to the older community members, but current generations have greater problems to deal with. Yet, with simple steps, such as the erection of a billboard in Lawachara and the distribution of T-shirts and posters have been important in raising the awareness not only in local people, but also in Forest Department officials. Training and capacity building of the Forest Department officials is paramount to conservation of wildlife and a long-term plan to develop the Forest Department is in order. We hope to develop this by training of FD so that they can themselves take charge of increasing public awareness in protected or other forest lands. Our Manual of Hoolock Gibbon Conservation will be an integral part of this training program. Additionally, we hope to provide training courses incorporating information on hoolock and other wildlife into hands-on teaching of techniques. The conservation of hoolocks ultimately lies in the hands of the Forest Department and the people that live off the forest.
Conclusion
Hoolock populations may be viable in the long run in Bangladesh provided measures are taken to protect and improve their existing habitats. Additionally, removal of individuals from genetically compromised populations will be necessary to boost other near-viable populations. The support of the Forest Department is necessary for the long-term success of these actions. In order to do that, training and capacity building should be initiated within the Forest Department, in conjunction with public awareness campaigns that highlight the importance of wildlife species such as hoolocks.