
INTRODUCTION
1.1 GENERAL
As Bangladesh is located in a tectonically active much of the country and Significant damaging historical earthquakes have occurred in and around Bangladesh. For seismic lateral force may be calculated by two methods, namely, Equivalent Static Force Method and Dynamic Analysis. In Bangladesh, the number of high rise building is increasing day by day. For seismic lateral force calculation, Equivalent Static Force Method is most commonly used because of its simplification. But Equivalent Static Force Method is applicable for regular building with moderate height. For tall building or irregular structure, as the Code prescribed (BNBC), it is better to perform dynamic analysis. For all seismic regular structure it is necessary to perform a static analysis. Dynamic analysis is required in irregular cases and may be carried out in the form of a Time history analysis. Equivalent static force method is an empirical formula dependent on the height of the structure and also evaluates the height wise distribution of storey forces. The lateral forces in terms of the base shear and the static analysis of the structure for these forces provide the base shears. This method is used for calculation of seismic lateral forces for all structures. Ground motion time history developed for the specific site shall be representative of actual motions for the direction under consideration. Time history analysis is a step by step method of the dynamic response of a structure to a specified loading that may vary with time. The analysis may be linear or nonlinear. Time history analysis is used to determine the dynamic response of a structure to arbitrary loading. Now-a-days, different type of software is used to both static and dynamic analyses which help to perform easy analysis of the structure.
1.2 OBJECTIVE OF THE THESIS
The objectives of this study are:-
- To study the Equivalent Static Force Method and Time History Analysis in light of BNBC and check their incorporation of ETABS software.
- To perform a comparative study of the Equivalent Static Force Method and Time History Analyses regular and irregular buildings.
- To study the effect of partition walls in generating base shear distribution.
With the successful completion of objectives it will be possible to propose confirm the adequacy of Equivalent Static Force Method as regular as well as irregular building. At the same time it will be helpful for the designer in modeling of a building in ETABS using Equivalent Static Force Method and Time History Analysis incorporating the effect of partition wall.
1.3 contents of the thesis
This thesis is demonstrated in five chapters. They are as follows:
- Chapter one named Introduction, give some general idea of about the topic of thesis, and also the objectives of the thesis.
- Chapter two named Literature Review, present in detail the Equivalent Static Force Method and Time History Analysis and other parameter associated with the topic.
- In Chapter three analyses and comparative study by Equivalent Static Force Method and Time History Analysis (Bare frame)
- In Chapter four analyses and comparative study by Equivalent Static Force Method and Time History Analysis (with partition wall.)
- In Chapter five conclusions has been drawn with findings, limitations and recommendations.
2.1 INTRODUCTION
Earthquake forces and their effects on structural elements shall be determined by using either a static analysis method or dynamic analysis method. The behavior of a building during earthquakes depends critically on its overall shape, size and geometry, in addition to how the earthquake forces are carried to the ground. Ground vibration during earthquakes causes forces and deformations in structure. Equivalent static force method is an empirical formula dependent on the height of the structure and evaluates the storey shear. Time history analysis is a procedure to analyze the response of structure subjected to different prescribed motion at its various support. Recorded earth quake time histories or records constitute the most fundamental information for earthquake resistant design. All seismic design provisions, in one way or another, are ultimately justified or rejected on the basis of the general characteristics observed in or interpreted from earthquake records. The most useful application of time histories is in verification of seismic performance buildings designed using more simple procedure.
2. 2 THE EARTHQUAKE
2. 2.1 CAUSES OF EARTHQUAKE
Long time ago, a large collection of material masses coalesced to form the earth. Large amount of heat was generated by this fusion, and slowly as the earth cooled down, the heavier and denser materials sank to the center and lighter ones rose to the top. The differentiated earth consists of the inner core (radius~1290Km), the outer core (thickness~2900Km) and the crust (thichkness~5 to 40Km).The outer core is liquid in the form and the mantle has the ability to flow. The convective flows of mantle material cause the crust and some portion of the mantle, to slide on the hot molten outer core. The sliding of earth’s mass takes place in pieces called tectonic plates. There are three type of inter plate interactions are the convergent, divergent and transform boundaries
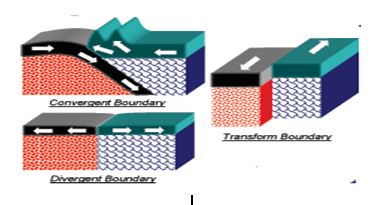
Fig. 2.1: Type of inter plate boundaries (Adopted from C.V.R.Murty, 2002)
Rocks are made of elastic material, and so elastic strain energy is stored in them during the deformations that occur due to the gigantic tectonic plate actions that occur in the earth. But the material contained in rocks is also very brittle. Thus, when the rocks along a weak region in the earth’s crust reach their strength, a sudden movement takes place there opposite sides of the fault suddenly slip and release the large elastic strain energy stored in the interface rocks.
The sudden slip at the fault causes the earthquake. A violent shaking of the earth when large elastic strain energy released spreads out through seismic waves that travels through the body along the surface of the earth. Most earthquakes in the word occur along the boundaries of the tectonic plates.
2.2.2 MAGNITUDES VERSUS INTENSITY IN SEISMIC DESIGN.
The point on the fault where slip starts is the focus or hypocenter, and the point vertically above this on the surface of the earth is the epicenter (Fig 2.3). The depth of focus from the epicenter, called as focal depth, is an important parameter in determining the damaging potential of an earthquake.
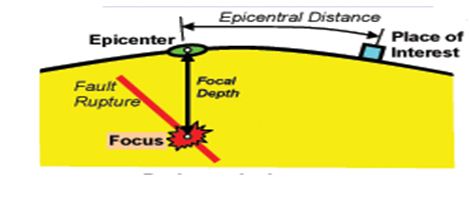
Fig.: Basic terminology (Adopted from C.V.R.Murty, 2002)
Magnitude is a quantities measure of the actual of the earthquake. Intensity is a qualities measure of the actual shaking at a location during an earthquake. Magnitude of an earthquake is a measure of its size. For instance, one can measure the size of an earthquake by the amount of strain energy released by the fault rupture. On the other hand, intensity is an indicator of the severity of shaking is generated at a given location. Clearly, the severity of the shaking is much higher near the epicenter. Earthquake causes different shaking at different locations is different. Thus indeed it is particular level of intensity of shaking that buildings and structures are design to resist, and not so much the magnitude. The peak ground acceleration (PGA), maximum acceleration experience by the ground during shaking, is one way of quantifying the severity of the ground shaking. Strong ground motion records from seismic instruments are relied upon to quantify destructive ground shaking. Based on data from past earthquake provided an approximate correlation between the local magnitude ML of an earthquake with the intensity I0 sustained in theepicenter area as: ML ≈2/3 I0 +1.
2. 2. 3 seismic EFFECTS on structure
Earthquake causes shaking of ground. So a building resting on it will experience motion at its base. Even though the base of the building moves with the ground, the roof has tendency to stay in its original position. The tendency to continue to remain in the previous position is known as inertia. In the building, since the walls or columns are flexible, the motion of the roof is different from that ground.
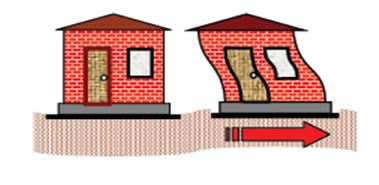
Fig. : Effect of inertia in a building when shaken at its base (Adopted from C.V.R.Murty)
When the ground moves, even the building thrown backwards, and the roof experiences a force called inertia force. The inertia force experiences by the roof are transferred to the ground via columns, causing force in columns. During earthquake shaking, the columns undergo relative movement between their ends. In the straight vertical position, the columns carry no horizontal earthquake forces through them. The larger is the relative horizontal displacement u between the top and bottom of the column, the larger internal forces in column. These internal forces in the column are called stiffness force.
Under horizontal shaking of the ground, horizontal inertia forces are generated at level of the mass of the structure. These lateral inertia forces are transformed by the floor slab to the walls or columns, to the foundations, and finally to the soil system underneath (Fig 2.6). Each of this structural element and the connections must be designed to safely transfer these inertia forces through them. Walls and columns are the most critical elements in transferring the inertia forces.
2. 2. 4 Effects of Architectural Features on Buildings during Earthquake
The behavior of a building during earthquakes depends critically on its overall shape, size and geometry, in addition to how the earthquake forces are carried to the ground. A desire to create an aesthetic and functionally efficient structure drives architects to conceive wonderful and imaginative structures. In tall buildings with large height-to-base size ratio (Figure 2.7a), the horizontal movement of the floors during ground shaking is large. In short but very long buildings (Figure 2.7b), the damaging effects during earthquake shaking are many. And, in buildings with large plan area like warehouses (Figure 2.7c), the horizontal seismic forces can be excessive to be carried by columns and walls.
The earthquake forces developed at different floor levels in a building need to be brought down along the height to the ground by the shortest path; any deviation or discontinuity in this load transfer path results in poor performance of the building. Buildings with vertical setbacks (like the hotel buildings with a few storey wider than the rest) cause a sudden jump in earthquake forces at the level of discontinuity (Figure2.8 a). Buildings that have fewer columns or walls in a particular storey or with unusually tall storey (Figure2.8b) tend to damage or collapse which is initiated in that storey. Buildings on sloppy ground have unequal height columns along the slope, which causes ill effects like twisting and damage in shorter columns (Figure 2.8c).Buildings with columns that hang or float on beams at an intermediate storey and do not go all the way to the foundation, have discontinuities in the load transfer path (Figure 2.8d). Some buildings have reinforced concrete walls to carry the earthquake loads to the foundation. Buildings, in which these walls do not go all the way to the ground but stop at an upper level, are liable to get severely damaged during earthquakes.
2.2.5 TWIST of Building during Earthquake
Buildings vibrate back and forth during earthquakes. Buildings with more than one storey are like rope swings with more than one cradle. a building with identical vertical members and that are uniformly placed in the two horizontal directions, when shaken at its base in a certain direction, swings back and forth such that all points on the floor move horizontally by the same amount in the direction in which it is shaken.
If the mass on the floor of a building is more on one side (for instance, one side of a building may have a storage or a library), then that side of the building moves more under ground movement. This building moves such that its floors displace horizontally as well as rotate. Buildings that are irregular shapes in plan tend to twist under earthquake shaking. For example, in a propped overhanging building (Figure 2.10), the overhanging portion swings on the relatively slender columns under it. The floors twist and displace horizontally.
Twist in buildings, called torsion by engineers, makes different portions at the same floor level to move horizontally by different amounts. This induces more damage in the columns and walls on the side that moves more . Many buildings have been severely affected by this excessive torsion behavior during past earthquakes. It is best to minimize (if not completely avoid) this twist by ensuring that buildings have symmetry in plan (i.e., uniformly distributed mass and uniformly placed vertical members). If this twist cannot be avoided, special calculations need to be done to account for this additional shear forces in the design of buildings;
2.2.6 Improving Ductility of Buildings for Good Seismic Performance
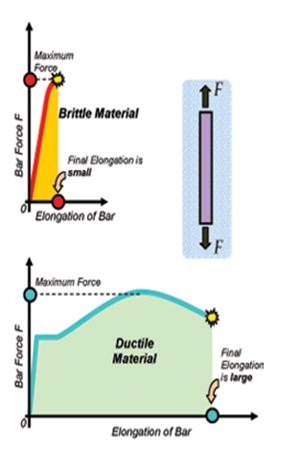
Let us take two bars of same length and cross sectional area – one made of a ductile material and another of a brittle material. Now, pull these two bars until they break. You will notice that the ductile bar elongates by a large amount before it breaks, while the brittle bar breaks suddenly on reaching its maximum strength at a relatively small elongation (Figure 2.12). Amongst the materials used in building construction, steel is ductile, while masonry and concrete are brittle.
Buildings should be designed like the ductile chain. For example, consider the common urban residential apartment construction – the multi-storey building made of reinforced concrete. It consists of horizontal and vertical members, namely beams and columns. The seismic inertia forces generated at its floor levels are transferred through the various beams and columns to the ground. The correct building components need to be made ductile. The failure of a column can affect the stability of the whole building, but the failure of a beam causes localized effect. Therefore, it is better to make beams to be the ductile weak links than columns.
Strong column weak Weak column strong
beam design beam design
2.2.7 Effects of Earthquake on Reinforced Concrete Buildings
RCC building is made of horizontal members (beams and slabs) and the vertical members (columns and walls), and supported by foundations that rest on ground. The systems comprising of RC columns and connecting beams is called a RC frame. The RCC frame participates in resting the earthquake forces. Earthquake shaking generates inertia force in the building, which is proportional to the building mass. Since most of the building mass is present at floor level, earthquake-induced inertia forces primarily develop at floor levels. These forces travel downwards through slab and beam to column and walls and then to the foundations from where they are dispersed to the ground. As inertia forces accumulate downwards from top of the building, the columns and walls at lower storey experienced higher earthquake induced forces (Fig 2.14) and are therefore designed to be stronger than those in storey above.
Floor slabs are horizontal plate like elements, which facilitate functional used of building. Beams and columns are cast together. When the beams are bend in the vertical direction during earthquakes, Thin slabs bend along with them (Fig 2.15 a). When beams move with columns in the horizontal direction, the slab usually forces the beams to move together with it. The geometric distortion of the slab is negligible in the horizontal plane; this behavior is known rigid diaphragm method
Gravity load on the buildings causes RC frame to bend resulting in stretching and shortening at various locations. Tension is generated at surfaces that stretch and compression at those that shorten (Fig 2.16 b). Under gravity loads, tension in the beams is at the bottom surface of the beam in the central locations and is at the top surface at the ends. Earthquake loading causes tension on beam and column faces at locations different from those under gravity loading (Fig 2.16 c). The relative levels of bending moment generated are shown in Fig 2.16 d. The level of bending moment due to earthquake loading depends on severity of shaking and can exceed that due to gravity loading. Under strong earthquake shaking, the beam ends can develop tension on either of the top and bottom faces
2.3.1 SEISMIC Zoning
2.3.1.1 Seismic Zoning Map: The seismic Zoning map of Bangladesh is provided in Fig 2.17. Based on the severity of the probable intensity of seismic ground motion and damages, Bangladesh has been divided into three seismic Zones; Zone 1, Zone 2 and Zone 3 as shown in Fig 2.17, with Zone 3 being the most severe.
2.3.1.2 Selection of Seismic Zone and Zone Coefficient: Seismic Zone for building site shall be determined based on the location of the site on the seismic Zoning Map provided in Fig 2.17. Each building or structure shall been assigned a Seismic Zone coefficient, Z corresponding to the site as set forth in table 2.1.
2.3.2 provsion for partitions wall:
When partitions, not indicated on the plans, are anticipated to be placed on the floors, their weight shall be included as an additional live load acting as concentrated line loads in an arrangement producing the most sever effect on the floor, unless it con be shown that amore favorable arrangement of the partitions shall prevail the future use of the floor.
In the case of light partitions, where in the total weight per meter run is not greater than 5.5 Kn, a uniformly distributed live load may be applied on the floor in the lieu of the concentrated line loads specified above. Such uniform live load per square meter shall be at least 33 % of the weight per meter run of the partitions, subjected to a minimum of 1.2 Kn/m2.
2.3.3 SEISMIC Dead Load
Seismic dead load, W, is the total dead load of a building or a structure, including permanent partitions, and applicable portions of other loads listed below:
a) In storage and ware house occupancies, a minimum of 25% of the floor live load shall be applicable.
b) Where an allowance for partition load is included in the floor design in accordance with sec 2.3.2, all such loads but not less than 0.6 Kn/m2 shall be applicable.
c) Total weight of permanent equipment shall be included.
2.3.4 Practiced Lateral Force Methods and their limitations
Seismic lateral forces on primary framing systems shall be determined by using Equivalent Static Force Method or the Dynamic Response Method complying the restrictions given below:
A) The Equivalent Static Force Method may be used for the following structures:
i) All structures, regular or irregular, in seismic Zone 1 and in structure
Importance category 4 in Seismic Zone 2, except case b (iv).
ii) Regular structure under 75 meters in height with lateral force resistance
provided by structure system listed in table 2.2 except case b (iv) below.
iii) Irregular structure not more than 20 meters in height.
iv) A tower like building or structure having a flexible upper portion supported
On a rigid lower portion where:
a) Both portion of the structure considered separately can be classified as
regular structures.
b) The average storey stiffness of lower portion is at least ten times the
average storey stiffness of the upper portion.
c) The period of the entire structure is not greater than 1.1 times the
period of the upper portion considered as a separate structure fixed at
B) The dynamic response may be used for all classes of structure, but shall be used as the following structures.
i) Structures 75 meters or more in height except as permitted as case a (1).
ii) Structure over 20 meters in height in Seismic Zone 3 not having the same
structural system throughout their height.
iii) Structures regular or irregular located on soil type S4 which have a period
greater than 0.7 seconds.

Fig. 2.17: Seismic Zoning Map of Bangladesh (Adopted from BNBC, 1993)
2.4 Equivalent Static Force Method
This method may be used for calculation of seismic lateral forces for all structures specified in See 2.3.4(a)
2.4.1 Design Base Shear: The total design base shear in a given direction shall be determined from the following relation:
| Z = Seismic zone coefficient given in Table 2.1 I = Structure importance coefficient given in Table 2.2 R = Response modification coefficient for structural systems given in Table 2.3 W = The total seismic dead load defined in See 2.3.3 C = Numerical coefficient given by the relation
C = 1.25S / T ˆ2/3
S = Site coefficient for soil characteristics as provided in Table 2.40 T = Fundamental period of vibration in seconds, of the structure for the direction under consideration as determined by the provisions of See 2.4.2. The value of C need not exceed 2.75 and this value may be used for any structure without regard to soil type or structure period. Except for those requirements where Code prescribed forces are scaled up by 0.375R; the minimum value of the ratio C/R shall be 0.075.
|
Table 2.1 Seismic Zone Coefficients, Z
Seismic Zone | Zone |
(see Fig 6.2.10) | Coefficient |
I | 0.075 |
2 | 0.15 |
3 | 0.25 |
Table 2.2 Structure Importance Coefficients I, I’
Structure Importance Category | Structure | ||
| (see Table 6.1.1 for occupancy) | Importance | ||
Coefficient | |||
I | r | ||
I | Essential facilities | 1.25 | 1.50 |
II | Hazardous facilities | 1.25 | 1.50 |
III | Special occupancy structures | 1.00 | 1.00 |
IV | Standard occupancy structures | 1.00 | 1.00 |
V | Low-risk Structures | 1.00 | 1.00 |
2.4.2 Structure Period: The value of the fundamental period, T of the structure shall be determined from one of the following methods:
Method A: For all buildings the value of T may be approximated by the following formula:
Where, Ct = 0.083 .for steel moment resisting frames
= 0.073 for reinforced concrete moment resisting frames, and eccentric
= 0.049 for all other structural systems
hn = Height in meters above the base to level n.
Alternatively, the value of Ct for buildings with concrete or masonry shear walls may be taken as 0.031/√Ac. The value of Ac shall be obtain from the relation:
Ac =∑,Ae[0.2+(De/hn)2]
Where Ac = the combined effect area , in square meters, of shear walls in the first
Storey of the structure.
Ae = The effective horizontal cross sectional area , in square meters of a
Shear wall in the first storey of the structure.
De = The length , in meter of a shear wall element in the first storey in the
direction parallel to the applied forces.
The value of De/hn for use in eqn , Ac =∑,Ae[0.2+(De/hn)2] shall not exceed 0.9.
Table 2.3
Response Modification Coefficient for Structural Systems, R
| Basic Structural SystemtJ.J | Description of Lateral Force Resisting System | R t:LJ | |||
| a. Bearing Wall | I. | Light framed walls with shear panels | |||
System | i) | Plywood walls for structures, 3 storey or less | 8 | ||
ii) | All other light framed walls | 6 | |||
2. | Shear walls | ||||
i) | Concrete | 6 | |||
ii) | Masonry | 6 | |||
3. | Light steel framed bearing walls with tension only bracing | 4 | |||
4. | Braced frames where bracing carries gravity loads | ||||
| i) | Steel | 6 | |||
| ii) Concrete (3) | 4 | ||||
| iii) Heavy timber | 4 | ||||
| b. Building Frame | 1. | Steel eccentric braced frame (EBF) | 10 | ||
| System | 2. | Light framed walls with shear panels | |||
i) | Plywood walls for structures 3-storeys or less | 9 | |||
ii) | All other light framed walls | 7 | |||
3. | Shear walls | ||||
i) | Concrete | 8 | |||
ii) | Masonry | 8 | |||
4. | Concentric braced frames (CBF) | ||||
| i) Steel | 8 | ||||
| ii) Concrete (3) | 8 | ||||
| iii) Heavy timber | 8 | ||||
c. Moment Resisting | I. | Special moment resisting frames (SMRF) | |||
Frame System | i) | Steel | 12 | ||
| ii) Concrete | 12 | ||||
2. | Intermediate moment resisting frames (IMRF), concrete(4) | 8 | |||
3. | Ordinary moment resisting frames (OMRF) | ||||
| i) Steel | 6 | ||||
| ii\ Concrete (5) | 5 | ||||
| d. Dual System | 1. | Shear walls | |||
i) | Concrete with steel or concrete SMRF | 12 | |||
ii) | Concrete with steel OMRF | 6 | |||
iii) | Concrete with concrete IMRF (4) | 9 | |||
iv) | Masonry with steel or concrete SMRF | 8 | |||
v) | Masonry with steel OMRF | 6 | |||
vi) | Masonry with concrete IMRF (3) | 7 | |||
2. | Steel EBF | ||||
i) | With steel SMRF | 12 | |||
ii) | With steel OMRF | 6 | |||
3. | Concentric braced frame (CBF) | ||||
i) | Steel with steel SMRF | 10 | |||
ii) | Steel with steel OMRF | 6 | |||
iii) | Concrete with concrete SMRF (3) | 9 | |||
iv) | Concrete with concrete IMRF (3) | 6 | |||
| e. Special Structural | See Sec 1.3.2, 1.3.3, 1.3.5 | ||||
| Systems | |||||
Notes: (1) | Basic Structural Systems are defined in See 1.3.2, Chapter I. | ||||
(2) | See See 2.5.6.6 for combination of structural systems, and Sec 1.3.5 for system limitations. | ||||
(3) | Prohibited in Seismic Zone 3. | ||||
(4) | Prohibited in Seismic Zone 3 except as pennitted in See 2.5.9.3. | ||||
(5) | Prohibited in Seismic Zones 2 and 3. See 1.7.2.6. | ||||
| Site Soil Characteristics | Coefficient, | |||
| S | ||||
| Type | Description | |||
| S1 | A soil profile with either: | |||
| a) | A rock-like material characterized by a shear-wave velocity greater than | 1.0 | ||
| 762 m/ s or by other suitable means of classification, or | ||||
| S2 | b) | 5tiff or dense soil condition where the soil depth is less than 61 metres | ||
| S2 | A soil profile with dense or stiff soil conditions, where the soil depth exceeds | 1.2 | ||
| 61 metres | ||||
| S3 | A soil profile 21 metres or more in depth and containin more than 6 metres of | 1.5 | ||
| soft to medium stiff day but not more than 12 metres 0 soft clay | ||||
| S4 | A soil profile containing more than 12 metres of soft clay characterized by a | 2.0 | ||
| shear wave velocity less than 152 m/ s | ||||
| Note: (1) | The site coefficient shall be established from properly substantiated geotechnical data. In locations | |||
| where the soil properties are not known in sufficient detail to determine the soil profile type, soil | ||||
| profile S3 shall be used. soil profile S4 need not be assumed unless the building official determines | ||||
| that soil profile S4 may be present at the site, or in the event that soil profile S4 is established by | ||||
| geotechnical data. | ||||
Method B: The fundamental period T may be calculated using the structural properties and deformation characteristics of the resisting elements in a properly substantiated analysis. This requirement may be satisfied by using the following formula:
The values of Ii represent any lateral force distributed approximately in accordance with the principles of Eq (2.1), (2.2) and (2.3) or any other rational distribution. The elastic deflections, OJ shall be calculated using the applied lateral forces, I. The value of T determined from Eq (2.2) shall not exceed that calculated using Eq (2.3) by more than 40%.
2.4.3 Vertical Distribution of Lateral Forces: In the absence of a more rigorous procedure, the total lateral force, which is the base shear V, shall be distributed along the height.
V = Ft + ∑Fi
i=l
Where , Fi = Lateral force applied at storey level -i and
Ft = Concentrated lateral force considered at the top of buildings in addition
To the force Fn .
The concentrated force Ft acting at the top of the building shall be determined as follows:
Ft = 0.07TV≤0.25V When T › 0.7 seconds 2.5 a
Ft = 0.0 When T ≤ 0.7 seconds 2.5 b
The remaining portion of the base shear ( V-Ft ), shall be distributed over the height of the building, including level n, according to relation
At each storey level x, the force Fx shall be applied over the area of the building in proportion to the to the mass at distribution level.
.2.4.4 Horizontal Distribution of Shear: The design storey shear Vx, in any storey x is the sum of the forces Fx and Ft above that storey. Vx shall be distributed to the various elements of the vertical lateral force resisting system in proportion to their rigidities, considering the rigidity of the floor or roof diaphragm. A1lowance shan also be made for the increased shear arising due to any horizontal torsional moments as specified in Sec 2.4.5.
2.4.5 Horizontal Torsional Moments: Provision shall be made for the increased shears resulting from horizontal torsion where floor diaphragms are not flexible.
The torsional design moment at a given storey shall be the moment resulting from eccentricities between applied design lateral forces at levers above that storey and the vertical resisting elements in that storey plus an accidental torsional moment.
The accidental torsional moment in any storey shall be determined assuming the storey mass to be displaced from the calculated centre of mass in each direction a distance eg.ual to 5% of the building dimension at tha tlevel perpendicular to the direction of the force under consideration.
Where torsional irregularity exists (Plan Irregularity Type I as defined in Table 6.1.4) the effects shall be accounted for by increasing the accidental torsion at each level by an amplification factor, Ax determined from the formula:Where, δmax = the maximum displacement at level x
δavg =The average of the displacement at extreme position of the
building at level -x .
The more severe loading for each element shall be considered for design.
2.4.6 Combination of Structural Systems: When structural systems defined in Sec 1.3.2 are combined to be incorporated into the same structure, the following requirements shall be satisfied:
Vertical Combinations: The value of the response modification coefficient, R used in the design of any storey for a given direction shall not be greater than that used for the storey above. However, this requirement need not apply to a storey where the dead load above that storey is less than 10 percent of the total dead weight of the structure.
Structures may be designed using the procedures of Sec 2.4.1 under the following conditions:
i) The entire structure is designed using the lowest value of R for the lateral force resisting systems used, or
ii) The following procedure is used for structures conforming to Sec 2.3.4a (IV).
1. The flexible upper portion shall be designed as a separate structure, supported laterally by the rigid lower portions using the appropriate value of R
2. The rigid lower portion’ shall be designed as a separate structure using the appropriate value of R. The reactions from the upper portion shall be increased by the ratio of the R values of the two portions. These factored reactions shall be applied at the top of the rigid lower portion ‘in addition to the forces determined for the lower portion itself
Combinations along Different Axes:
| i) In Seismic Zone 3, where a structure has a Bearing Wall System in only one direction, the value of R used for the orthogonal direction shall not De greater than that used for the Bearing Wall System defined in See 1.3.2.
ii) Any combination of Building Frame Systems, Dual Systems, .or Moment Resisting Frame Systems defined in Sec 1.3.2 may be used to resist design seismic forces irregular structures less than 50 m in height. Only combinations of Dual Systems and Special Moment Resisting Frames (SMRF) can be used to resist the design seismic forces in structures exceeding 50 m in height in Seismic Zone 3. |
2.5 TIME HISTORY ANALYSIS
Time-history analysis is a step-by-step analysis of the dynamical response of a structure to a specified loading that may vary with time. The analysis may be linear or non linear.
2.5.1 LINEAR TIME HISTORY ANALYSIS
Time history analysis is used to determine the dynamic response of a structure to arbitrary loading. The dynamic equilibrium equations to be solved are given by:
Where K is the stiffness matrix; C is the damping matrix; M is the diagonal mass matrix; u, u• and u•• are the displacements, velocities, and accelerations of the structure; and r is the applied load. If the load includes ground acceleration, the displacements, velocities, and accelerations are relative to this ground motion.
The load, r(t), applied in a given time history case may be an arbitrary function of space and time. It can be writ ten as a finite sum of spatial load vectors, pi, multiplied by time functions, f i (t), as,
The analysis uses Load Cases and/or Acceleration Loads to represent the spatial load vectors. The time functions can be arbitrary functions of time or periodic functions such as those produced by wind or sea wave loading.
If Acceleration Loads are used, the displacements, velocities, and accelerations are all measured relative to the ground. The time functions associated with the Acceleration Loads mx, my, and mz are the corresponding components of uniform ground acceleration, n, u•gx, u•gy, and u•gz
2.5.2 MODAL TIME HISTORY ANALYSIS
Modal analysis is used to determine the vibration modes of a structure. These modes are useful to understand the behavior of the structure. They can also be used as the basis for modal super position in response spectrum and modal Time history Analysis Cases.
Modal superposition provides a highly efficient and accurate procedure for performing time-history analysis. Closed-form integration of the modal equations is used to compute the response, assuming linear variation of the time functions, f i (t), between the input data time points. Therefore, numerical instability problems are never encountered, and the time increment may be any sampling value that is deemed fine enough to capture the maximum response values. One-tenth of the time period of the highest mode is usually recommended; how ever, a larger value may give an equally accurate sampling if the contribution of the higher modes is small.
The modes used are computed in a Modal Analysis Case that we define. They can be the un damped free-vibration Modes (eigenvectors) or the load-dependent Ritz-vector Modes.
If all of the spatial load vectors, pi, are used as starting load vectors for Ritz-vector analysis, then the Ritz vectors will al ways produce more accurate results than if the same number of eigenvectors is used. Since the Ritz-vector algorithm is faster than the eigenvector algorithm, the former is recommended for time-history analyses.
It is should be determine if the Modes calculated by the program area equate to represent the time-history response to the applied load. The analysis case should be check
• That enough Modes have been computed
• That the Modes cover an adequate frequency range
• That the dynamic load (mass) participation mass ratios are adequate for the
load cases and/or Acceleration Loads being applied
• That the modes shapes adequately represent all desired deformations
2.5.3 MODAL DAMPING
The damping in the structure is modeled using uncoupled modal damping. Each mode has a damping ratio, damp, which is measured as a fraction of critical damping and must satisfy:
0 ≤ damp<1
Modal damping has three different sources, which are described in the following. Damping from these sources is added together.
2.5.4 NON LINEAR TIME HISTORY ANALYSIS
The dynamic equilibrium equations are same as linear time history analysis.
2.5.5 NON LINEAR MODAL TIME HISTORY ANALYSIS
The method of non linear time-history analysis is an extension of the Fast Non linear Analysis (FNA) method developed by Wilson (Ibrahimbegovic and Wilson, 1989; Wilson, 1993). The method is extremely efficient and is designed to be used for structural systems which are primarily linear elastic, but which have a limited number of pre de fined non linear elements. For the FNA method, all nonlinearity is restricted to the Link/Sup port elements. A short description of the method follows. The dynamic equilibrium equations of a linear elastic structure with defined non linear Link/Support elements subjected to an arbitrary load can be writ ten as:
Where KL is the stiff ness matrix for the linear elastic elements (all elements accept the Links/Supports); C is the proportional damping matrix; M is the diagonal mass matrix; rN is the vector of forces from the non linear degrees of freedom in the link/Support elements; u, u•, and u•• are the relative displacements, velocities, and accelerations with respect to the ground; and r is the vector of applied loads.
2.5.6 MODE SUPERPOSITION
Modal analysis is performed using the full stiff ness matrix, K, and the mass matrix,M. It is strongly recommended that the Ritz-vector method be used to per form the modal analysis.
Using standard techniques, the equilibrium equation can be writ ten in modal form
as:
where W2 is the diagonal matrix of squared structural frequencies given by:
L is the modal damping matrix which is assumed to be diagonal:
I is the identity matrix which satisfies:
(t) is the vector of modal applied loads:
N (t) is the vector of modal forces from the nonlinear elements:
a (t) is the vector of modal displacement amplitudes such that:
and F is the matrix of mode shapes.
It should be noted that, unlike linear dynamic anal y sis, the above modal equations are coupled. In general the nonlinear forces, q N (t), will coup le the modes since they are functions of the modal displacements, a(t).
It is important to recognize that the solution to these modal equations is dependent on being able to adequately represent the non linear forces by the modal forces,
N (t). This is not automatic, but re quires the following special considerations:
• Mass and/or mass moments of inertia should be present at all non linear degrees
of freedom.
• The Ritz-vector method should be used to determine the Modes, unless all possible structural Modes are found using eigenvector analysis.
• The Ritz starting load vectors should include a non linear de formation load for
each in dependent non linear degree of freedom.
• A sufficient number of Ritz-vectors should be sought to capture the deformation in the non linear elements completely
2.6 MODELING of Partition Wall
2.6.1 Equivalent Strut Method
Presence infill affects the distribution of lateral force in the frames of building because of the increase of stiffness of some of frames. In plane strength predictions of in filled frames are complex, statically indeterminate problem. The strength of a composite of in filled is not only the summation of the infill properties plus those of the frame. Great efforts have been invested, both analytically and experimentally, to better understand and estimate composite behavior of masonry in filled frames. Polyakov (1960), Mainstone (1971), Klinger and Bertero (1976, 1978), to mention just a few, formed the basis for understanding and predicting in filled frame in plane behavior.
During testing of the specimens, diagonal cracks developed in the center pf the panel, and gaps formed between the frame and the infill in the non loaded diagonal corners of the specimens, while full contact was observed in the two loaded diagonal corners. This behavior, initially observed by Polyakov, lead to a simplification in filled frame analysis by replacing the masonry infill with an equivalent compressive masonry strut. The equivalent strut of width, a, with same net thickness and mechanical properties (such as the modulus of elasticity Em ) as the infill itself, is assumed to be pinned at both ends to the confining frame.
2.6.2 Equivalent strut width
The evaluation of the equivalent width, a, varies from one reference to the other. The most simplistic approaches presented by pauly priestly (1992) and angeletal (1994) have assumed constant values for the strut width, a, between 12.5 to 25 percent of the diagonal dimension of the infill, with no regard for any infill or frame properties. Stamford smith carter (1969), Mainstone and others derive complex expressions to estimate the equivalent strut width, a, that considered parameters like the length of contact between the column/ beam and in the infill, as well the relative stiffness of the infill to the frame.
3.1 Introduction
This chapter analyses the particular building with Equivalent Static Force Method and the Time History Analysis. But the analysis is done in different cases. Firstly the regular building and than incorporate to give irregular shape as soft storey as well as increasing the load at particular storey. The Equivalent Static Force Method is applicable for regular structure with moderate height. But irregular structure it is better to dynamic analysis.
3.2 Analysis Description
This chapter has been focus the word bare frame because all cases as regular as well as irregular building the analysis has been done without modeling the partition wall. The Equivalent Static Force Method as per BNBC code on the basis of fundamental time period is divided in Method A which dependent on the height of the structure and Method B whose time period is dependent of the structural properties. Time history Analysis in all cases has been used recoded earthquake data by proper scaling. For all the analysis case compared the result as base shear by Equivalent Static Force Method A, Method B, and Time History Analysis using ETABS.
3.3 Analyses of Irregular Six Storied Building (Thinner Columns in Ground Storey)
This particular case it has been incorporated to irregular shape of the building B1 as previous sec 3.2. For fulfill the objective the column area is increased 1.5 times from 2nd storey to upper storey than existing column size in building B1 and the ground storey column area is remained same . This particular type of building is become soft storey and is denoted by building B2. The elevation of the building with the identity of the column size is given in Fig 3.5. The analyses of the building used same data in sec 3.2.The time period of first mode of the building is 1.11sec and is used this time period in Method B which denoted the bare frame because the time period of first mode is dependent on the structural properties. This particular building is flexible at ground storey and slightly become more sway than the regular building. The mode shape of the building is given in Fig 3.6. For Time History Analysis used recorded earthquake data El Centro and also considered 5 percent damping as per code. The shear distribution and displacement curve of Equivalent Static Force Method A, Method B and Time History Analysis is show
3.4 Analysis of Irregular Six Storied Building (With Extra Mass at Fourth Story)
In this particular case it has been incorporated to irregular shape of the building B1 by increasing the load at fourth storey. For fulfill the objective the dead load is increased at fourth storey three times than the existing load of building B1. The building will become more flexible than the regular building. This particular type of building is denoted building B2.The analyses of the building used same data in sec3.2. The building is slightly more sway than the regular building. The mode shape of the building is given in Fig 3.9. The time period of first mode of the building is 1.44 sec and used this time period in Method B which denoted the bare frame. The base shear in Equivalent Static Force Method is more because of increasing the load and base shear is lower in Time History analysis because this particular structure is less stiff than the regular structure. The Shear distribution in Equivalent Static Force Method A, Method B, and Time History Analysis
3.5 Comparison of Results
3.5.1 Comparison among Equivalent Static Force Method using Method
A, User Defined Time Period (Bared Frame Analysis) and Time History Analysis
Comparison the result by base Shear among Equivalent Static Force Method using Method A, User Defined Time Period Method B (Bared Frame Analysis) and Time History Analysis. This stage it has been incorporated to finding the causes of variation of the results by base shear. The variation of the results is mainly Equivalent Static Force Method A with other two methods because of modeling without partition wall. This chapter the result comparison has been not realistic because the effect of partition wall is not considered. The result comparison is done as regular as well as irregular building.
3.5.1.1 Regular Six Storied Building
For regular building compare the result graphically by base shear distribution. The Equivalent Static Force Method on the basis of fundamental time period is divided by Method A whose time period is dependent of the height of the structure and Method B whose time period is dependent of the structural properties. For Time history analysis is with the equilibrium equation depend stiffness, damping and mass due to applied load. The time period of the building from first mode is 1.19 sec which is applied in Method B on the other hand in Method A the time period is 0.67 sec. The time period is inversely related to the base shear. Only for that reason the base shear of the building B1 in Method A is higher other than two methods are given in Fig 3.3. In Time history analysis the base shear is less other than two because the effect of partition wall is not considered. May be the soil factor is not considered by scaling of the El Centro data. If the stiffness of the building has been increased by the modeling of partition wall or may be increasing the column area the base shear of Time history analysis may be closer to the Equivalent Static Force Method.
3.5.1.2 Irregular Six Storied Building (Thinner Column in Ground Storey)
This particular case the shear distribution will be different than regular building. The time of the building from first mode is 1.14 sec which is applied in Method B on the other hand the tome period of Method A is remain same as 0.67 sec. The base shear in Equivalent Static Force Method A is higher than Method B. In Time history analysis the base shear is less because the structure is flexible than regular building. The base Shear is comparable by Equivalent Static Force Method B and Time History Analysis because both cases the effect of partition wall is not considered. The variation may be arise with the soil factor is not considered by scaling of El Centro data. The base shear distribution is given in Fig 3.7. The structure has been more flexible than the regular building. The structural stiffness is reduced because of the soft storey building.
3.5.1.3 Irregular Six Storied Building (Extra Mass at Fourth Storey)
The time period of the building B3 from first mode is 1.44 sec which is applied in Equivalent Static Force Method B. The Shear distribution is given in Fig 3.10. This particular case the base shear in Equivalent Static Force Method A is more than other two methods because of increasing the dead load. In Time History Analysis the base shear is less other than two. The structure is more flexible than regular structure because of increasing the load. For this reason the structural stiffness is reduced which become the less base shear in case of Time History Analysis. The soil factor is not considered by scaling of El Centro data.
3.5.2 Comparison among regular and irregular Buildings by Equivalent Static Force Method using Method A
The time period in Equivalent Static Force Method as regular as well as irregular building is 0.67 sec. The time period is inversely related with base shear in Equivalent Static Force Method. Alternatively the dead load is proportionally related to the base shear. These particular cases the variation of result only depend of the dead load of the building. The base shear distribution is given in Fig 3.12. The base shear of regular which is denoted EQA and irregular building (thinner column in ground storey) which is denoted EQB is almost same because of the dead load is closely to same. The base shear of irregular (extra mass at fourth storey) which is denoted by EQC is higher other than two buildings because of increasing the dead load. It has been observed that with the constant time period the Equivalent Static Force Method A, the base shear is varying with the dead load.
3.5.3 Comparison among regular and irregular Buildings by Equivalent Static Force Method B (Bare Frame)
The time period of the Equivalent Static Force Method B is dependent on the structural properties. The Equivalent Static Force Method both regular and irregular building the base shear is varies with the time period and the dead load. The time period of regular building B1 is 1.19 sec, irregular building (soft storey) B2 is 1.14 sec and irregular (add mass) building B3 is 1.44 sec. The base shear distribution is given by Fig 3.13. The base shear is higher in irregular (add mass) building is denoted Bare frame C because of increasing the dead load. The base shear of irregular building (soft storey) which denoted by bare frame B is more than regular building because of the time period which is inversely related to the base shear.
3.5.3 Comparison among Regular and Irregular Building by Time History Analysis
The Time History Analysis with the equilibrium equation is stiffness, damping and mass due to applied load. The variation of result both regular and irregular buildings by base shear mainly the stiffness of the structure. The base shear distribution by Time history Analysis among regular and irregular structure is given by Fig 3.16. The base shear of irregular (add mass) building B3 is lower because of increasing the load which will become the less stiff of the structure. All cases the soil factor is not considered by the scaling of El Centro data. The base shear of irregular (soft storey) building B2 is more other than because of increasing the column area. It has been observed that the Time History Analysis in all cases not considered the effect of partition wall. The result comparison by Time History Analysis is more realistic if the effect of partition wall is considered.
3.6 Conclusion
This chapter it has been analyses and compared the result of regular, irregular (soft storey), irregular (add mass) by Equivalent static Force method A, Method B and Time History Analysis without modeling the partition wall. All cases the Equivalent Static Force Method A is conservative because the effect of the partition is not considered. The analyses are done in different case as regular as well as irregular building. The variation of result as shear as well as displacement causes the fundamental time period of the structure, applied load and stiffness of the structure. Time History Analysis has given more accurate result other than two. Next chapter the analysis is done with modeling of partition wall and has been more realistically than bare frame because considered the effect of partition wall.
4.1 introduction
Previous chapter the analysis has been done without modeling the partition wall. This chapter the analysis is done with modeling the partition wall by Equivalent Static Force Method and Time History Analysis. The modeling of partition wall has been done by Equivalent strut method. For analysis purpose a simple six storied building is considered. The analysis is done by regular and irregular building. For all cases considered hundred partition walls. With the effect of partition wall compared the result as base shear by Equivalent Static Force Method
4.2 Analyses of a Regular Six Storied Building (partition Wall in all
Stories)
The process of partition wall modeling has been described in sec 2.6. The Strut modeling calculation is given in Appendix. The analyses of regular building considered a six storied building and using the same data in sec 3.2. After modeling the partition wall of this particular building with ETABS, the 3D view and elevation is given in Fig 4.1 and Fig 4.2. With the effect of partition wall the time period of the first mode is 0.455 sec. This time period is defined in Equivalent Static Force Method B. On the other hand the time period is 0.67 sec in Equivalent Static Force Method A. For Time History Analysis considered five percent damping. Also in Time History Analysis is used recorded earthquake data by scaling.
4.3 Analyses of Irregular Building (Partition wall remove in 1st storey)
This particular case it has been incorporated to irregular shape of building as previous sec 4.2. For fulfill the objective the partition wall is remove in 1st storey and the building will become a soft storey building. The elevation of the building is shown in Fig 4.5.This particular building is more sway in ground storey than regular building. The mode shape is shown in Fig. 4.6. The time period of first mode is 0.74 sec and used this time period in Equivalent Static Force Method B. For Time History Analysis used recorded earthquake data El Centro and also consider five percent damping.
4.3 Analyses of Irregular Six Storied Building (partition wall remove 1st and 4th storey).
This particular case to perform irregular shape of the building, the partition wall is removed in 1st and 4th storey. So the building is more flexible than previous building in sec 4.2.The elevation of the building is shown in Fig. 4.9. The time period of the first mode is 0.81 sec and used this time period in Equivalent Static Force Method B. The building is to perform more sway at 1st and 4th storey than other storey. The mode shape of the building is shown in Fig. 4.10.In Time History Analysis recorded earthquake data is used and also consider five percent damping. The base shear distribution and displacement curve of Equivalent Static Force Method
4.4 Analyses of Six Storied Building (Extra mass at fourth storey)
This case it has been incorporated to irregular shape of the building, the dead is increasing at fourth storey. The dead load is increased abruptly five times at fourth storey than the existing load of regular building. The time period of first mode is 0.79 sec and defined this time period at Method B. The building is slightly more sway at fourth storey. The mode shape is shown in fig. 4.13. For Time History Analysis used recorded earthquake data and also consider five percent damping. The base shear and displacement curve of Equivalent Static Force Method
Comparison of Result:
4.6.1 Comparison among Equivalent Static Force Method using Method A, User Defined Time Period Method B and Time History Analysis.
Compare the result by base shear among Equivalent Static Force Method using Method A, User Defined Time Period Method B and Time History Analysis with modeling the partition wall. This stage it has been incorporated to findings the causes of variation of result by Equivalent Static Force Method using Method A, User Defined Time Period Method B and Time History Analysis. This chapter the result variation has been realistic because the effect of partition wall is considered. The result comparison is done by regular building, irregular building (partition wall remove the 1st storey), irregular building (partition wall remove 1st and 4th storey) and irregular building (Extra mass at fourth Storey).
4.6.1.1 Regular Six Storied Building
For regular building compared the result graphically by base shear distribution. The Equivalent Static Force Method on the basis of fundamental time period is divided by Method A whose time period is dependent on the height of the structure and Method B whose time period is dependent of the structural properties. The time period of first mode is 0.4556 sec, which is applied in Method B. On the other hand in Method A the time period is 0.67 sec. The time period is inversely related to the base shear. Only for that reason the base shear in Method B is higher than Equivalent Static Force Method A. For Time History Analysis dependent the stiffness, damping and mass with respect to applied load. The base shear distribution among Equivalent Static Force Method A, Method B and Time History Analysis is shown in fig. 4.3. The base shear of Time History Analysis
is almost closely to the Equivalent Static Force Method A, because the effect of partition wall is considered. The soil factor is not considered by scaling of El Centro data.
4.6.1.2 Irregular Six Storied Building (Partition wall remove 1st storey)
This particular case the time of first mode is 0.74 sec which is applied in Method B and Method A the time period is 0.67 sec. The time period is inversely related to the base shear and the dead load is proportionally related to the base shear. This particular building with the same load but different time period of Method A and Method B. For this reason the base shear is higher in Method A than Method B. The base shear distribution is shown in fig 4.7. For Time History Analysis the base shear is less other than two methods. The structure is flexible at ground storey and the structure will become soft storey building. This irregularity of this particular building the structural stiffness is reduced and for this reason the Time History Analysis shown less base shear other than two methods. May be the soil factor is not considered by scaling of El Centro data.
4.6.1.3 Irregular Six Storied Building (Partition wall remove 1st and 4th storey)
This particular irregular building is more flexible than previous sec 4.6.1.2. The time period of first mode is 0.81 sec which is applied in Equivalent Static Force Method B. On the other hand, the time period is 0.67 sec in Equivalent Static Force Method A. The time period is inversely related to the base shear. For this reason, in Method A the base shear is higher value than Method B. The base shear distribution among Equivalent Static Force Method A, Method B and Time History Analysis is shown in fig 4.11. This particular building is more flexible because of removing the partition wall and the stiffness of the building is reduced. For this reason, Time History Analysis is shown less base shear with respect to other two methods. May be the soil factor is not considered by scaling of El Centro data.
4.6.1.4 Irregular Six Storied Building (Extra mass at fourth storey)
The time period from first mode is 0.79 sec which is applied in Equivalent Static Force Method B. The time period is inversely related to the base shear and the dead load is proportionally related to the base shear. The time period of Equivalent Static Force method A is 0.67 sec. In Equivalent Static Force Method A, the base shear is higher value other than two because of increasing the dead load. The base shear distribution among Equivalent Static Force Method A, Method B and Time History Analysis is shown in fig 4.14. This particular building, increasing the dead load without increasing the column area, the structure will become more flexible and reduced the stiffness of the structure. For this reason, Time History Analysis is shown lower value other than two methods. Because the Time History Analysis is depend on the stiffness of the structure. May be the soil factor is not considered by scaling of El Centro data.
4.6.2 Comparison among regular and irregular building by Equivalent Static Force
Method B
Compare the result among regular and irregular building graphically by base shear. The time period of first mode of regular, irregular (partition wall remove 1st storey) and irregular (partition wall remove 1st and 4th storey) building are 0.4556sec, 0.74sec and 0.81sec. The time period is inversely related to the base shear and the dead load is proportionally related to the base shear. The base shear distribution is shown in fig 4.16. For regular building the base shear is shown higher value other than two buildings because the difference of time period.
4.6.3 Comparison among regular and irregular building by Time History Analysis
Compare the result graphically by base shear by Time History Analysis. For Time History Analysis the variation of result is mostly responsible for the stiffness of the structure. For regular building (Time history A), the base shear is shown higher value other than two building because considered the hundred partition wall and the structure is stiffer. The shear distribution among regular and irregular building is shown in fig.4.17. For irregular (partition wall remove 1st and 4th storey) building which is denoted Time History C is shown lower value because the remove of partition wall and the structure will become less stiff.
4.7 Comparison of Result between El Centro and Bangladeshi data:
In Time History Analysis have been used El Centro data and Bangladeshi (Mymensingh) data by scaling. Both data using Time History Analysis considered five percent damping and also consider the effect of hundred percent partition walls. The analysis is done in same structure in sec 4.2. The shear distribution is shown in fig 4.18. The variation of result may be the difference of frequency of El Centro and Bangladeshi data.
4.8 Conclusion
This chapter it has been analyses and compared the result of regular, irregular (partition wall remove 1st storey), irregular (partition wall remove 1st and 4th storey) and irregular (Extra mass at fourth storey) by Equivalent Static Force Method A, Method B and Time History Analysis. With the effect of hundred percent partitions walls almost all cases, the Equivalent Static Force method is conservative with respect to Time History analysis. The variation of result is mostly responsible for the time period, dead load and the stiffness of the structure. But the Time History Analysis is more accurate with respect to Equivalent Static Force Method. So, the Equivalent Static Force Method is conservative with respect to Time History Analysis.
CONCLUSION
5.1 General
For seismic lateral force may be calculated by two methods, namely, Equivalent Static Force Method and Dynamic Analysis. In Bangladesh, the number of high rise building is increasing day by day. For seismic lateral force calculation, Equivalent Static Force Method is most commonly used because of its simplification. But Equivalent Static Force Method is applicable for regular building with moderate height. For tall building or irregular structure, as the Code prescribed (BNBC), it is better to perform dynamic analysis. The dynamic analysis is more complicated and time consuming which is more correct than Static Analysis. In case study, the Equivalent Static Force Method and Time History Analysis have been used to analyzed regular and various irregular buildings. For the analyses ETABS has been used. The analyses are done with and without considered the effect of partition wall. It has been observed that both cases the Equivalent Static Force Method is conservative with respect to the Time History Analysis.
5.2 Findings
In this thesis, The Equivalent Static Force Method and Time History Analysis have been used to analyze regular and irregular building by using ETABS. From this study the findings are:
- The Equivalent Static Force Method has been adequate with respect to dynamic Analysis.
- In case of bare frame analyses, the Equivalent Static Force Method has shown higher base shear than Time History Analysis.
- After modeling the partition wall by Equivalent Strut width, also the Equivalent Static Force Method has shown higher base shear than Time History Analysis.
- The Equivalent Static Force Method is conservative With respect to Time History Analysis.
5.3 Limitation of the Thesis
The thesis has some limitation in different context. These are:
- In case of partition wall modeling, the analyses are done with consider hundred percent partition wall. Hundred percent partition walls are not realistic.
- Soil factor is considered by scaling of recorded earthquake data (El Centro).
5.4 Recommendation
Here some recommendations are presented for future works related to Equivalent Static Force Method and Time History Analysis. These are:
- In this study have been used six storied building and the height of the building is 19.5m.but structure 75m or more than 75m the result will be different.
- Modeling of partition wall by Equivalent Strut width should necessary to perform more details in future.
- In case of Time History Analysis with respect to Equivalent Static Force Method, the result variation is more. It should necessary to perform more details in Time History Analysis.
- The base shear of Equivalent Static Force Method is the minimum value, if the base shear of Time History analysis is less than the Equivalent Static Force Method, it should be scaling up the base shear.
- In case of base shear, if design engineer design the building with consider the Time History Analysis. The base shear of Time History Analysis should be adjusted in proportion to the base shear of Equivalent Static Force Method.