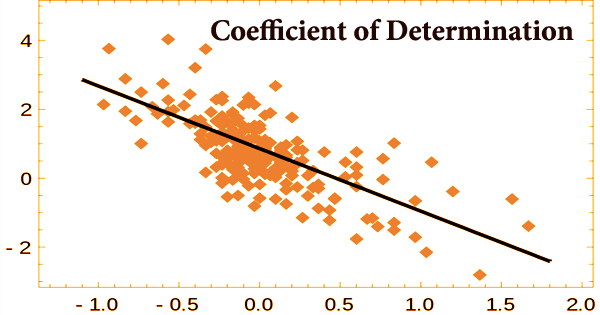
In a regression model, the coefficient of determination (R2 or r-squared) is a statistical metric that determines how much variance in the dependent variable can be explained by the independent variable. It’s a statistic used in statistical models whose main goal is either to forecast future events or to evaluate hypotheses based on other data. The coefficient of determination, in other words, indicates how well the data matches the model (the goodness of fit).
Based on the fraction of total variance of outcomes described by the model, it offers a measure of how well observed results are duplicated by the model. R2 denotes the percentage of variation in the dependent variable (Y) that is predicted or explained by linear regression and the predictor variable (X, also known as the independent variable). A high R2 number, in general, implies that the model is a good fit for the data, however, fit interpretations vary depending on the context of the study.
To give an example of how this coefficient may be used, consider the following scenario: if a woman falls pregnant on a specific day, what is the chance that she will deliver her baby on a specific day in the future? This measure tries to calculate the correlation between two linked occurrences in this scenario: conception and birth.
The correlation coefficient, R, and the coefficient of determination, R2, are identical. Depending on the criteria employed, the computational definition of R2 might provide negative values in some instances. It’s a term used to describe how much variability in one element may be attributed to its connection with another. Although the coefficient of determination gives some valuable information about the regression model, it is not the only metric to consider when evaluating a statistical model.
It doesn’t reveal anything about the cause-and-effect relationship between the independent and dependent variables, and it doesn’t show if the regression model is right. It can be compared to a percentage. It indicates how many data points are contained inside the results of the regression equation’s line. When the predictions being compared to the associated outcomes aren’t obtained via a model-fitting method utilizing those data, this might happen.
The coefficient of determination is a metric for determining how much variability in one element can be attributed to its connection with another. As a result, in a statistical model, the user should always make inferences about the model by examining the coefficient of determination in conjunction with other variables. Any number between 0 and 1 can be used for the coefficient of determination. Furthermore, percentages are commonly used as a statistical measure.
The “goodness of fit,” or correlation, is expressed as a number between 0.0 and 1.0. A score of 1.0 implies a perfect fit and hence a very trustworthy model for future projections, whereas a value of 0.0 shows that the computation failed to properly represent the data. R2 can be negative even when a model-fitting technique is employed, such as when linear regression is performed without an interceptor when a non-linear function is used to fit the data. However, a value of 0.20 indicates that the independent variable predicts 20% of the dependent variable, whereas a value of 0.50 indicates that the independent variable predicts 50% of the dependent variable, and so on.
When the data points and line are plotted, the greater the coefficient, the more points the line passes through. If the coefficient is 0.80, then the regression line should contain 80 percent of the points. A regression line with a value of 1 or 0 indicates all or none of the data, respectively. The coefficient of determination is most commonly used to determine how well the regression model matches the observed data. A coefficient of determination of 60%, for example, indicates that 60% of the data fits the regression model.
The regression line for the narrow set of data will be near to the points and have a high degree of fit, which means that the distance between the line and the data will be minimal. According to this criterion, in instances when negative values occur, the data mean gives a better match to the outcomes than the fitted function values. R2 is helpful since it may determine the chance of future occurrences occurring within the expected outcomes. If further samples are added, the coefficient will reflect the likelihood of a new point landing on the line.
The quality of the coefficient is determined by a number of factors, including the variables’ units of measurement, the type of the variables included in the model, and the data transformation used. As a result, a large coefficient might occasionally suggest problems with the regression model. Since the second component compares the unexplained variance (variance of the model’s mistakes) with the total variance (of the data), R2 may be shown to be connected to the percentage of variance unexplained (FVU):
R2 =1 – FVU
Mathematically, the coefficient of determination can be found using the following formula:
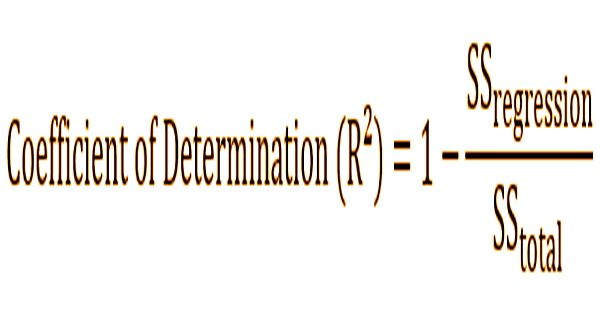
Where:
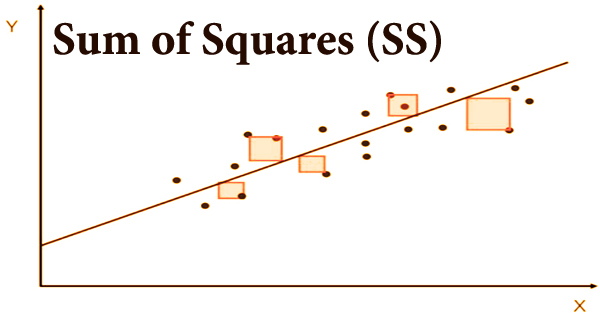
SSregression – The sum of squares due to regression (explained sum of squares)
SStotal – The total sum of squares
Although the words “total sum of squares” and “sum of squares owing to regression” appear to be contradictory, the definitions of the variables are clear. The Adjusted Coefficient of Determination (Adjusted R-squared) is a Coefficient of Determination modification that takes the number of variables in a data set into account. The variance in the observed data is measured by the total sum of squares (data used in regression modeling). The sum of squares due to regression is a measurement of how well the regression model fits the data utilized in the model.
Information Sources: