Introduction:
Six Sigma is a business management strategy originally developed by Motorola, USA in 1986 As of 2010, it is widely used in many sectors of industry, although its use is not without controversy.
Six Sigma seeks to improve the quality of process outputs by identifying and removing the causes of defects (errors) and minimizing variability in manufacturing and business processes. It uses a set of quality management methods, including statistical methods, and creates a special infrastructure of people within the organization (“Black Belts”, “Green Belts”, etc.) who are experts in these methods. Each Six Sigma project carried out within an organization follows a defined sequence of steps and has quantified financial targets (cost reduction and/or profit increase).
Six Sigma:
The term Six Sigma originated from terminology associated with manufacturing, specifically terms associated with statistical modeling of manufacturing processes. The maturity of a manufacturing process can be described by a sigma rating indicating its yield, or the percentage of defect-free products it creates. A six sigma process is one in which 99.99966% of the products manufactured are statistically expected to be free of defects (3.4 defects per million). Motorola set a goal of “six sigma” for all of its manufacturing operations, and this goal became a byword for the management and engineering practices used to achieve it.
Historical overview
Six Sigma originated as a set of practices designed to improve manufacturing processes and eliminate defects, but its application was subsequently extended to other types of business processes as well. In Six Sigma, a defect is defined as any process output that does not meet customer specifications, or that could lead to creating an output that does not meet customer specifications.
The core of Six Sigma was “born” at Motorola in the 1970s out of senior executive Art Sundry’s criticism of Motorola’s bad quality. As a result of this criticism, the company discovered a connection between increases in quality and decreases in costs of production. At that time, the prevailing view was that quality costs extra money. In fact, it reduced total costs by driving down the costs for repair or control. Bill Smith subsequently formulated the particulars of the methodology at Motorola in 1986. Six Sigma was heavily inspired by the quality improvement methodologies of the six preceding decades, such as quality control, TQM, and Zero Defects, based on the work of pioneers such as Shewhart, Deming, Juran, Ishikawa, Taguchi and others.
Like its predecessors, Six Sigma doctrine asserts that:
- Continuous efforts to achieve stable and predictable process results (i.e., reduce process variation) are of vital importance to business success.
- Manufacturing and business processes have characteristics that can be measured, analyzed, improved and controlled.
- Achieving sustained quality improvement requires commitment from the entire organization, particularly from top-level management.
Features that set Six Sigma apart from previous quality improvement initiatives include:
- A clear focus on achieving measurable and quantifiable financial returns from any Six Sigma project. An increased emphasis on strong and passionate management leadership and support.
- A special infrastructure of “Champions,” “Master Black Belts,” “Black Belts,” “Green Belts”, etc. to lead and implement the Six Sigma approach.
- A clear commitment to making decisions on the basis of verifiable data, rather than assumptions and guesswork.
The term “Six Sigma” comes from a field of statistics known as process capability studies. Originally, it referred to the ability of manufacturing processes to produce a very high proportion of output within specification. Processes that operate with “six sigma quality” over the short term are assumed to produce long-term defect levels below defects per million opportunities (DPMO). Six Sigma’s implicit goal is to improve all processes to that level of quality or better.
Six Sigma is a registered service mark and trademark of Motorola Inc. As of 2006 Motorola reported over US$17 billion in savings from Six Sigma. Other early adopters of Six Sigma who achieved well-publicized success include Honeywell (previously known as AlliedSignal) and General Electric, where Jack Welch introduced the method. By the late 1990s, about two-thirds of the Fortune 500 organizations had begun Six Sigma initiatives with the aim of reducing costs and improving quality. In recent years, some practitioners have combined Six Sigma ideas with lean manufacturing to create a methodology named Lean Six Sigma. The Lean Six Sigma methodology views lean manufacturing, which addresses process flow and waste issues, and Six Sigma, with its focus on variation and design, as complementary disciplines aimed at promoting “business and operational excellence”. Companies such as IBM use Lean Six Sigma to focus transformation efforts not just on efficiency but also on growth. It serves as a foundation for innovation throughout the organization, from manufacturing and software development to sales and service delivery functions.
Methods
Six Sigma projects follow two project methodologies inspired by Deming’s Plan-Do-Check-Act Cycle. These methodologies, composed of five phases each, bear the acronyms DMAIC and DMADV. DMAIC is used for projects aimed at improving an existing business process. DMAIC is pronounced as “duh-may-ick”.
- DMADV is used for projects aimed at creating new product or process designs. DMADV is pronounced as “duh-mad-vee”.
DMAIC
The DMAIC project methodology has five phases:
- Define the problem, the voice of the customer, and the project goals, specifically.
- Measure key aspects of the current process and collect relevant data.
- Analyze the data to investigate and verify cause-and-effect relationships. Determine what the relationships are, and attempt to ensure that all factors have been considered. Seek out root cause of the defect under investigation.
- Improve or optimize the current process based upon data analysis using techniques such as design of experiments, poka yoke or mistake proofing, and standard work to create a new, future state process. Set up pilot runs to establish process capability.
- Control the future state process to ensure that any deviations from target are corrected before they result in defects. Implement control systems such as statistical process control, production boards , visual workplaces, and continuously monitor the process.
DMADV or DFSS
The DMADV project methodology, also known as DFSS (“Design For Six Sigma) features five phases:
- Define design goals that are consistent with customer demands and the enterprise strategy.
- Measure and identify CTQs (characteristics that are Critical To Quality), product capabilities, production process capability, and risks.
- Analyze to develop and design alternatives, create a high-level design and evaluate design capability to select the best design.
- Design details, optimize the design, and plan for design verification. This phase may require simulations.
- Verify the design, set up pilot runs, implement the production process and hand it over to the process owner(s).
Quality management tools and methods used in Six Sigma
Within the individual phases of a DMAIC or DMADV project, Six Sigma utilizes many established quality-management tools that are also used outside of Six Sigma. The following table shows an overview of the main methods used.
|
|
Implementation roles
One key innovation of Six Sigma involves the “professionalizing” of quality management functions. Prior to Six Sigma, quality management in practice was largely relegated to the production floor and to statisticians in a separate quality department. Formal Six Sigma programs adopt a ranking terminology (similar to some martial arts systems) to define a hierarchy (and career path) that cuts across all business functions.
Six Sigma identifies several key roles for its successful implementation. Executive Leadership includes the CEO and other members of top management. They are responsible for setting up a vision for Six Sigma implementation. They also empower the other role holders with the freedom and resources to explore new ideas for breakthrough improvements.
- Champions take responsibility for Six Sigma implementation across the organization in an integrated manner. The Executive Leadership draws them from upper management. Champions also act as mentors to Black Belts.
- Master Black Belts, identified by champions, act as in-house coaches on Six Sigma. They devote 100% of their time to Six Sigma. They assist champions and guide Black Belts and Green Belts. Apart from statistical tasks, they spend their time on ensuring consistent application of Six Sigma across various functions and departments.
- Black Belts operate under Master Black Belts to apply Six Sigma methodology to specific projects. They devote 100% of their time to Six Sigma. They primarily focus on Six Sigma project execution, whereas Champions and Master Black Belts focus on identifying projects/functions for Six Sigma.
- Green Belts are the employees who take up Six Sigma implementation along with their other job responsibilities, operating under the guidance of Black Belts.
Some organizations use additional belt colours, such as Yellow Belts, for employees that have basic training in Six Sigma tools.
Certification
Corporations such as early Six Sigma pioneers General Electric and Motorola developed certification programs as part of their Six Sigma implementation, verifying individuals’ command of the Six Sigma methods at the relevant skill level (Green Belt, Black Belt etc.). Following this approach, many organizations in the 1990s starting offering Six Sigma certifications to their employees Criteria for Green Belt and Black Belt certification vary; some companies simply require participation in a course and a Six Sigma project. There is no standard certification body, and different certification services are offered by various quality associations and other providers against a fee. The American Society for Quality for example requires Black Belt applicants to pass a written exam and to provide a signed affidavit stating that they have completed two projects, or one project combined with three years’ practical experience in the body of knowledge. The International Quality Federation offers an online certification exam that organizations can use for their internal certification programs; it is statistically more demanding than the ASQ certification. Other providers offering certification services include the Juran Institute, Six Sigma Qualtec, Air Academy Associates and others.
Origin and meaning of the term “six sigma process”
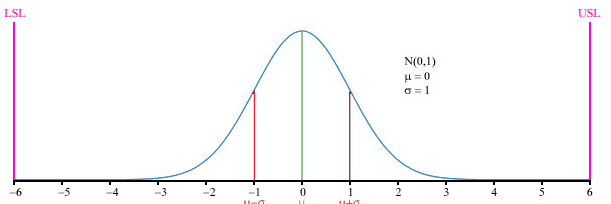
Graph of the normal distribution, which underlies the statistical assumptions of the Six Sigma model. The Greek letter σ (sigma) marks the distance on the horizontal axis between the mean, µ, and the curve’s inflection point. The greater this distance, the greater is the spread of values encountered. For the curve shown above, µ = 0 and σ = 1. The upper and lower specification limits (USL, LSL) are at a distance of 6σ from the mean. Because of the properties of the normal distribution, values lying that far away from the mean are extremely unlikely. Even if the mean were to move right or left by 1.5σ at some point in the future (1.5 sigma shift), there is still a good safety cushion. This is why Six Sigma aims to have processes where the mean is at least 6σ away from the nearest specification limit.
The term “six sigma process” comes from the notion that if one has six standard deviations between the process mean and the nearest specification limit, as shown in the graph, practically no items will fail to meet specifications. This is based on the calculation method employed in process capability studies.
Capability studies measure the number of standard deviations between the process mean and the nearest specification limit in sigma units. As process standard deviation goes up, or the mean of the process moves away from the center of the tolerance, fewer standard deviations will fit between the mean and the nearest specification limit, decreasing the sigma number and increasing the likelihood of items outside specification.
Role of the 1.5 sigma shift
Experience has shown that processes usually do not perform as well in the long term as they do in the short term. As a result, the number of sigmas that will fit between the process mean and the nearest specification limit may well drop over time, compared to an initial short-term study. To account for this real-life increase in process variation over time, an empirically-based 1.5 sigma shift is introduced into the calculation. According to this idea, a process that fits 6 sigma between the process mean and the nearest specification limit in a short-term study will in the long term only fit 4.5 sigma – either because the process mean will move over time, or because the long-term standard deviation of the process will be greater than that observed in the short term, or both.
Hence the widely accepted definition of a six sigma process is a process that produces 3.4 defective parts per million opportunities (DPMO). This is based on the fact that a process that is normally distributed will have 3.4 parts per million beyond a point that is 4.5 standard deviations above or below the mean (one-sided capability study). So the 3.4 DPMO of a six sigma process in fact corresponds to 4.5 sigma, namely 6 sigma minus the 1.5-sigma shift introduced to account for long-term variation. This allows for the fact that special causes may result in a deterioration in process performance over time, and is designed to prevent underestimation of the defect levels likely to be encountered in real-life operation.
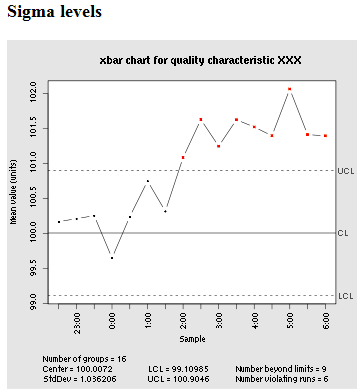
A control chart depicting a process that experienced a 1.5 sigma drift in the process mean toward the upper specification limit starting at midnight. Control charts are used to maintain 6 sigma quality by signaling when quality professionals should investigate a process to find and eliminate special-cause variation.
See also: Three sigma rule
The table below gives long-term DPMO values corresponding to various short-term sigma levels.
It must be understood that these figures assume that the process mean will shift by 1.5 sigma toward the side with the critical specification limit. In other words, they assume that after the initial study determining the short-term sigma level, the long-term Cpk value will turn out to be 0.5 less than the short-term Cpk value. So, for example, the DPMO figure given for 1 sigma assumes that the long-term process mean will be 0.5 sigma beyond the specification limit (Cpk = –0.17), rather than 1 sigma within it, as it was in the short-term study (Cpk = 0.33). Note that the defect percentages only indicate defects exceeding the specification limit to which the process mean is nearest. Defects beyond the far specification limit are not included in the percentages.
| Sigma level | DPMO | Percent defective | Percentage yield | Short-term Cpk | Long-term Cpk |
| 1 | 691,462 | 69% | 31% | 0.33 | –0.17 |
| 2 | 308,538 | 31% | 69% | 0.67 | 0.17 |
| 3 | 66,807 | 6.7% | 93.3% | 1.00 | 0.5 |
| 4 | 6,210 | 0.62% | 99.38% | 1.33 | 0.83 |
| 5 | 233 | 0.023% | 99.977% | 1.67 | 1.17 |
| 6 | 3.4 | 0.00034% | 99.99966% | 2.00 | 1.5 |
| 7 | 0.019 | 0.0000019% | 99.9999981% | 2.33 | 1.83 |
Software used for Six Sigma
List of Six Sigma software packages
Application
Main article: List of Six Sigma companies
Six Sigma mostly finds application in large organizations. An important factor in the spread of Six Sigma was GE’s 1998 announcement of $350 million in savings thanks to Six Sigma, a figure that later grew to more than $1 billion. According to industry consultants like Thomas Pyzdek and John Kullmann, companies with fewer than 500 employees are less suited to Six Sigma implementation, or need to adapt the standard approach to make it work for them. This is due both to the infrastructure of Black Belts that Six Sigma requires, and to the fact that large organizations present more opportunities for the kinds of improvements Six Sigma is suited to bringing about.
Criticism
Lack of originality
Noted quality expert Joseph M. Juran has described Six Sigma as “a basic version of quality improvement”, stating that “there is nothing new there. It includes what we used to call facilitators. They’ve adopted more flamboyant terms, like belts with different colors. I think that concept has merit to set apart, to create specialists who can be very helpful. Again, that’s not a new idea. The American Society for Quality long ago established certificates, such as for reliability engineers.”
Role of consultants
The use of “Black Belts” as itinerant change agents has (controversially) fostered an industry of training and certification. Critics argue there is overselling of Six Sigma by too great a number of consulting firms, many of which claim expertise in Six Sigma when they only have a rudimentary understanding of the tools and techniques involved.
Potential negative effects
A Fortune article stated that “of 58 large companies that have announced Six Sigma programs, 91 percent have trailed the S&P 500 since”. The statement was attributed to “an analysis by Charles Holland of consulting firm Qualpro (which espouses a competing quality-improvement process).” The summary of the article is that Six Sigma is effective at what it is intended to do, but that it is “narrowly designed to fix an existing process” and does not help in “coming up with new products or disruptive technologies.” Advocates of Six Sigma have argued that many of these claims are in error or ill-informed. A BusinessWeek article says that James McNerney’s introduction of Six Sigma at 3M had the effect of stifling creativity and reports its removal from the research function. It cites two Wharton School professors who say that Six Sigma leads to incremental innovation at the expense of blue skies research. This phenomenon is further explored in the book, Going Lean, which describes a related approach known as lean dynamics and provides data to show that Ford’s “6 Sigma” program did little to change its fortunes.
Based on arbitrary standards
While 3.4 defects per million opportunities might work well for certain products/processes, it might not operate optimally or cost effectively for others. A pacemaker process might need higher standards, for example, whereas a direct mail advertising campaign might need lower standards. The basis and justification for choosing 6 (as opposed to 5 or 7, for example) as the number of standard deviations is not clearly explained. In addition, the Six Sigma model assumes that the process data always conform to the normal distribution. The calculation of defect rates for situations where the normal distribution model does not apply is not properly addressed in the current Six Sigma literature.
Criticism of the 1.5 sigma shift
The statistician Donald J. Wheeler has dismissed the 1.5 sigma shift as “goofy” because of its arbitrary nature. Its universal applicability is seen as doubtful.The 1.5 sigma shift has also become contentious because it results in stated “sigma levels” that reflect short-term rather than long-term performance: a process that has long-term defect levels corresponding to 4.5 sigma performance is, by Six Sigma convention, described as a “six sigma process.” The accepted Six Sigma scoring system thus cannot be equated to actual normal distribution probabilities for the stated number of standard deviations, and this has been a key bone of contention about how Six Sigma measures are defined. The fact that it is rarely explained that a “6 sigma” process will have long-term defect rates corresponding to 4.5 sigma performance rather than actual 6 sigma performance has led several commentators to express the opinion that Six Sigma is a confidence trick.