The standard error (SE) is a mathematical technique used to quantify variability in statistics. It is a statistical term that uses standard deviation to determine the accuracy with which a sample distribution represents a population. The standard error of the mean is the term used when the statistic is the sample mean (SEM). The standard deviation of a given sample may be estimated using SE. Repeated sampling from the same population and recording of the sample means yields the sampling distribution of a mean.
In statistics, a sample mean differs from the population’s real mean; this difference is known as the standard error of the mean. The SE method is used to calculate a sample’s efficiency, accuracy, and consistency. In other words, it assesses the degree to which a sampling distribution accurately represents a population. The variance of the sampling distribution produced is equal to the variance of the population divided by the sample size, as calculated mathematically. Because sample means cluster more closely around the population mean as the sample size grows, this is the case.
The variance between the computed population means and one that is regarded as known or recognized as accurate might be included in the standard error. It has applications in both statistics and economics. It’s particularly valuable in econometrics, where researchers utilize it to do regression analysis and hypothesis testing. As a result, the standard error of the mean and the standard deviation are related in such a way that the standard error of the mean equals the standard deviation divided by the square root of the sample size for a given sample size.
SE is also employed in inferential statistics, where it provides the foundation for building confidence intervals. To put it another way, the standard error of the mean is a measure of how much sample means differ from the population mean. The standard error tends to be less the more data points are involved in the mean computation. In the area of statistics, some widely used metrics include:
- Standard error of the mean (SEM)
- Standard error of the variance
- Standard error of the median
- Standard error of a regression coefficient
The word “standard error” in regression analysis refers to either the square root of the reduced chi-squared statistic or the standard error for a specific regression coefficient (as used in, say, confidence intervals). The standard error and standard deviation are related in such a way that the standard error equals the standard deviation divided by the square root of the sample size for a given sample size. When the sample size is small, utilizing the sample standard deviation rather than the real population standard deviation will lead to a systematic underestimation of the population standard deviation, and therefore the standard error.
The SEM is calculated using the following formula:
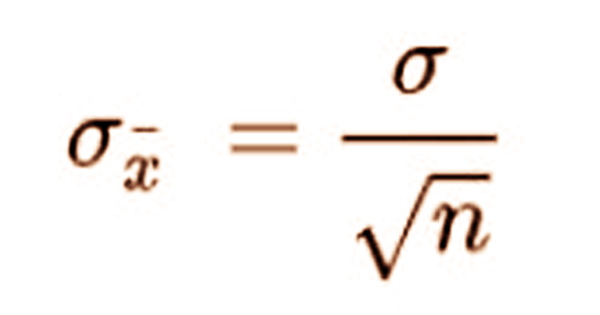
Where:
- σ – Population standard deviation
- n – Sample size, i.e., the number of observations in the sample
The standard error is also inversely related to the sample size; the greater the sample size, the lower the standard error, as the statistic approaches the true value. Given the concept of variance and certain basic characteristics, the standard error on the mean may be calculated from the variance of a set of independent random variables. When statisticians don’t know what the population standard deviation is, they use the sample standard deviation as a near substitute.
The following formula can be used to determine SEM. One of the most important assumptions is that the sample’s observations are statistically independent.
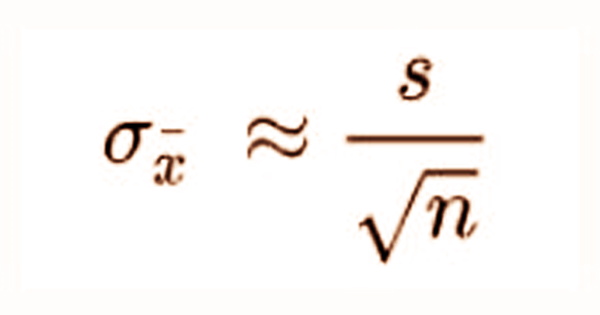
Where:
- s – Sample standard deviation
- n – Sample size, i.e., the number of observations in the sample
The standard error is a type of inferential statistic that is used to make inferences. Within a dataset, it indicates the standard deviation of the mean. This provides a measurement for the spread and acts as a measure of variance for random variables. The real value of is unknown in many practical situations. The standard deviation of the Student t-distribution is the standard error. T-distributions are slightly different from Gaussian distributions, and their size varies depending on the sample size.
When a sample of data from a population is extracted and the sample mean is determined, it is used to estimate the population means. Small samples are more likely to underestimate the population standard deviation and have a mean that differs from the real population mean, and the Student t-distribution adjusts for this with thicker tails than a Gaussian distribution. The sample means will very definitely differ from the population mean. It will assist the statistician in determining the magnitude of the variance. It is here that the standard error of the mean comes into play.
It is sufficient to use the sample standard deviation “s” instead of to estimate the standard error of a Student t-distribution, and we can use this number to generate confidence intervals. The standard error of the mean is simply the standard deviation of distinct sample means from the population mean when numerous random samples are taken from a population. The variance between the computed population means and one that is regarded as known or recognized as accurate might be included in the standard error.
However, the statistician may not always have access to many samples. Fortunately, a single sample may be used to determine the standard error of the mean. It’s computed by multiplying the square root of the sample size by the standard deviation of the observations in the sample. The data is deemed to be more reflective of the real mean when the standard error is minimal. The data may have some noticeable abnormalities if the standard error is significant.
The standard deviation of the sample is the degree to which individuals within the sample deviate from the sample mean, whereas the standard error of the sample mean is an estimate of how much the sample mean is expected to range from the population mean. Based on the amount of data points shown at each level of standard deviation, the standard deviation is used to assist assess the quality of the data. By examining variation within the means, standard errors may be used to assess the accuracy of a single sample or several samples.
Information Sources: