Executive Summery
British American Tobacco Bangladesh Company Limited started its business as a corporate identity of British American Tobacco Group, which was previously known as Bangladesh Tobacco Company and after liberation it renamed itself as British American Tobacco.
The Food and allied industry is very competitive with intense intra industry rivalry among the companies. The threats of new entrants, threats of substitute are very low. Power of buyer is quite low but suppliers groups are enjoying the benefit of strong and favorable bargaining power.
British American Tobacco Bangladesh Company has a bit abnormality in the recent years. They have declared a large number of dividends and have created a leap in the flow. We have seen the growth rate to fall and the retention rate as well. However the performance of the company in the overall industry was a big success. In the time of recession the firm has shown promise in their performance, which indicates a lower level risk involved in the security with high return.
INTRODUCTION
Origin of the report
This report has been made as a part of my course Intermediate Accounting; Mrs. Jafrin Sultana has assigned us this report in order to gain some practical knowledge about how to conclude on investment decision and analysis on the basis of Top Down approach. The perspective of such a report is to make us familiar with the key factors of security market that affect the users in decision making. For this purpose I have chosen the annual report of British American Tobacco Bangladesh Company Limited, and try to analyze and understand the components according to my best effort.
Objective of the study
The objective of the study is to apply the theoretical knowledge in the practice field. Therefore the objective behind conducting this study is as follows:
- The main objective of this report is to find out the company’s overall position through its annual report
- To find out the prospect of the company for investment decision making
- To conclude some findings and some possible recommendation for an investor who wants to invest in the share of BAT Bangladesh.
Methodology of the Report
We have collected the necessary and relevant data from different secondary sources. These sources are mentioned below –
Annual report of the British American Tobacco Bangladesh Company Limited 2008-2012
Different websites
Records from DSE library
Interview with investor.
Limitations of the study
The limitations of the study are defined by the extensive of the facts covered by the study and those that left out. However, these limitations can be presented in the following lines:
The first limitation is the lack of intellectual thought and analytical ability to make it the most perfect one.
We have to offset with the quality due to time constraint.
The analysis is based on complicated data, so it has become difficult to draw a complete figure.
As we have to conclude the report by giving an recommendation whether to invest in the company or not, that required an intellectual and experienced opinion, may not be defensive up to some extent
While attempting to analyze the performance many data were missing, we found it rare to make it consistent with theoretical formula.
Industry analysis
Industry at a glance
We do industry analysis because we believe it helps us to isolate investment opportunities that have favorable return-risk characteristics. We are doing it as part of our three-step, top-down plan for valuing individual companies and selecting stocks for inclusion in our portfolio. There are 12 industry category are listed in the stock market in Bangladesh. Our main concern is for the food industry. As per the industry analysis we also concentrated on the five major categories of industries. They are
1. Bank
2. Engineering
3. Food & Allied
4. Pharmaceuticals & Chemicals
5. Textile
Cross sectional industry performance
Cross sectional analysis consist of the overall condition of different industry. To find out the rates of return among different industries varied during a given time period, we compared the performance of alternative industries during a specific time period.
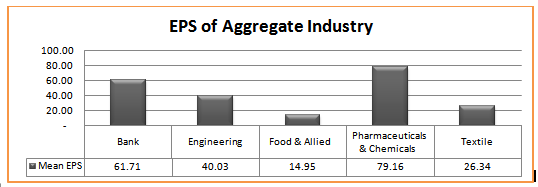
In the below graph we can see the conditions of the industries at a glance. Here Pharmaceuticals and Chemicals have the highest statue among the other industries on the basis of EPS.
The EPS ratio on the particular companies of Pharmaceuticals and Chemicals industry has higher average rate then the companies of other industries.
| Industry | Mean EPS |
| Bank | 61.71 |
| Engineering | 40.03 |
| Food & Allied | 14.95 |
| Pharmaceuticals & Chemicals | 79.16 |
| Textile | 26.34 |
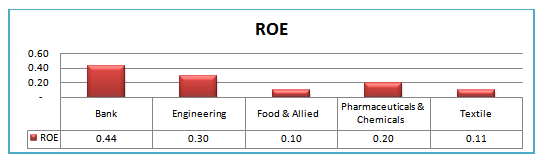
| Industry | Return On Equity |
| Bank | 0.44 |
| Engineering | 0.30 |
| Food & Allied | 0.10 |
| Pharmaceuticals & Chemicals | 0.20 |
| Textile | 0.11 |
On the perspective of the ROI Bank has the utmost advantage. The return for equity is higher in the bank sector. Comperatively the profit for Bank on an overall basis is higher then other sectors.
Industry performance over time
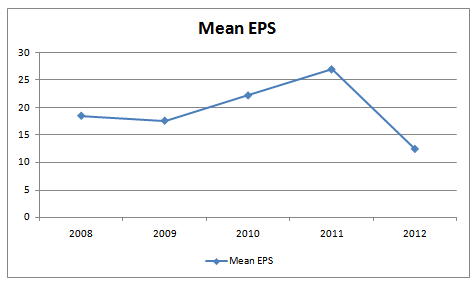
The industry performance takes different shape over the time of its activity. It is not necessary for the industry to perform at the same pace every year. Thus, as over the time analysis shows an easier way to realize the actual growth or decline.
In the food industry, the graph shows an elaborate performance condition. Due to the decrease in the profit margin of different companies in the year of 2009 the graph has taken a negative dive. So the industry as a whole has declined in the last except the preceding years.
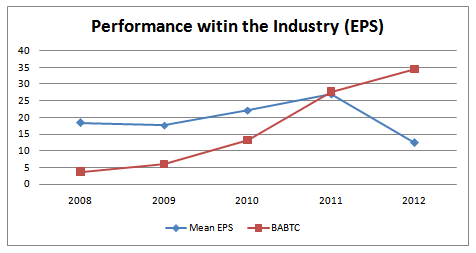
Performance of the company with in industry
Even though the profit margin of the industry as an aggregate measure has taken a declining position, The British American Tobacco continued its growth. If we look at the graph bellow we can say it with certainty. The reason for this difference is that, BATBC didn’t follow the pattern of food industry. As a part of tobacco industry, its value stands apart from the overall industry.
The business cycle and the industry sectors
Economic trends can and do affect industry performance. By identifying and monitoring key assumptions and variables, we can monitor the economy and gauge the implications of new information on our economic outlook and industry analysis. Recall that in order to “beat the market” on a risk-adjusted basis, we must have forecasts that differ from the market consensus and we must be correct more often than not.
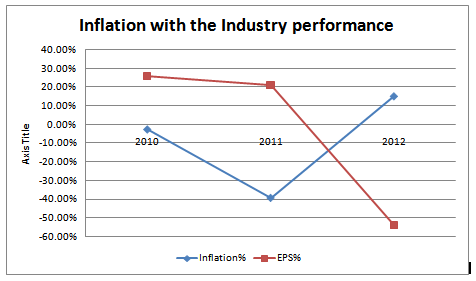
Inflation
Higher inflation is generally negative for the stock market, because it causes higher market interest rates, it increases uncertainty about future prices and costs, and it harms firms that cannot pass their cost increases on to consumers. Although, some industries benefit from inflation but food sector is excluded from them.
The graph bellow shows the Graphical presentation of the effect.
| Year | Inflation | Inflation % | EPS | EPS % |
| 2009 | 9.11 | 17.684 | ||
| 2010 | 8.9 | -2.31% | 22.292 | 26.06% |
| 2011 | 5.42 | -39.10% | 27.048 | 21.34% |
| 2012 | 6.26 | 15.50% | 12.516 | -53.73% |
Interest rate
High interest rate is often good for several industries. Risk and the return depend highly on it. Based on the different bank rate for corporate short term and long term loan, the average of interest for interest sector is 13%.
International economics
Bangladesh food industry deals with large number of exporting business in the international market. Hence, it brings a lot of foreign currency. For instance BATBC exports quality leaf to its parent company which is grown in.
Consumer sentiment
BATBC has been able to maintain a unique product at a premium cost that a customer will pay willingly. It has been serving the mass people of the country. As the production is in a large scale we can say it is having economies of scale. It is frequently trying to bring new products for the customers. It has a much diversified product line with frequent research and development to improve product quality and to offer innovative products according to customers taste. So, they are mainly following the Differentiation strategy rather than Cost Leadership. Besides the brand value of BATBC has made the customers less price sensitive as they emphasize more on the brand value.
Structural economic changes and alternative industries
Demographic
Demography is the study of human population in terms of size, density, location, age, gender, race occupation and other statistics.
A large number of people in the world like smoking either in various location or occupation, at different age. It does not depend on classification of gender. But in our country, Tobacco Company target mainly adult person like male individuals and so as the young person who like smoking. Based on income level BATBC produce different types of cigarettes.
Lifestyle
Lifestyle also influences our tobacco industry. At this modern era smoking is the common phenomena and many people take smoking as of their class lifestyle. So the tobacco industry always try to offer that kinds of product which must be consistent with their lifestyle.
Technology
There are over 18,000 different food items in today’s supermarkets, which are processed to a greater or lesser degree, and thousands of new products are introduced each year. These products need different kinds of processing.
Mostly used technologies in food sectors are- Refrigeration, freezing, drying, control of water activity, microbiological spoilage, enzymatic degradation, chemical degradation, Pasteurization, Sterilization (canning),Cleaning and sanitizing, Membrane processing, Mixing, Fluid flow, Size reduction (homogenization), Heat transfer (heating), Fluid flow, Heat transfer (cooling), Mass transfer (conversion of water to vapor during drying),etc.
Tobacco industries use some technologies of food industries but it also follows some other technologies. These technologies are:
Filter pellet technology, cigarette menthol, etc.
Policies and regulation
Smoke-free environments: Bangladesh has a complete smoking ban in healthcare facilities and educational facilities. Smoking is also banned in other workplaces and public places, however the law allows for designated smoking areas.
Advertising, promotion and sponsorship: Bangladesh does not have a comprehensive national ban on advertising, promotion and sponsorship. Tobacco companies are permitted to advertise through international print media, at point-of-sale, and on the Internet among other mediums.
Warning labels: Warnings are text-only and cover 30 percent of the front and back of packages. Warnings are not applied to smokeless tobacco products.
Tobacco taxes: Tobacco taxes in Bangladesh are below the rate recommended by the World Bank (from 65 percent to 80 percent of retail price) that is commonly present in countries with effective tobacco control policies. Bidis in particular are available at very low prices.
Evaluating the industry life cycle
Life cycle means the normal stages that a product passes through: research and development, growth, expansion, maturity, saturation, and decline. In the research stage, there are no sales at all. In the growth stage, sales are slow and often need to be supplemented by heavy sales and advertising efforts. In the expansion stage, sales may grow more rapidly. In the maturity stage, sales start slowing down as most people who might want the product already has it. In the saturation stage, everyone who wants the product has it, and there are few opportunities for increasing sales. In the decline stage, sales fall and the product eventually becomes obsolete.
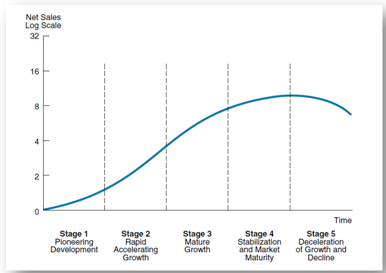
The overall growth of the economy in Bangladesh is 6.2%. And compare to that the profit margin for food industry has risen to 21% in a year. By considering the last few years earning per share of food industries and as well as the tobacco industry, we found the gradually increase in the earning per share. So, we assume that this industry still is on its mature growth stage.
Analysis of Industry Competition
Diamond model from the Porter five forces model
The diamond model is an economical model developed by Michael Porter in his book The Competitive Advantage of Nations, where he published his theory of why particular industries become competitive in particular locations .The diamond model of Michael Porter for the competitive advantages of nations offers a model that can help understand the competitive position of a nation in a global competition.
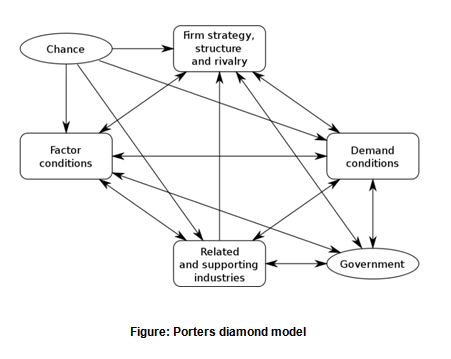
The approach looks at clusters of industries, where the competitiveness of one company is related to the performance of other companies and other factors tied together in the value-added chain, in customer-client relation, or in local or regional contexts. The Porter analysis was made in two steps. First, clusters of successful industries have been mapped in 10 important trading nations. In the second, the history of competition in particular industries is examined to clarify the dynamic process by which competitive advantage was created. The second step in Porter’s analysis deals with the dynamic process by which competitive advantage is created. The basic method in these studies is historical analysis. The phenomena that are analyzed are classified into six broad factors incorporated into the Porter diamond, which has become a key tool for the analysis of competitiveness:
- Factor conditions are human resources, physical resources, knowledge resources, capital resources and infrastructure. Specialized resources are often specific for an industry and important for its competitiveness. Specific resources can be created to compensate for factor disadvantages.
- Demand conditions in the home market can help companies create a competitive advantage, when sophisticated home market buyers pressure firms to innovate faster and to create more advanced products that those of competitors.
- Related and supporting industries can produce inputs which are important for innovation and internationalization. These industries provide cost-effective inputs, but they also participate in the upgrading process, thus stimulating other companies in the chain to innovate.
- Firm strategy, structure and rivalry constitute the fourth determinant of competitiveness. The way in which companies are created, set goals and are managed is important for success. But the presence of intense rivalry in the home base is also important; it creates pressure to innovate in order to upgrade competitiveness.
- Government can influence each of the above four determinants of competitiveness. Clearly government can influence the supply conditions of key production factors, demand conditions in the home market, and competition between firms. Government interventions can occur at local, regional, national or supranational level.
- Chance events are occurrences that are outside of control of a firm. They are important because they create discontinuities in which some gain competitive positions and some lose.
The Porter thesis is that these factors interact with each other to create conditions where innovation and improved competitiveness occurs.
Estimating Industry rates of return
Valuation using the Reduced Form DDM
Pi = the price of industry i at time t
D1 = expected dividend for industry i in period 1 equal to D0 (1 + g)
k = the required rate of return on the equity for industry i
g = the expected long-run growth rate of earnings and dividend for industry i
=0.1420 or 14.20%
Industry valuations using the Free Cash Flow to Equity
CAPM = Rf+(Rm-Rf)β
= 0.05 + (0.219 – 0.05) .461
= 12.8%
Industry Analysis using the relative valuation approach
The Price /Book Value Ratio
| AVG Price (6 month) | BV | P/BV Ratio | |
| BATBC | 319.97 | 86.03 | 3.72 |
| Bangas | 2536.63 | 164.78 | 15.39 |
| Gemini | 1372.79 | -110.18 | -12.46 |
| Apex Food | 1212.58 | 317.11 | 3.82 |
| AMCL (Pran) | 1504.13 | 370.21 | 4.06 |
| AVG P/BV of the industry | 2.91 | ||
The Price/Equity Ratio
| AVG Price (6 month) | EPS | P/E Ratio | |
| BATBC | 319.97 | 25.71 | 12.45 |
| Bangas | 2536.63 | 12.03 | 210.86 |
| Gemini | 1372.79 | 27.09 | 50.68 |
| Apex Food | 1212.58 | 9.25 | 131.09 |
| AMCL (Pran) | 1504.13 | 17.03 | 88.32 |
| AVG P/E of the industry | 98.68 | ||
Financial Analysis
Financial Statement Analysis
Income Statement
To understand the pattern or flow of operating activity, company’s marginal income, overhead cost management, more easily we present the income statement as a percentage of sales. Before 2007 BAT Bangladesh used to include its operating expenses under cost of sales. So instead of gross profit it is better to analyses the net operating profit before Interest and tax. There is a rise in the net operating profit as well as a decrease in the total cost over 5 years of period, though the supplementary duty has been raised. However profit after tax is increase in last two years. For investment purpose it is very important to get a proper bottom line so that dividend can be distributed.
| 2012 | 2011 | 2010 | 2009 | 2008 | |
| Gross Turnover | 100.00% | 100.00% | 100.00% | 100.00% | 100.00% |
| Supplementary duty and VAT | 68.09% | 69.11% | 68.49% | 68.49% | 68.62% |
| Net turnover /Sales | 31.91% | 30.89% | 31.51% | 31.51% | 31.38% |
| Cost of sales | 20.82% | 19.82% | 22.15% | 29.19% | 29.40% |
| Gross profit | 11.10% | 11.08% | 9.36% | 2.32% | 1.98% |
| Operating Expenses | 5.82% | 6.03% | 5.92% | 0.00% | 0.00% |
| Net operating profit before Interest and tax | 5.28% | 5.04% | 3.44% | 2.32% | 1.98% |
| Interest | |||||
| Net finance income | 0.06% | 0.17% | -0.12% | 0.00% | 0.00% |
| 5.34% | 5.21% | 3.32% | 0.00% | 0.00% | |
| Workers profit participation fund | 0.27% | 0.26% | 0.00% | 0.00% | 0.00% |
| Profit before Tax | 5.07% | 4.95% | 3.32% | 1.86% | 1.53% |
| Tax | |||||
| Current tax | 1.44% | 1.44% | 1.11% | 0.75% | 0.51% |
| Deferred tax | -0.12% | -0.16% | 0.10% | 0.08% | 0.23% |
| profit after tax transfer to revenue reserve | 3.76% | 3.67% | 2.11% | 1.03% | 0.79% |
| Earnings per share | 0.00% | 0.00% | 0.00% | 0.00% | 0.00% |
Balance sheet
| 2012 | 2011 | 2010 | 2009 | 2008 | |
| ASSETS | |||||
| Non Current assets | |||||
| Property, plant and equipment | 32% | 35% | 46% | 54% | 62% |
| Current assets | |||||
| Inventories | 30% | 27% | 28% | 28% | 27% |
| Trade and other receivables | 4% | 9% | 4% | 7% | 6% |
| Advance, deposits and prepayments | 18% | 13% | 11% | 2% | 2% |
| Cash and Cash equivalents | 17% | 17% | 11% | 8% | 4% |
| Total Current Assets | 68% | 65% | 54% | 46% | 38% |
| Total Assets | 100% | 100% | 100% | 100% | 100% |
| EQUITY AND LIABILITIES | |||||
| Equity | |||||
| Share Capital | 5% | 6% | 7% | 8% | 9% |
| Revenue reserve | 37% | 39% | 33% | 23% | 21% |
| Capital Reserve | 1% | 1% | 1% | 3% | 3% |
| Proposed final dividend | 2% | 3% | |||
| Tax Holiday reserve | 2% | ||||
| 43% | 45% | 41% | 36% | 37% | |
| Non-current liabilities | |||||
| Deferred liability (gratuity) | 2% | 2% | 3% | 5% | 5% |
| Deferred Tax liability | 3% | 4% | 6% | 6% | 6% |
| Obligation under finance lease | 0% | 0% | 0% | 0% | 0% |
| 5% | 6% | 9% | 12% | 12% | |
| Current liabilities | |||||
| Creditors and accruals | 33% | 33% | 37% | 38% | 37% |
| Provision for corporate tax | 19% | 15% | 13% | 3% | 2% |
| Bank overdraft | 0% | 0% | 0% | 0% | 1% |
| Short term Bank loans | |||||
| 52% | 48% | 50% | 52% | 51% | |
| Total equity and liabilities | 100% | 100% | 100% | 100% | 100% |
Statement of Cash flow
| 2012 | 2011 | 2010 | |
| Cash flow from operating activities: | |||
| Collection from distributors, leaf export and others | 55,088,259 | 45,346,821 | 38,142,226 |
| Payment for costs and expenses | (15,102,417) | (12,893,748) | (10,367,305) |
| Supplementary duty and vat paid | (36,832,044) | (30,568,019) | (25,932,877) |
| Cash generated from operation | 3,153,798 | 1,885,054 | 1,842,044 |
| Interest tax paid | (623,061) | (517,245) | (277,510) |
| Interest (paid)/ Income | 32,213 | 76,212 | (45,573) |
| 2,562,950 | 1,444,021 | 1,518,961 | |
| Cash flows from investing activities | |||
| Acquisition of property, plant and equipment | (836,202) | (271,211) | (231,467) |
| Proceeds from sale of property, plant and equipment | 20,876 | 692 | 8,692 |
| Net cash used in investing activities | (815,326) | (270,519) | (222,775) |
| Cash flows from financing activities | |||
| Net short term bank loan received/(repayment) | (800,000) | ||
| Net proceeds from obligator under finance lease | 10,015 | 5,549 | (5,104) |
| Dividend paid | (1,435,940) | (418,288) | (179,514) |
| Net cash used in financing activities | (1,425,925) | (412,739) | (984,618) |
| Net increase/(decrease) in cash and cash equivalents for the year | 321,699 | 760,763 | 311,568 |
| Cash and cash equivalent at the beginning of the year | 1,678,466 | 917,703 | 606,135 |
| Cash and cash equivalent at the end of the year | 2,000,165 | 1,678,466 | 917,703 |
Analysis of Financial Ratio
| 2012 | 2011 | 2010 | 2009 | 2008 | ||
| Information for – Ratio analysis | ||||||
| Net Sales | 17576490 | 14030386 | 11933459 | 11025381 | 9260514 | |
| Average Equity | 4,847,837 | 3,909,165 | 3,004,446 | 2,633,325 | 2,679,818 | |
| Net Income | 2,068,566 | 1,668,778 | 798,971 | 361,583 | 232,882 | |
| Average Assets | 14,266,713 | 14,447,672 | 9,964,750 | 7,241,551 | 3,467,542 | |
| ROE | 43% | 43% | 27% | 14% | 9% | |
| ROA | 14% | 12% | 8% | 5% | 7% | |
| ROS | 12% | 12% | 7% | 3% | 3% | |
| Internal liquidity Ratios | ||||||
| 1. Current ratio | 1.31 | 1.35 | 1.08 | 0.88 | 0.74 | |
| 2. Quick ratio | 0.74 | 0.79 | 0.52 | 0.34 | 0.22 | |
| 3. Cash ratio | 0.32 | 0.35 | 0.23 | 0.15 | 0.07 | |
| Operating Profitability Ratios | ||||||
| Gross profit margin | 34.78% | 35.86% | 29.70% | 7.36% | 6.30% | |
| Operating profit margin | 16.55% | 16.33% | 10.91% | 7.36% | 6.30% | |
| Net profit margin | 11.77% | 11.89% | 6.70% | 3.28% | 2.51% | |
| Operating Efficiency Ratios | ||||||
| Total Asset Turnover | 1.23 | 0.97 | 1.20 | 1.52 | 2.67 | Times |
| Net Fixed Asset Turnover | 4.61 | 4.05 | 3.23 | 2.69 | 2.14 | Times |
| Equity Turnover | 3.63 | 3.59 | 3.97 | 4.19 | 3.46 | Times |
| Solvency Ratios | ||||||
| i. Receivables Turnover | 25.67 | 24.55 | 28.71 | 23.32 | Times | |
| 1. Average Receivable Collection Period | 14 | 15 | 13 | 16 | Days | |
| ii. Inventory Turnover | 3.64 | 3.63 | 3.86 | 5.16 | Times | |
| 2. Average Inventory Processing Period | 100 | 101 | 95 | 71 | Days | |
| iii. Payables Turnover Ratio | 3.19 | 2.90 | 2.89 | 3.75 | Times | |
| 3. Cash Conversion Cycle Payables Payment Period | 114 | 126 | 126 | 97 | Days | |
Internal liquidity Ratios
In internal liquidity ratios there are Current ratio, Quick ratio and Cash ratio which shows the condition of the liquidity of the organization in terms of liquidity. They have a progressive state in the years to come.
Operating Profitability Ratios
Before 2007 their annual report used to show the operating expenses under cost of sales, as a result the gross profit margin is significantly lower in 2005 and 2006 compare to the rest. However if we analyze the table the fact reveal that, the turnover across last 5 years has increased tremendously. The reason behind this might be an increase in the per unit selling price of their consumer product. Whatever the fact is, their Net Income tends to increase gradually and for the last two years maintaining a sustainable position.
Operating Efficiency Ratios
This is an indicator for management’s performance in the operations of business. The main emphasis remains on the utilization of the organization’s resources. There are two categories for evaluation this portion. In addition the calculation is also done on the basis of equity as well. BATBC also has a progressive trend in this portion as well
Solvency Ratios
This ratio is a qualitative analysis of a firm’s marketing and credit policy and debtors realizations. In other words, if the firm sells goods on credit, the realization of sells revenue is delayed and the receivables (both debtors and/or bills) are created. It is calculated to know the uncollected portion of credit sales in the form of debtors by establishing relationship between trade debtors & net credit sales of the business. Higher the value of debtors’ turnover, the more efficient is the management of debtors. An increase in this ratio is an indication of firm’s marketing superiority and efficiency in credit realization.
On the other hand Average collection period shows the time in which the customers are paying for credit sales. A higher debt collection period is thus, an indication of the inefficiency and negligence on the part of management. On the other hand, if there is decrease in debt collection period, it indicates prompt payment by debtors which reduces the chance of bad debts
The Account receivable turnover on an average is low (ranges from 0.02-0.06).That mean company face trouble in collection receivable. In last year it is to low, this is not expected. Comparatively it was good in 2008 of 0.06 but with high collection period. This situation indicates high risk of bad debts and so the higher the expenses of collections and decreases the liquidity of the firm. Company should be concerned about the sales policy to be more efficient
Risk Analysis
Business risk
Sales Variability is the prime determinant of earnings variability. In turn, the variability of sales is mainly caused by a firm’s industry and is largely outside the control of management.
| 2008 | 2009 | 2010 | 2011 | 2012 | |
| Sales | 29,508,675 | 34,994,149 | 37,869,293 | 45,414,187 | 55,074,651 |
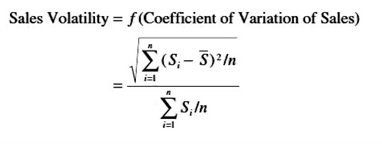
| Mean | 40572191 |
| Variance | 98646966937510.00 |
| SD | 9932117.95 |
| Sales Volatility | 0.24 |
Analysis of Growth Potential
| 2008 | 2009 | 2010 | 2011 | 2012 | |
| Operating income after tax | 232,882 | 361,583 | 798,971 | 1,668,778 | 2,068,566 |
| Dividend | 30% | 30% | 70% | 240% | 300% |
| Retention Rate | 70% | 70% | 30% | -140% | -200% |
| ROE | 9% | 14% | 27% | 43% | 43% |
| Growth Rate | 6.08% | 9.61% | 7.98% | -59.77% | -85.34% |
The analysis of sustainable growth potential examines ratios that indicate how fast a firm should grow. Analysis of a firm’s growth potential is important for both lenders and owners. Creditors also are interested in a firm’s growth potential because the firm’s future success is the major determinant of its ability to pay obligations, and the firm’s future success is influenced by its growth. The growth of business, like the growth of any economic entity, including the aggregate economy, depends on
1. The amount of resources retained and reinvested in the entity, and
2. The rate of return earned on the resources retained and reinvested.
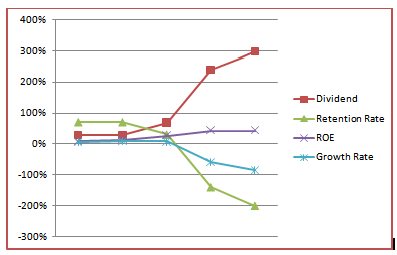
Due to the high rate of dividend declared the growth has decreased in the present year. It has also effected the retention rate.
Comparative Analysis
The importance of ROE as an indicator of performance makes it desirable to divide the ratio into several components that provide insights into the causes of a firm’s ROE or any changes in it. This breakdown of ROE into component ratios is generally referred to as the DuPont system. To begin, the return on equity (ROE) ratio can be broken down into two ratios that we have discussed—net profit margin and equity turnover. This breakdown is an identity because we have both multiplied and divided by net sales. To maintain the identity, the common equity value used is the year-end figure rather than the average of the beginning and ending value.
| 2012 | 2011 | 2010 | 2009 | 2008 | |
| Profit Margin | 0.117689 | 0.11894 | 0.066952 | 0.032796 | 0.025148 |
| Total Asset Turnover | 1.462323 | 1.404678 | 1.484294 | 1.460699 | 1.335314 |
| Financial Leverage | 2.328416 | 2.203201 | 2.447602 | 2.770814 | 2.727628 |
| ROE | 0.40072 | 0.368095 | 0.243235 | 0.132734 | 0.091594 |
It shows that BATBC generally increased their profit margin in the last tow years. However for higher financial leverage last year’s performance was better.
Company analysis
Nature of the company and stock
1. BATBC Ltd.is a public limited company incorporated in Bangladesh.
2. BATBC is a food and beverage types of company.
3. It is listed in the Stock Exchange Securities.
4. BATBC have category“A” share in the stock market.
Influence of the economic and industry condition
Different organizational strategy
In case of BATBC we see that, it has been able to maintain a unique product at a premium cost that a customer will pay willingly. It has been serving the mass people of the country. As the production is in a large scale we can say it is having economies of scale. It is frequently trying to bring new products for the customers. It has a much diversified product line with frequent research and development to improve product quality and to offer innovative products according to customers taste. So, they are mainly following the Differentiation strategy rather than Cost Leadership. Besides the brand value of BATBC has made the customers less price sensitive as they emphasize more on the brand value.
SWOT analysis
Strengths:
- Strong brand image.
- Adequate financial resources.
- Well thought of by buyers
- An acknowledged market leader.
- Well –conceived functional area strategies.
- Insulated from strong competitive pressures.
- Proven management.
- Better manufacturing capability.
- Superior technological skills.
10. Strong distribution network.
Weakness:
- Lack of advertisement.
- Higher overall unit costs relative to key competitors.
Opportunities:
- Serve additional customer group.
- Enter new markets and segments.
- Expand product line to meet broader range of customer needs.
Threats:
- Restriction imposed by the government.
- Entry of lower-cost foreign competitors
- Rising sales of substitute product
- Lack of raw materials
Stock Valuation
DDM
Pi = the price of industry i at time t
D1 = expected dividend for industry i in period 1 equal to D0 (1 + g)
k = the required rate of return on the equity for industry i
g = the expected long-run growth rate of earnings and dividend for industry i
=0.333574 or 33.36%
CAPM = Rf+(Rm-Rf)β
= 0.05 + (0.219 – 0.05) .414
= 12%
Relative Valuation
The Price /Book Value Ratio
| AVG Price (6 month) | BV | P/BV Ratio | |
| BATBC | 319.97 | 86.03 | 3.72 |
The Price/Equity Ratio
| AVG Price (6 month) | EPS | P/E Ratio | |
| BATBC | 319.97 | 25.71 | 12.45 |
Measures of Value Added
In addition to DDM, there has been growing interest in a set of performance measures referred to as “value added” measures. These value added measures of performance are
directly considering economic profit. There are two main considerations of value added measures as:
- Economic value added (EVA), and
- Market value added (MVA).
Economic Value Added
EVA is closely related to the net present value (NPV) technique where we can evaluate the expected performance of an investment by discounting its future cash flows at the firm’s WACC and when there is positive NPV, it implies that it will add to the value of the firm. In EVA, the evaluation of the annual performance of management is done by comparing the firm’s net operating profit less adjusted taxes to the firm’s total cost of capital in dollar terms, including the cost of equity.
Market Value Added
In contrast to EVA, which generally is an evaluation of internal performance, MVA is a measure of external performance-how the market has evaluated the firm’s performance in terms of the market value of debt and market value of equity compared to the capital invested in the firm.
Market Value Added (MVA) = (Market Value of Firm)-Capital-Market Value of Debt
–Market Value of Equity
Sensitivity Analysis
| Change in Sales | |||
| Base | 10% Increase | 10% Decrease | |
| Gross Turnover | 55,074,651 | 60,582,116 | 49,567,186 |
| Supplementary duty and VAT | 37,498,161 | 37,498,161 | 37,498,161 |
| Net turnover /Sales | 17,576,490 | 23,083,955 | 12,069,025 |
| Cost of sales | 11,463,840 | 11,463,840 | 11,463,840 |
| Gross profit | 6,112,650 | 11,620,115 | 605,185 |
| Operating Expenses | 3,204,204 | 3,204,204 | 3,204,204 |
| Net operating profit before Interest and tax | 2,908,446 | 8,415,911 | (2,599,019) |
| Interest | |||
| Net finance income | 32,213 | 32,213 | 32,213 |
| 2,940,659 | 8,448,124 | (2,566,806) | |
| Workers profit participation fund | 147,033 | 147,033 | 147,033 |
| Profit before Tax | 2,793,626 | 8,301,091 | (2,713,839) |
| Tax | |||
| Current tax | 790,588 | 790,588 | 790,588 |
| Deferred tax | (65,528) | (65,528) | (65,528) |
| 725,060 | 725,060 | 725,060 | |
| profit after tax transfer to revenue reserve | 2,068,566 | 7,576,031 | (3,438,899) |
| Change in COGS | |||
| Base | 10% Increase | 10% Decrease | |
| Gross Turnover | 55,074,651 | 55,074,651 | 55,074,651 |
| Supplementary duty and VAT | 37,498,161 | 37,498,161 | 37,498,161 |
| Net turnover /Sales | 17,576,490 | 17,576,490 | 17,576,490 |
| Cost of sales | 11,463,840 | 12,610,224 | 10,317,456 |
| Gross profit | 6,112,650 | 4,966,266 | 7,259,034 |
| Operating Expenses | 3,204,204 | 3,204,204 | 3,204,204 |
| Net operating profit before Interest and tax | 2,908,446 | 1,762,062 | 4,054,830 |
| Interest | |||
| Net finance income | 32,213 | 32,213 | 32,213 |
| 2,940,659 | 1,794,275 | 4,087,043 | |
| Workers profit participation fund | 147,033 | 147,033 | 147,033 |
| Profit before Tax | 2,793,626 | 1,647,242 | 3,940,010 |
| Tax | |||
| Current tax | 790,588 | 790,588 | 790,588 |
| Deferred tax | (65,528) | (65,528) | (65,528) |
| 725,060 | 725,060 | 725,060 | |
| profit after tax transfer to revenue reserve | 2,068,566 | 922,182 | 3,214,950 |
Scenario Analysis
Suppose Sale will Change By 25% in Best & Worst Case
| Best Case | Base Case | Worst Case | |
| Gross Turnover | 68,843,314 | 55,074,651 | 41,305,988 |
| Supplementary duty and VAT | 37,498,161 | 37,498,161 | 37,498,161 |
| Net turnover /Sales | 31,345,153 | 17,576,490 | 3,807,827 |
| Cost of sales | 11,463,840 | 11,463,840 | 11,463,840 |
| Gross profit | 19,881,313 | 6,112,650 | (7,656,013) |
| Operating Expenses | 3,204,204 | 3,204,204 | 3,204,204 |
| Net operating profit before Interest and tax | 16,677,109 | 2,908,446 | (10,860,217) |
| Interest | |||
| Net finance income | 32,213 | 32,213 | 32,213 |
| 16,709,322 | 2,940,659 | (10,828,004) | |
| Workers profit participation fund | 147,033 | 147,033 | 147,033 |
| Profit before Tax | 16,562,289 | 2,793,626 | (10,975,037) |
| Tax | |||
| Current tax | 790,588 | 790,588 | 790,588 |
| Deferred tax | (65,528) | (65,528) | (65,528) |
| 725,060 | 725,060 | 725,060 | |
| profit after tax transfer to revenue reserve | 15,837,229 | 2,068,566 | (11,700,097) |
Financial distress cost calculation (possibility of bankruptcy)
Altman Equation for Bankruptcy/ insolvency prediction
Z-Score= 1.2{Net working capital/total asset} + 1.4{Retained Earnings/Total asset} + 3.3{Earnings before interest and tax/Total asset} + 0.6 {Market value of Equity/Book Value of liability} + 1.0{Sales /total asset}
| Net working Capital | 6249251 |
| Retained earnings | 4497224 |
| Earning before interest and tax | 2908446 |
| Market Value of Equity | 5162120 |
| Sales | 55074651 |
| Total assets | 12019565 |
| Book value of liability | 6857445 |
Calculation for Z-score
| X1 | 0.62390787 |
| X2 | 0.52382209 |
| X3 | 0.79852073 |
| X4 | 0.4516656 |
| X5 | 4.58208354 |
| Z-Score | 6.97999983 |
Z-Score is more then 3.0. So, there is a low probability of bankruptcy. On the hand, the management ability is very strong when it come Managements ability to compete.
Findings
The profit margin was fairly consistent throughout the years.
The Company pays dividend consistently in fact pays in an increasing trend every year.
The Company has no chance of being bankrupt.
The Company was successful to bring down noncurrent liabilities to a minimum level.
The Company’s liquidity is not enough over the years. Liquidity Ratios show that BATB is not in a good position as standard to meet its current obligation.
The industry average of price earnings ratio is 12.44, if we compare it with the BAT Bangladesh we find that since 2007 its EPS is above industry average. And in 2012 their EPS has climbed to 34.48 approximately, so the earning multiplier is Tk429 (=12.44×34.48). But during that period, December 9, 2012, market value of its share was Tk 409. As earning per share is increasing and that gives a positive aspect for the existing shareholders to hold their shares. Any new investor will want to include BAT Bangladesh’s share in their portfolio.
Conclusion:
In the end it is only fair to mention that British American Tobacco is a multination Corporation with strong brand value. In this study we have showed that the condition of the entire industry of security market in Bangladesh. In compare to that the total security market and industry in particular, food sector has a different position in the market. To be precise in the time of the recession the food sector remained unchanged in the security market. The security condition for BATBC is also holds promising return compared to the security market. It is highly noticeable that the stock of BATBC has higher return with lower risk. So, it would be wise to add this stock in the portfolio. Beside that the Z-score shows that the management’s ability to compete and the brand value along with it makes quite promising for the cautious investors.
Recommendation
From the commons size balance sheet it is understood that the inventory is not so high at this moment compare to Company’s historical data. But the company should always be careful so that inventory does not pile up.
Rise of operating cost, supplementary duties and surcharge on both raw materials and finished products, stiff competition from smuggled cigarettes and lack of protection from the law of the land led the turnover of the company to fall. It resulted that the profitability of the company slipped downwards sharply. BATB should create pressure on Government on smuggled cigarette issue as.
From the trend analysis it is seen that the value ratios are better in case of BATBC. BATBC gives good dividend and earnings per share are also good. The company always keeps its shareholders happy but the company should remember that their main job is to increase shareholder’s wealth not only offering high dividend.