Background of the Report :
Change is not easy. It requires a period in which people psychologically get ready. Employees begin to understand and feel the need for change and begin to change social habits to take advantage of the emerging new order inside the organization. Then comes the intervention, what people typically refer to as change but which in reality is the tip of the iceberg of all the unfreezing activities within the organization. Successful interventions are followed by additional activities that confirm the value of change. The world of business is a great example of this change. Now the competition is in its full speed, the customers have become more intelligent. Moreover, they are having more options; so there must be a continual striving to improve all business & production process to develop the customer delight rather than just to meet their expectation. Most people who have used Total Quality Management praise the effectiveness of this approach in making small but steady improvements. However, users and critics of Total Quality Management universally agree that the approach takes too long to do. Many abandon the approach with frustration because it takes too long. Total Quality Management, TQM, is a method by which management and employees can become involved in the continuous improvement of the production of goods and services. It is a combination of quality and management tools aimed at increasing business and reducing losses due to wasteful practices. TQM is mainly concerned with continuous improvement in all work, from high level strategic planning and decision-making, to detailed execution of work elements on the shop floor. It stems from the belief that mistakes can be avoided and defects can be prevented. It leads to continuously improving results, in all aspects of work, as a result of continuously improving capabilities, people, processes, and technology and machine capabilities. Management is giving emphasis on quality program practice as it is a proven technique to guarantee survival in world-class competition. Therefore, to make one prepared & to achieve excellence in every work TQM is now introduced at student level. Students are now practicing Total Quality management through QC (Quality Control) Circle Activities, so that can be well prepared for future competition.
Origin of the Report:
Mrs.JesminSultana, the course instructor of the Total Quality Management (MHR 403) has assigned the students of Fall Semester 2007 (7th semester) to prepare a TQM Report on ‘’Workshop Activity’’. This report is a requirement for the completion of our course. The main purpose of this report is to exchange and relate theoretical knowledge with real life situation. Under the instruction and guidance of our honorable course instructor Mrs. Jesmin Sultana, we have taken the initiative to prepare this report with much precision and by being completely unbiased. She has approved our topic on ‘Road Accident in Bangladesh’ for our TQM Report.
Objective:
Every report has an objective & in academic program generally almost every report has two types of objectives; one is Primary & another one is Secondary.
Main Objective:
Here the main objective is to analyze on the social issue “Road Accident”
To identify the causes of Road Accident in our Society.
To reveal the real picture by using TQM tools & techniques.
To find out the ways for fighting against this problem.
Specific Objectives:
Secondary objective of preparing this report is that our course instructor has assigned us to prepare this report as the requirement of the course “Total Quality Management”.
Methodology:
This TQM report covers the different aspects and activities that are required to make a report on ‘Road Accident’. However, the report is prepared based upon the information collected from several persons and organizations, books, annual reports, the researcher’s own judgments and also from the Internet. Some surveys have been conducted and some interviews were taken. The findings are strictly structured upon information provided by these sources and some secondary sources. The focus here is on presentation of facts as discovered.
The methods that we followed to prepare the report are as follows:
At first we formed a group of 10 members.
We distributed the task among the members.
We studied some accident cases and surveyed 30 respondents.
We have interviewed traffic controllers and officials related to road & transport.
We have collected information through newspapers and web sites.
We have discussed with our honorable course instructor.
Source of Information:
To meet the purpose of this report, collection of appropriate, precise, standardized and accurate information was required. In bringing this report to existence, data was collected from both primary and secondary sources. Special consideration was given so that chances of biasness could not arise. The sources used were:
Primary Sources:
Primary sources are original materials on which other research is based. They are usually the first formal appearance of results in the print or electronic literature. They present information in its original form, neither interpreted nor condensed nor evaluated by other writers. The primary data related to Road Accident in Bangladesh was strictly collected from the victims of accidents through individual depth interview. Structured questions were constructed as the main link in getting the primary data. We have also gathered information from the survey on users of roads in different areas and also from Traffic Controllers and Officials in Road Department of the Government. From those surveys, we got some information that has helped has in preparing this report. Other than these sources, we have collected our information from the following primary sources:
journal articles reporting experimental research results of road accident
technical reports on road accident
census statistics
interviews and fieldwork
newspaper articles
government documents
Secondary Sources:
Secondary sources are those, which simplify the process of finding and evaluating the primary literature. They tend to be works, which repackage, reorganize, reinterpret, summarize, index or otherwise “add value” to the new information, reported in the primary literature. Secondary data may be available which is entirely appropriate and wholly adequate to draw conclusions and answer the question or solve the problem.
To know exactly how to prepare the report, we have referred different books of Total Quality Management as secondary sources. Secondary sources were consulted for an understanding of techniques of writing feasibility studies and for other relevant information. Few publications and web pages were also browsed.
We have also collected our data from the following secondary sources:
bibliographies
biographical works
commentaries
dictionaries and encyclopedias
handbooks and data compilations
history
journal articles
newspaper and popular magazine articles
internet
review articles and literature reviews and
textbooks
Scope of the Report:
This report focuses on the Road Accident in Bangladesh. This report can be used as a secondary source for others, but the information and data presented cannot be rationally or ethically be used under a different company’s name. All the topics discussed here are only in the perspective of Bangladesh; no other country is taken in to the consideration.
Limitation:
There may be some limitations behind this report. These are –
- There was a lack of adequate primary and secondary information.
- It was very hard to get the real information, which was needed to explore the current situation.
- It was very difficult for us to survey in different place because sometimes people are not interested in this type of survey.
- Money is a vital factor to prepare a perfect report though we are the student, so we face this problem.
- We don’t have any previous experience of writing this type of report based on TQM. That is why we faced some problems to prepare the report.
- The respondents do not reveal real information for some particular questions.
- The respondents hide their personal information.
- The pressure of other assignments and reports.
- Time is not sufficient for interview with the people in the organization & victims.
- We are restricted from having video recording of the interview session.
Members of CREATIVE:
Group Name: “CREATIVE”
| Members Name | Registration Number |
Mizanur Rahman Siddiki | O4202012 |
Kashmi Khan | O4202015 |
Shahin Akther | O4202020 |
Rahnuma Sharmin Hossain | O4202006 |
Amena Ferdous Ara | O4202021 |
Tania Rahman | O4202003 |
Shamima Nasrin | O4202027 |
Masum Billah | O4202009 |
Reasat Karim | 04102045 |
Shafiqur Rahman | 04102001 |
QC Circle:
Quality Circle is a small group of employees who work in same work area or doing a similar type of work, who voluntarily meet regularly for about an hour every week to identify, analyze and resolve work related problems, leading to improvement, in their total performance, and enrichment of their work life. The ideal size of a quality circle is from eight to ten members. Quality circles have the advantage of continuity; the circle remains intact from project to project.
QC Circle activities are carried out as part of Total Quality Management (TQM), with the objective to develop the members’ capabilities to the fullest and make the workshop a pleasant place to work. As the members study and learn together, their full potential is realized. They understand their work better, they see their importance in the workshop, they enhance their analytical skills, and they learn new things.
Circle Formulation and Work Distribution:
Quality circles have this basic assumption that most of the people are intelligent enough to do work in a different productive manner. This concept assumes that people have brains as well and it is important to give them the opportunity to use their mental abilities in a constructive way.
There were ten members in our circle. We have started our activities under the supervision of our honorable course instructor Mrs.Jesmin sultana. The circle was divided into smaller units composed of several members. Generally our circle consists of –
- Leader
- Deputy Leader
- Steering Committee
- Members
Leader:
A leader is chosen by the members of the quality circle among themselves. A leader will act as a first among equals and will be responsible for the effective performance of his circle. With the consent of all the members, we have selected Mizanur Rahman Siddiki(Razin) as our circle leader. The activities of the leader were as follows:
Responsible for the smooth operation of QCC activities
Assisting the Circle members in record keeping
Conducting QC Circle meetings in an orderly and effective manner;
Integrating the circle
Enforcing team discipline.
Deciding roles of individuals and proceeding QC Circle activity
Making detail plan and direct the whole circle activities.
Facilitating co-operation among the members by getting everyone involved, speaking out & sharing responsibilities.
Adjusting favorable relationship with other circles.\
Deputy Leader:
The natural process of development of circle members needs to be augmented by certain and self-confidence. It is also necessary to make them aware of the need to reach at solutions systematically so that their well thought out recommendations can easily be “sold” to those who have to accept them eventually. Deputy Leader should extend all the necessary support to the activities of the Quality circles. Through their personal presence at the presentations and other major activities of Quality circles, it can make its support seen and felt by all concerned.
Two deputy leaders were selected for ’CREATIVE’QC Circle with the consent of leader and other group members. Our deputy leaders were ShahinAkhter and Kashmi Khan. Their activities were:
Learning QCC tools and techniques
Trying to improve members’ abilities
Encouraging members
Studying about QC Circle activities and disseminating the knowledge
Showing interest and support to the Circle
Assisting members in problem-solving
Report writing
Implementing design of report & presentation
Assist leaders in their QC Circle activities
Motivating QC Circle leaders and members
Coordinating QC Circle activities
Steering Committee:
The Steering Committee is the committee that formulates policies for the implementation of QCC. Steering committee plays important role in the development of circle. They develop the policy to direct circle. Our Steering committee consists of 7 members including leader & deputy leaders.
Roles of the QC Circle Steering Committee:
Define the ultimate goal of the QC Circle.
Formulate a plan on how to recognize the exemplary performance of Circles, members, leaders and facilitators.
Formulate a plan on how to monitor and evaluate the components of the QC Circle activities
Formulate a budget for the activities and identify sources of funds.
Define qualifications and functions of facilitators.
Formulate corrective and preventive actions based on findings in the evaluation
Conducting survey.
Members:
Members of a quality circle are small group of five to ten persons including leader, deputy leader, steering committee, etc from the same work area or doing similar type of work, who voluntarily form a quality circle. They remain as permanent members of the circle, unless they leave the work area. Members contribute actively to the effective functioning of their QC circle, aiming at better performance of their work area in every way on an ongoing basis.
The role played by the members were-
Attending meetings roles;
Directing their efforts towards solving work-related problems:
Identifying problems, contributing ideas, undertaking research and investigation (where? necessary) and assisting the QCC in problem-solving and
Participating in presentations
Selecting the circle leader and deputy leaders
Procurement of materials
Report composing.
Keeping our group small enabled the members to participate actively in Circle activities. During our meetings, each member had a chance to contribute ideas; whereas, if the group was more than ten, it may happened that a member was not able to contribute an idea because of lack of time, for the Circle usually met for an hour at most. As our group was small, the chances were high that members were able to foster better interpersonal relations and develop cohesiveness. Each member was able to define his role and responsibilities better, making him see his importance to the group; thus, his self-esteem was developed.
Organogram:
After formulating circle & distribution of work, we have prepared the organogram of our group that present a clear picture of all the members & their responsibility in the workshop activities.
Deming Cycle:
We have used Deming cycle to carry out our QC circle activities. The Deming Cycle or PDCA Cycle is a continuous quality improvement model consisting out of a logical sequence of four repetitive steps for continuous improvement and learning. The application of Deming Cycle has given us the opportunity to carry out our work in the right manner. We have used the PDCA Cycle to coordinate our continuous improvement efforts. It both emphasized and demonstrated that improvement programs must start with careful planning, must result in effective action, and must move on again to careful planning in a continuous cycle. We have also used the PDCA Cycle diagram in team meetings to take stock of what stage improvement initiatives are at, and to choose the appropriate tools to see each stage through to successful completion. We know that, Deming cycle has 4 stages – Plan, Do, Check & Act. We have gone through these 4 stages to make our workshop successful.
Plan:
In this stage, we have Planned to improve our operations first by finding out what things were going wrong (that is identify the problems faced), and came up with ideas for solving these problems. In this stage we have formed our QC circle. We have used brainstorming to determine the problem. We have prepared the organogram of our QC Circle. We have established the objectives and processes necessary to deliver results in accordance with the specifications. We collected secondary data & analyzed them. We made detail plan of workshop activities & report writing. We determined the activities from the beginning to end & based on these, we prepared Gantt chart, mentioning the time duration.
Do:
Do changes designed to solve the problems on a small or experimental scale first. This minimizes disruption to routine activity while testing whether the changes will work or not. In this stage, we have completed some of our activities, such as, cause analysis and we have also developed questionnaire for survey. We have conducted meetings in this stage. After that we have analyzed the data collected from survey & applied TQM tools & techniques on them.
Check:
The “check” step includes formal and informal assessments taking place continually. If assessments show the scripts are not performing as expected, the practitioner can make changes such as re-instruction, changing the script or more direct staff mentoring. Assessment data becomes the input for the next step in the cycle. In this stage, we have checked whether the small scale or experimental changes were achieving the desired result or not. We have monitored and evaluated the processes and results against objectives and specifications and report the outcome. We have reviewed the test, analyzed results, and identified what we have learned. We have taken feedback of the QC circle about data & tools & techniques. We checked over & over again for ensuring the correct result.
Act:
The “act” step has the goal of standardizing the change. When staff meets the goals, the diagnostic script design and usage are standardized. Staff shares best practices in formal and informal settings. Results from this cycle become input for the “analyze” phase of the next cycle. In this stage, we took action based on what we learned in the check step. We have applied actions to the outcome for necessary improvement. We reviewed all the steps (Plan-Do-Check-Act) and modified the process to improve it. At this last stage, we stared writing our report based on our analyzed data, using all TQM tool & techniques. Then we made ourselves prepared for the final presentation.
PDCA provides a framework for the improvement of a process. It can guide the entire improvement project, or to aid in developing specific projects based on identified target improvement areas. It is as a dynamic model. The PDCA cycle aids in assessing what needs to change and implementing an effective improvement plan.
Deming Cycle:
Gantt Chart:
A Gantt chart is a horizontal bar chart developed as a production control tool in 1917 by HenryL.Gantt, an American engineer and social scientist. We have identified the activities required to carry out the workshop activities and the time required to accomplish our goal. It is a graphical representation of the duration of tasks against the progression of time. A Gantt chart is a useful tool for planning and scheduling projects. Gantt chart helped us in planning and scheduling our work activities. It allowed us to assess how long our work would take. It laid out the order in which our workshop activities needed to be carried out. It also helped us managing the dependencies between tasks. It allowed us to see immediately what should have been achieved at a point in time and how remedial action may bring the work back on course.
Process Flow Chart:
A flow chart is defined as a pictorial representation describing a process being studied or even used to plan stages of a project. Flow charts tend to provide people with a common language or reference point when dealing with a project or process. Flow charts provide an excellent form of documentation for a process, and quite often are useful when examining how various steps in a process work together. Here we have used this flow chart to show how our QC Circle activities started, how topic and causes were selected, when the decisions were made and in which point we came to a successful destination. As a whole, we can say the process flow chart helped us to have a visual perception of how the total workshop activities carried out.
Topic Selection through Brainstorming:
As our circle formulation was completed and our entire tasks have distributed among our team members, we assigned our next task to identify the problems that our country is facing with in recent days. For Identifying& Selecting the problem we have gone through Brain Storming. Brainstorming is a technique uses to generate a large number of ideas quickly & may be used in various situations. Each of the members of our circle took part in this session to identify the problems and we gathered a large number of problems. Among those select one problem on which we want to carry out our workshop activities such as, conducting Personal Interview, Questionnaire survey, Information collection, Cause analysis, Secondary Data Analysis, Application of TQM Tools & Techniques, Report writing & Presenting Final Report. However, we were a little confused which one to select as our country facing many problems. However, as we work on a team, we easily chose our final problem. Name of some problems that we identified are given below:
International Oil Market & Bangladesh
Road Accident in Bangladesh
Drug Addiction
Labor Law & Its Implication
Traffic Jam in DhakaCity
Terrorism
Political Issues & Politicians
Load-Shading
Acid Violence
Price Hike on Necessary Product
Environmental Pollution (Water, Air, Sound)
Poverty
Illiteracy
In Bangladesh with a population of 140 million faces many challenges including road accident that has become an issue due to its rapid increasing trend. Every day approximately one thousand (1000) on the World die for road accident. Finally, with the consent of all the circle members we selected the problem that is “Road Accident in Bangladesh” & we took the final decision to carry out our workshop activity based on this problem.
Reasons behind Selection of the Topic:
The name of our topic is-
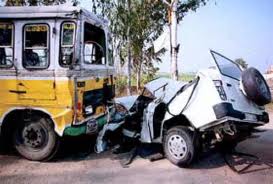
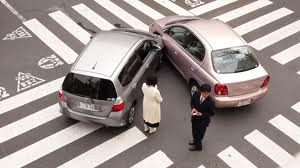
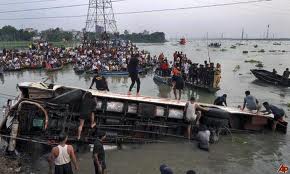
“Road Accident – a concern for safety”
We have selected this topic because ‘Road Accidents’ have loomed as a serious and growing problem in Bangladesh and the safety situation is very severe by international standards. Road accidents -together with the severe social impacts in terms of pain, grief, and suffering- cause serious economic burden to the victims and their families. “Bangladesh” lost 7 to 10 people on average in every single day. This is a major problem for the country that we considered should be solved. Majority of our group members voted for the topic. The other reasons are-
Statistical review -to know current statistical portion of the society that are affected with the occurrence of Road Accident.
To identify the underlying causes behind this Road Accident.
To find out the Activities, Laws & Implementation Strategies against Traffic System.
To gather information & expert opinions in order to rid of this problem.
To provide as much information as possible for the development of research related to Road Accident.
To apply Statistical tools & Techniques in order to provide real picture of it.
To have a clear picture on the law & order against Road Accident.
To find out the possible ways for overcoming and their implementation process of this problem.
Introduction of Road Accident:
Road accidents, injuries, and fatalities are causing great concern to the community in Bangladesh. The road safety situation in Bangladesh has been deteriorating with increasing number of road accident deaths, largely as direct consequences of rapid growth in population, motorization, urbanization, and lack of investment in road safety. Current road accidents and injury statistics revealed a deteriorating safety situation in Bangladesh. The road safety situation is very severe by international standards as well.
Road Accident: The Context of Global and Developing Countries
Road accident is a ‘global tragedy’ with ever-rising trends in fatalities and injuries. Road trauma has now been recognized as one of the significant diseases of industrial societies and is an increasing public health economic issue in developing countries. According to the World Report on Road Traffic Injury Prevention (2004), worldwide an estimated 1.2 million people are killed in road accidents each year and as many as 50 million are injured. Projections indicate that these figures will increase by about 65 percent over the next 20 years unless there is new commitment to prevention. Furthermore, road traffic deaths are predicted to increase by 83 percent in low income and middle income countries and to decrease by 27 percent in high income countries. Of the total 1.2 million deaths, by far the majority – over 80 percent of road accident fatalities occur in the so called developing and emerging countries, even though these countries account only about one-third of the total motor vehicle fleet. Accident rates in developing countries are often 10 to 70 times higher than in developed countries. Whereas road accident situation is slowly improving in the industrialized societies (e.g. Australia, USA, UK), most developing countries face a worsening situation. The escalating road safety problem in the developing world thus represents serious health, social and economic disaster. Developing countries suffer staggering annual loss exceeding US$ 100 billion for road accidents, which is nearly equivalent to the double of all developing assistance. It is expecting that over the next ten years developing countries will experience the alarming increase in road traffic injuries. In fact, the road safety problem in developing countries may be much worse than the official statistics suggest because of widespread underreporting of road accident deaths and an over estimate of licensed vehicles resulting from scraped vehicles tending not to be removed from the vehicle register.
Nantulya et.al (2002) has reported that poor people in developing countries have the highest burden of injuries and fatalities due to road traffic crashes. In 1998, more than 85 percent of deaths and 90 percent of disability adjusted life years lost worldwide because of road traffic accidents occurred in developing countries. In the same year, fatality rates for children, aged 0-4 and 5-14 years were five to seven times greater in developing countries than in higher income countries. It is also argued that policy makers in these countries should give higher priority to the problem of road traffic injuries. The vast majority of road accident fatalities in developing countries comprises vulnerable road user’s viz. pedestrians, bicyclists, motorcyclists and are most prevalent in urban areas. Trucks and buses are over involved in a majority of fatal accidents and they are the most common vehicles to strike pedestrians. Developing countries loss the most economically active and productive years from road accident victim, heavily titled towards 5-44 years age groups.
Road Safety Problems in Bangladesh
Bangladesh: at a glance
Bangladesh is a very densely populated and low lying country with the 130 million inhabitants living in an area of 147,570 sq. km. i.e. 900 inhabitants per sq. km. Although the land is fertile, the mainly agriculture economy has develop a GDP of only $ 360 (US) per head. Population growth remains high at 1.6% per annum with nearly half of the total population is under 15 in households of average size of 5.3 people. About 25 percent of the population is living in the urban areas and more crucially for transport; this is expected to rise to 30 percent by 2010 and to 50 percent by the year 2025. The rate of urbanization in Bangladesh over the last decade has been between 7 and 8 percent, a growth, which is alarmingly high when compared with other developing countries (e.g. India 4%, Pakistan 5%). Dhaka, the capital city of Bangladesh, has a population of over 10 million with a growth rate of 8% per annum.
Growth of Vehicles and Road Network
Being a reverine country, road transport plays an important role in Bangladesh. The number of registered motor vehicles on road increased steadily by 85 percent over the last decade from 3,39,448 in 1990 to 6,29,488 in 2000. The motor vehicle composition on road is characterized as motorcycle 46%; motor cars 14%; trucks 12%; baby taxis 12%; bus/minibus 9% and other 7%. Despite phenomenal growth in the number of motor vehicles the country’s transport demand is still predominantly met by non-motorized modes particularly rickshaws and it’s level of motorization is far below the levels in other Asian countries. The present number of rickshaws in Bangladesh could be in the order of 8, 00,000. To cater for the growing demand of road transport the major road network (national highways, regional roads and feeder roads) increased from14,949 k.m. to 20,799 k.m. in 2001 (RHD website and BBS). National and regional highways form the primary road network of Bangladesh and carry 38% of freight and 60% of passenger traffic with overall modal share of about 60% freight and 70% passenger on road. Although the rates of motor vehicle registration and road kilometrage have grown considerably they are still considered to be far short of the looming demand. These factors together with the large scale shift of traffic from other modes (viz. rail and water) to road, the process of rapid urbanization in conjunction with socio-economic parameters have resulted in enormous road traffic accident problems.
Striking Characteristics of Road Accidents in Bangladesh
Road traffic accidents, injuries and fatalities are causing great concern to the community in Bangladesh. According to the official statistics, there were at least 3334 fatalities and 3740 injuries in 4114 reported accidents in 2003. It is estimated that the actual fatalities could well be 10000-12000 each year. The road safety is rapidly deteriorating with increasing number of road deaths, largely as a direct consequence of rapid growth in population, motorization and urbanization and lack of adequate investment in road safety. Some of the key problem characteristics and factors are summarized in this section.
Total Reported Accidents
The national trends of police reported road traffic accidents, fatalities and injuries for the period 1994-2003 of Bangladesh is shown in the Table 1.
Table 1: Reported Road Accident Trends in Bangladesh (1993-2003)
Year | No. of Accidents | No. of Fatalities | No. of Injuries | Total Casualties |
1994 | 3013 | 1597 | 2686 | 4283 |
1995 | 3346 | 1653 | 2864 | 4517 |
1996 | 3727 | 2041 | 3301 | 5342 |
1997 | 5453 | 3162 | 5076 | 8238 |
1998 | 4769 | 3085 | 3997 | 7082 |
1999 | 3942 | 3314 | 2620 | 5934 |
2000 | 3970 | 3058 | 3485 | 6543 |
2001 | 2925 | 2388 | 3285 | 4953 |
2002 | 3941 | 3053 | 3285 | 6338 |
2003 | 4114 | 3334 | 3740 | 7074 |
Significant fluctuations in the numbers of fatalities and injuries clearly reflect the problems of reporting inconsistencies. Yet it is clear that the number of fatalities has been increasing from 1597 in 1994 to 3334 in 2003, nearly 2.5 times in 10 years period. The statistics revealed that Bangladesh has one of the highest fatality rates in road accidents, over 100 deaths per 10000 motor vehicles. Together with the social impact in terms of pain, grief and suffering, there is a serious economic burden. In current prices, road accident in Bangladesh is costing community in the order of Taka 5000 crore (US $ 800 million, nearly 2% of GDP) per annum. Between 70 -80 percent of accidents occur on highways and rural roads. Pedestrians are involved in about 70% of road accidents.
Table 2 shows the growth of motor vehicles and road accidents in Bangladesh.
Year | No of Registered Vehicles | No of Fatal Accidents | No of Grievous Injury Accidents | No of Simple Injury Accidents | Collision Accidents | Total |
1998 | 572847 | 2000 | 1137 | 193 | 203 | 3533 |
1999 | 603079 | 2432 | 986 | 304 | 220 | 3942 |
2000 | 631912 | 2523 | 1029 | 209 | 209 | 3970 |
2001 | 673537 | 2029 | 642 | 137 | 117 | 2925 |
2002 | 678152 | 2599 | 904 | 200 | 238 | 3941 |
Total | 2481375 | 12864 | 5573 | 1276 | 1225 | 20938 |
Table 2: Growth of motor vehicles and Road Accident for the period 1998-2002*
*Source: National Road Safety Council
Pedestrians-the Most Vulnerable Road User Group
Pedestrian related accidents are by far the greatest among all accident types. In urban areas of Bangladesh pedestrians represents often up to 70 percent of road accident fatalities. Current statistics revealed a deteriorating situation in metropolitan Dhaka. For example, pedestrians as a proportion of deaths increased from 43 percent in 1986-87 to 73 percent in 2002-03. In recent years (1996-98) the number of pedestrian casualties (fatalities and injuries) has increased markedly from 443 in 1996 to 588 in 1998, an increase of about 29 percent. Pedestrians are now making up approximately 73 percent of road accident fatalities, 26 percent of injuries and are involved in about 43 percent of all reported accidents. Indeed, with regard to fatal accidents 70 percent was pedestrian-motorized vehicle collisions. In rural areas, pedestrians account for about 41 percent highway accidents. The seriousness of a pedestrian accident in Bangladesh is clearly evident from the comparative data of pedestrian involvement in fatal accidents and injuries for numerous countries in Asia-Pacific Region (ADB, 1997). Overall, Hong Kong, China had the highest share of pedestrian deaths (two third of all fatal accidents) followed by Dhaka, Bangladesh (63%), Pakistan (50%), Republic of Korea (48%), Fiji (43%) and Papua-New Guinea (33%).
Predominant Accident Types
Accident type analysis showed ‘hit pedestrian’ as the dominant accident type both in urban and rural areas, 45 percent involvement in fatal accidents. Other common accident types are: rear end collision (16.5%), head on collision (13.2%) and overturning (9.3%).These four accident types account for nearly 85 percent of the fatal accidents. In rural areas, accident types which are highly overrepresented in fatalities and injuries are ‘hit pedestrian’, ‘head-on’, ‘running-off-the-road’ and ‘out-of-control’ vehicles. Indeed the running-off-road accident has the highest rate of about 19 casualties per accident. Frequent and most severe consequences of overloaded buses hitting bridge rails and plunged into deep ditches appeared to be of considerable concern.
Over Involvement of Trucks and Buses
Earlier studies of road accidents revealed that heavy vehicles such as trucks and buses including minibuses are major contributors to road accidents. This group of vehicles is particularly over involved in pedestrian accidents accounting for about 79 percent (trucks 37%, buses 20% and minibuses 22%). At some locations, trucks involvement was found to range from 43 to 50 percent. In metropolitan Dhaka, it was found that almost 90 percent of road deaths, a truck, bus or a minibus were involved. They were involved in 86 percent of pedestrian deaths, 97 percent of rickshaw pullers deaths and 100 percent of bicyclist deaths. Most recent study shows that heavy vehicles (trucks, buses and minibuses) account for nearly 64% of all fatal accidents although their share in vehicle fleet is about 15 percent. Besides pedestrians, frequent involvement of buses and trucks were found in ‘running-off-road’ (and hitting roadside objects), ‘hit and run’, ‘head-on’ and ‘out-of-control’ type of accidents. In terms of vehicle-kilo-meters traveled, motorcycles are much more dangerous than other vehicle types, at least five times the rate for rickshaws.
Vehicle Involved In Accident
The number of vehicles by type involved in recorded accidents by year is shown in Table 3. The table reveals that only minibus (10.2%), bus (21.8%), truck (2.4%) and heavy truck (23.6%) contributes 58% of total recorded accidents.
Age Distribution of Overall Drivers’ Involvement:
Drivers in 26-35 years of age constitute the most dominant group involved in accidents as revealed in the analyses of 8,500 drivers. The following are the overall age distributions of drivers involvement in accidents:
26-35 age group, 51.8 percent (26-30 age group, 24% and 31-35 age group, 27.8%)
36-45 age group, 27.3 percent
16-25 age group, 16.3 percent
46-55 age group, 3.4 percent
From preliminary analyses it was revealed that there are about 75 drivers of age below 16, which is about 0.9% of total driver’s involvement. There are over 1,460 drivers of age below 25, which is nearly 17.2% of total drivers’ involvement. This preliminary examination also indicates that drivers under 16 years of age are relatively more vulnerable to be involved in casualties. However, this point needs be examined further with more detailed data.
Heavy Vehicle Drivers’ Involvement:
Of the total of 8,500 drivers with recorded information, about 4,480 drivers were heavy vehicle drivers which accounted for nearly 52.8 percent of total driver’s involvement in the casualties. Categories of drivers are:
Bus drivers (including minibus) – 28 %
Truck drivers (including heavy trucks, articulated trucks and oil tankers) – 24.6 %
Car drivers (including microbuses, jeeps, and pick ups)– 14.5%
Baby taxi drivers (including tempos) – 11.5%
Rickshaw pullers (including push carts) – 7.7%
Motor cyclists – 5.8%
Bicyclists – 4.6%
Involvement of Children in Road Accidents
The national road accidents statistics in Bangladesh revealed a serious threat to the children. The incidence of overall child involvement in road accident fatalities in Bangladesh is found to be very high, accounting for about 22 percent. This involvement of children less than 15 years of age in road accident fatalities is much higher than those in other developing countries. It is important to note that compared to industrialized countries, the proportion of fatalities to under 15 years of age in developing countries is approximately two and half times higher. Of the total child fatalities of road accidents, nearly 82 percent involved as pedestrians with the dominant age group of 5-10 years. Indeed, about one-third of total pedestrian fatalities are children under the age of 15 years. The female child pedestrians are disproportionately higher than the male child pedestrians (44.6% Vs 28.9%). The risk to children in the traffic situation is greatly increased today than in the past. Modern technological developments have imposed greater pressure on today’s children to adapt to new situations at home, at school and most of all on our roads
Accident Factors
The principal contribution factors of accidents are adverse roadside environment, poor detailed design of junctions and road sections, excessive speeding, overloading, dangerous overtaking, reckless driving, carelessness of road users, failure to obey mandatory traffic regulations, variety of vehicle characteristics and defects in vehicles. Others include a low level of awareness of the safety problem by policy makers, inadequate and unsatisfactory education, safety rules and regulations and inadequate and unsatisfactory traffic law enforcement and sanction.
Nature of Accident Occurrence
The distribution of accidents occurrence on road network was characterized as ‘clustering’ at few sites, demonstrating that accidents are amenable to site specific treatments through wide spread implementation of cost-effective countermeasures, low-cost road environmental improvements in particular.
Road Safety Issues and Constraints in Bangladesh
Road Safety Strategies and Principles
There are many different strategies for reducing and preventing accidents. It should be realized that road accidents result from failures in the interaction of humans, vehicles and road environment – the elements that comprise the road traffic system. The combination of these various elements to produce road accidents means that road safety itself has to be tackled in a multi-functional manner. An integrated, multidisciplinary approach is required to reduce road accidents and the consequent injuries and economic losses. The principle for achieving a safer road essentially seeks to apply various measures by focusing on five broad strategies. These are:
Exposure control – restrict certain travel and deny access to hazardous situations;
Accident prevention – the design, construction and maintenance of vehicles and the road system, and traffic control and management devices etc. to manage their operation, have a profound influence on the incidence of traffic accidents;
Behavioral modification – road user’s education, the law and its enforcement;
Injury control – vehicle design, roadside hazards management, and
Post-injury management – recovery, treatment and rehabilitation measures.
It should however be noted that the benefits of road safety strategies and measures can best be achieved by adhering to the fundamental principle of safer operational elements of road designs. Importantly, the main principles of safer road environment are:
Provide guidance to drivers through unusual sections;
Provide information to drivers on conditions to be encountered;
Warn the driver of any sub-standard or unusual features;
Control the driver’s passage through conflict points or sections, and
Forgive the driver’s errant or inappropriate behavior
Furthermore, some aspects of systematic approach for improving road safety nationally could essentially involve the following:
Detailed and systematic accident data collection, recording and computerized database development with emphasis on objective information relating to accidents, casualties and the road environment.
Detailed and sophisticated analysis of accidents with emphasis on sub-categorizing the accidents into location, type, severity, user group etc. The analytical approach should invoke the ‘accident type/location’ technique in ascertaining the incidence of site-clustering of accidents.
Development of procedures for identification of ‘hazardous road location’/‘accident blackspots’ as the treatment of those locations has been found to be highly cost-effective.
Understanding and systematic application of proven and effective engineering counter-measures accompanied by proper evaluation studies of their effects.
Increasing Motorization and Urbanization
The rapid economic growth, increasing disposal income and urbanization are raising the demands for transportation in the developing countries rapidly. As a result the number of vehicles on the roads of developing countries is also increasing rapidly. Developing countries in the Asia Pacific region are experiencing annual growth of about 16 to 17 percent, which is doubling the vehicle fleet in 5 years and trebling in 8 years. This factor is allied to the high proportion of 2 to 3 wheeled motor vehicles in the region and relatively young age of majority of the population are contributing to the serious road accidents casualties. These comments are especially relevant to Bangladesh. In Bangladesh, the present motor vehicle growth rate of around 8 percent is already causing considerable congestion and safety problems. The road networks have shown their apparent inability to operate efficiently and safely. Future increase at the level of so called ‘explosive stage’ will be bound to critically worsening the situation and become unmanageable unless well coordinated and well planned systematic approaches are taken at this stage. So the trends of rapid growth of vehicle population are appeared to be the major issue in the road accident scenario of Bangladesh.
Under reporting of Accidents
Traditionally, only police department performs the road accident data collection in Bangladesh and many other developing countries. The widespread underreporting and incomplete collection of specific details of accident data are, however, a major problem. This limits proper accident analysis to be carried out towards improving road safety. The seriousness of data constraints are particularly highlighted in the recent government’s initiatives and some measures like consistent reporting and recording of accidents using standard accident report forms, regular updating of accident database, personnel training, improved understanding of the role of road environment and other contributing factors are suggested for improving data reliability and adequacy.
High Fatality Index
‘The fatality rates’, i.e. the estimated number of road traffic accident fatalities per 10,000 registered vehicle of Bangladesh (over 100) is very high by international standards, as the fatality rates for motorized countries is usually less than 2. The ‘fatality index’ (deaths divided by total casualties as a percentage) in Bangladesh is nearly 40 percent, which is the highest among the developing countries. This signifies probably two important characteristics, viz. the wide spread under reporting of less serious accidents and the lower level of emergency medical services available to accident victims, there is little scope to provide the prompt and necessary medical attention to injured people, particularly soon after an accident.
Institutional Weaknesses
Road safety improvement efforts in Bangladesh seriously suffer from several drawbacks. These are lack of a strong professional safety agency with adequate executive powers and responsibilities; fragmentation of responsibilities between agencies and insufficient inter-agency coordination; low level of staffing and lack of professional capacity; lack of trained traffic police for effective enforcement and traffic regulations; absence and inadequate dissemination of road safety research; too few resources directed towards tackling the safety problem etc.
PRIORITY ROAD SAFETY OPTIONS FOR BANGLADESH
Indeed, it is possible to significantly reduce the number of road accidents by implementing an effective and coordinated safety policy and actions which require significant improvements in the relevant sectors viz. better enforcement, better roads (including the treatment of accident black spots) and improved public education programs. There is also need for remedial road improvements setting realistic problem specific targets. It should be realized that the road accidents result from failures in the interaction of humans, vehicles and road environment- the elements that producing the road traffic system. The combination of these various elements to produce road accident means that the road safety itself has to be tackled in a multi-functional manner. An integrated multidisciplinary approach is required to reduce the road accident and consequent injuries and economic losses. Indeed road safety engineering strategies demand priority consideration as the road environment components remains a major consideration in the overall road safety management strategies. The potential of the road safety engineering approach is well recognized, as this approach can aid and influence road users to change their behavior, and can make the road environment safer through reducing conflicts.
Engineering Road Safety: Road Environmental Improvements
In view of the existing problem characteristics and in the absence of any systematic approach taken, there is specific need and scope for road environmental improvements aimed at correcting the most common deficiencies in Bangladesh. A few of pragmatic road safety measures which could immediately be implemented at relatively low costs and within short periods of time for achieving safer road operations in Bangladesh are identified. Investigational studies in accident problem characteristics dictate that priorities be placed on such principles as traffic segregation to provide separate movement facilities and road spaces for pedestrians and Non-Motorized Vehicles (NMVs), pragmatic measures to improve and correct road user behaviors (self enforcing measures) through public motivational programs, proper channelisation of road junctions, effective speed control/reducing measures and properly enforcement of traffic safety laws etc. Immediate measures to achieve enhanced road safety and which would also offer cost-effective results include:
Safety conscious planning of new road networks and safety audits of existing roads.
Small changes/improvements in road layout and use of roundabouts.
Incorporation of safety features in the design and construction of new road schemes.
Treatments of roadway shoulders (provide wider and stronger shoulders).
Provision for and augmentation of adequate pedestrian facilities (crossings, urban and rural footways, safety zones).
Provision of special facilities for non-motorized vehicles and designated truck/bus lanes.
Intersection designs/improvements (flaring, channelisation, traffic islands etc.).
Installation and up gradation of median barriers, edge barriers at turning roads and refuse islands.
Treatments of roadside hazards (trees, ditches, and other fixed objects).
Improvements of narrow and deteriorated bridges, culverts and lanes.
Control over speeding and dangerous undesirable overtaking including traffic calming measures.
Installation of delineation devices (lane markings, guide posts, chevrons) to facilitate and guide traffic movements.
Improved access controls, cross-sections, sight distances and alignments.
Setting safety standards for fronts of vehicles, which would be less hazardous to pedestrians and cyclists.
Improved conspicuity of vehicles in general, bicyclists and pedestrians in particular.
Compulsory helmet use for motorcyclists and effective enforcement of laws and sanctions against alcohol impaired drivers.
Compulsory use of seatbelts by motor vehicle operators and car occupants including child restraints.
The safety of the vulnerable road users must also be sufficiently catered for in the road safety engineering strategies and principles. Vulnerable road users are much more susceptible to accidents when vehicle speeds are high and can even suffer fatal injuries in accidents with motor vehicles at moderate speeds. Thus the most critical and effective measure which should be immediately adopted in every country is to reduce speeds particularly in urban areas. This measure alone will greatly reduce the overall number of road deaths as shown by experience all over the world (the number of fatalities was reduced by 32% in urban areas after speed limits of 50 km/h were enacted and strictly enforced in Hungary). A necessary prerequisite to the development of such cost- effective solutions to the accident problems is of course an improved understanding of the accident problem.
Some are parts: