
1.1 Origin of the Report:
Bachelor of Business Administration (BBA) in Jahangirnagar University requires an Internship Program of three months attachment with an organization followed by writing a report. All the students of the BBA Program after successfully completing their 7th semester are placed at different organizations as interns to bridge their theoretical knowledge with the practical fields and real life business situation. This is the requirement of the BBA degree offered by the Department of Business Administration, Jahangirnagar University. The Internship Program is considered as the 8th semester and is given the equivalent weight as the other semesters. In this connection the researcher of the report was placed in Union Capital Ltd. by the Internship Placement Committee of the Department of Business Administration, Jahangirnagar University, Savar, Dhaka.
The researcher of the report was assigned with the topic entitled “Comparative Performance Analysis of Union Capital Ltd. with Three Others Leasing Companies”.The report topic was selected by the internal supervisor Mr .Nazmul Islam, Assistant Professor, Department of Business Administration, Jahangirnagar University and later was approved by external supervisor Mr. Fazle Karim Murad, Assistant Vice President, Lease Department, Union Capital Ltd.
1.2 Rational of the Study:
In recent years NBFI’s sector in Bangladesh has experienced tough competition as well as expansion. It becomes extremely essential to assess the profitability and financial performance of non banking financial institutions as they enter new premises of financial services. Assessing the financial performance is gaining importance to understand the long term financial sustainability and growth which can ultimately lead to investor-customer satisfaction and stable dividend growth. So, the importance of best financial practice is mandatory to these institutions.
1.3 Objective of the Report:
1.3.1 Board Objective:
“Comparative Performance Analysis of Union Capital Ltd. with three other Leasing Companies, Industrial Development Leasing Company of Bangladesh Limited (IDLC), United Leasing Company Limited and Uttara Finance And Investment Limited.”
1.3.2 Specific Objective:
The specific objectives of the report are as follows:
- a. To provide an overview of Union Capital Limited – know about the management system as well as its formation, its objectives and its functional, operational and about the financial aspects.
- To conduct the comparative performance analysis of Union Capital Limited with three other competitors with the help of financial ratios.
- c. To understand the actual position of Union Capital Limited in the financial service sector.
- To make some recommendation based on the company’s performance.
1.4 METHODOLOGY:
Methodology includes designing samples, selection of the organizations as source of data, collection procedure of data, analysis of the data, etc. These are stated in the following sub-headings.
1.4.1 Variables Covered
The study consists of conducting “Comparative Performance Analysis Of Union Capital Ltd. with Three Other Leasing Companies” which requires the following sets of variables:
- Income Statement data regarding Income and expenses
- Asset information
- Liability and equity information
- Other organizational policy
1.4.2 Sampling Design
Research work requires designing of samples. The process of designing samples in the report consists of selection of institution, selection of study year and the duration of the study. The researcher has selected Union Capital limited. The company has a new entrant in the Non Banking Financial Institution as a public limited company from a private one. The researcher also selected three other competitors of Union Capital Limited according to their market share, profitability and market portfolio. They are- Industrial Development Leasing Company of Bangladesh Limited (IDLC), United Leasing Company Limited and Uttara Finance And Investment Limited. The selected years that the researcher has studied for performance analysis are 2002, 2003, 2004, 2005, 2006 and the duration of the study is three months starting from December 17, 2007 to March 17, 2008.
1.4.3 Sampling Method
The sample size that has been chosen for preparing this report is the three major competitors of Union Capital Ltd. that are Industrial Development Leasing Company of Bangladesh Limited (IDLC), United Leasing Company Limited and Uttara Finance And Investment Limited. In this report the researcher has studied the income statement and balance sheet data of those companies of the year 2002, 2003, 2004, 2005, 2006 and other organizational information relevant to the required structure of the report given by the coordinator.
1.4.4 Methods of Data Collection
Data has been collected from both direct searching or from primary source and from several secondary sources.
Primary Sources
Data collected from primary source consists of observation method and interview method to the personnel of Union Capital.
The researcher has observed all the activities and financial statements of Union Capital Limited and three other competitors.
To get the real information and data about general activities and performance of Union Capital and the selected competitors the researcher has asked relevant personnel and officer.
Secondary Sources
The secondary data have collected from Internet, annual report of Union Capital Limited, Industrial Development Leasing Company of Bangladesh Limited (IDLC), United Leasing Company Limited and Uttara Finance And Investment Limited of the year 2002, 2003, 2004, 2005, 2006, and different article published in the newspapers, journals and magazines.
1.5 Scope of the Study
The researcher has conducted only the comparative performance analysis of Union Capital Limited with three other competitors Industrial Development Leasing Company of Bangladesh Limited (IDLC), United Leasing Company Limited and Uttara Finance And Investment Limited. with the help of financial ratios. The scope of this report is to identify different functions and competencies Union Capital has and to assess the service quality and dimensions, customer orientation, profitability, long term financial performance and how it contributes to the industry and in the economic development of the country by proper utilization of capital and other resource.
1.6 Limitations of the Study
- Unavailability of recent years’ public data as the company became public last year.
- Assessing information of different activities of Union Capital as well as the other competitors will be a great problem because of confidentiality.
- All the employees were always busy with heavy workload. Therefore, they might not be able to co-operate properly.
- Since the report has to be made at the same time with other office works within three months, time might be a major constraint in accumulating all sorts of information in an organized way. Due to time limitation many aspects might not be discussed in the present study.
2.1 Brief Profile
Union Capital Limited (Figures in taka)
| Date of Incorporation | August 09,1998 | |
| Commencement of Business | August 09,1998 | |
| License from Bangladesh Bank | August 12,1998 | |
| Registered with SEC as Merchant Bank | April 10,2002 | |
| Market portfolio | 300 crore | |
| Authorized Capital | 50 crore | |
| Paid-up Capital | 20 crore | |
| Total Assets & investment | 1,608,695,433 (as of 31st December,2006) | |
| Operating Profit | 38,462,723 (as of 31st December,2006) | |
| Nature of Business | UCL engages in business of lease finance, term Finance, syndicated finance and merchant banking activities. | |
| Associated , subsidiary/ related holding company | SES Company Limited, engaged in all kinds of business of investment in shares and stock and brokerage and dealing of securities. | |
| No. of branches in Bangladesh | UCL has two branches (Dhaka & Chittagong ) And 3rd on is going to open in Sylhet. | |
| No. of employees in Bangladesh | 23 (as of 31st December, 2006) | |
| Name of the Chairman of Board of Directors | Mr. Amir Humayun Mahmud Chowdhury | |
| Name of the Managing Director (in charge) of the company | Mr. Ramendra Nath Paul
| |
| Main branch address | Noor Tower (5th Floor), 1/F Free School Street 73, Sonargaon Road, Dhaka-1205, Bangladesh. Telephone : 880 (2) 966 2888 Fax : 880 (2) 8616878 E-Mail : mailbox @ unicap-bd.com Web : www. unicap-bd.com | |
| Motto of Union Capital Limited | One team, One goal |
2.2 History of Union Capital Limited:
Union Capital Limited is originated as the largest investment bank and fastest growing financial institution in Bangladesh. Previously, it was known as Peregrine Bangladesh which had its origins and businesses rooted in Hong Kong. Out of the local office of the erstwhile Peregrine Capital Limited of Hong Kong, Union Capital Limited, Dhaka emerged in early 1998 as a Bangladesh-based company led by a group of the foremost entrepreneurs of the country. Union Capital Limited was registered with the Registrar of Joint Stock Companies of Bangladesh on 09 August 1998. On 12 August 1998, the Company received permission from Bangladesh Bank to operate as a non-banking financial institution under the Financial Institutions Act 1993. During the year 1999, the Company commenced operations in lease finance and consumer credit. Union Capital was registered as a full-fledged Merchant Banker with the Securities and Exchange Commission on 10 April 2002.
Union Capital, within a short span of time, has proved its worth as a most forward-working vigorous organization achieving success with its wide international network and strong local base. UCL engages in business of lease finance, term finance, syndicated finance and merchant banking activities. UCL offers lease finance and term loan facilities to businesses and entrepreneurs to meet their various financial needs which include but are not limited to commercial and personal vehicles, office equipment, industrial machinery and accessories, medical and diagnostic equipment, generators, elevators/lifts, heavy construction equipment and other commercial equipment. Under its merchant banking activities it undertakes public issue management, underwriting, portfolio management and loan/debt syndication, stock brokerage services to local and foreign investors through its wholly owned subsidiary. UCL generates revenue mainly through lease financing, corporate financing and investment and merchant banking activities.
SES Company Limited, which is wholly owned by Union Capital, has seats in both the Dhaka and Chittagong stock exchanges. This company is engaged in all kinds of business of investment in shares and stock and brokerage and dealing of securities. Union Capital is dedicated to provide a high level of professional and personalized service to its domestic and international clients. Preferential treatment and superior service to clients is what the company believes to be its ultimate goal.
2.3 Vision and Mission of Union Capital Limited:
Vision
Becoming a most admired financial institution which has strong commitment to the development of the society.
Mission
Becoming a vibrant financial institution with innovative solutions; maintaining a high standard of professional ethics; maximizing return on equity; securing a sustainable growth; ensuring greater customer satisfaction and contributing towards development of the economy with a motivated work force.
2.4 Overall Organizational Objectives:
UCL has established broad objectives –
- Be in the top lists among the existing leasing companies.
- Be the preferred choice among the customers for friendly and personalized services.
- Be the first choice for cutting edge technology, tailored solutions for business needs.
2.5 Capital Structure:
| A. | Financial structure prior to Initial Public Offering (IPO) | |
| Issued & fully paid up capital as on date | Tk 193,130,720.00 | |
| B. | Financial structure after IPO | |
| a) | Issued & fully paid up capital as on date | Tk 193,130,720.00 |
| b) | IPO | Tk 75,000,000.00 |
| Total Capital Structure after IPO | Tk 268,130,720.00 | |
2.6 Management structure:
The company has an organizational structure with line of authority among the various operating departments and stuff functions. The human resources department maintains detailed job descriptions including specific duties and reporting responsibilities. Management has reviewed these job descriptions for proper assignment and delegation of authority. The Board of Directors is composed of 11 members among them 5 members representing various institutions. Mr. Amir Humayun Mahmud Chowdhury representing Progoti Shipping (Bangladesh) Ltd is currently the Chairman of the Company. Mr. Ramendra Nath Paul is the Managing Director in current charge now.
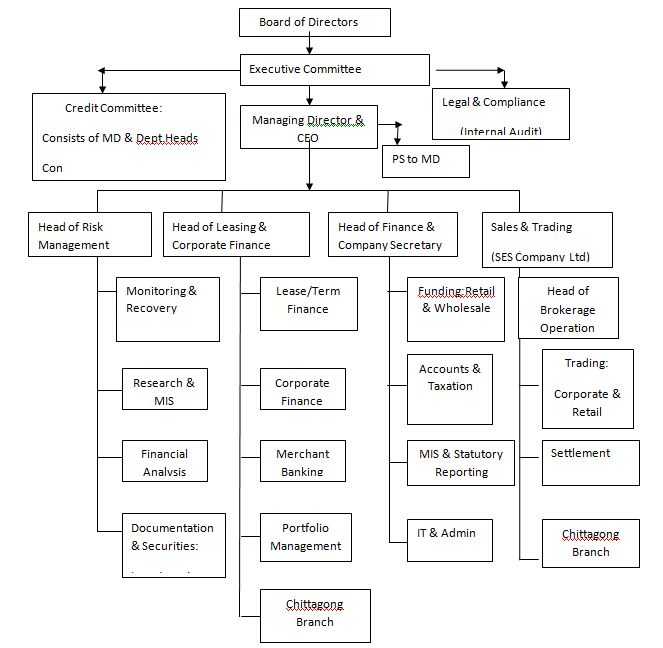
2.6.1 Organogram:
The organogram of Union Capital Limited starts with the Board of Directors. Then it is followed by the members of Executive Committee. The decisions taken by the Executive Committee directly communicated with the Managing Director & CEO. Managing Director & CEO then communicate with the Head of the Departments and discuss the important issues decided in the Board meeting and the Executive Committee meeting.
2.6.2 Organizational hierarchy (job position)
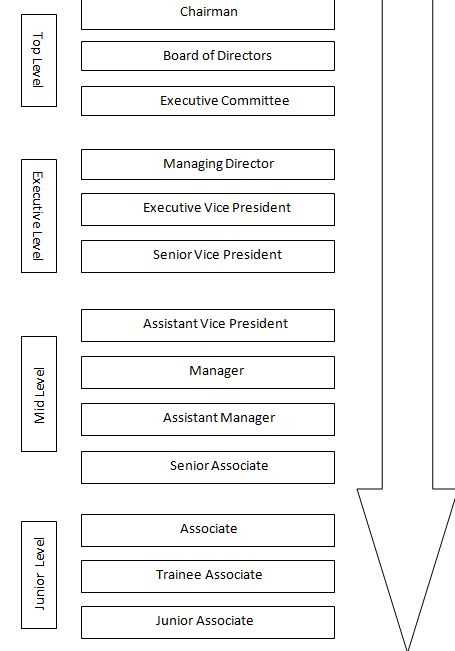
2.6.3 ORGANOGRAM
2.7 Departments:
Union Capital Ltd. has these following departments. The main objective of these departments is to generate profit by working together and by providing higher quality of services and professionalism.
Lease Finance
Corporate Finance
Sales Trading
Finance & Accounting
Administration
IT Department
2.7.1 Lease Finance:
UCL started their leasing operation in 1999.They initially provided service to proprietorship business. The main role of the department is to offer lease finance services to business and entrepreneurs to meet their various financial needs. In today’s environment, financial requirements of enterprises as well as that of individuals are evolving. Traditional means of finance are not always suited to corporate needs. Financial requirements may take different forms, starting from procuring office equipment to funding heavy industrial machinery. Keeping these needs in mind, Lease Finance offers customized leasing facilities to institutions and individuals. It provides leasing services for commercial and personal vehicles, office equipment, industrial machinery and accessories, medical & diagnostic equipment, generators, elevators/lifts, heavy construction equipment, and other commercial equipment. However, entrepreneurs in other sectors are also encouraged to speak to Union Capital if they have a good project.
- Number of manpower for this service is 8.
- Most attractive and profitable sector is industrial material.
- If all papers are clear then processing time is 7 working days.
- Limit of leasing amount is maximum- Tk. 11.00 crore (without the permission of Bangladesh Bank) to Tk. 36.00 crore (with the permission of Bangladesh Bank) and Minimum – Tk. 20.00 Lac.
- Interest rate is (15%-18%), based on market rate, clients image and goodwill.
- Disbursement is both in installment and direct disbursement is provided (according to the requirement /choice 0f the client)
- Leasing period is maximum 5 years and minimum 1 year.
2.7.2 Corporate Finance:
Corporate Finance is the core activity in investment banking. In its most basic term, the Corporate Finance & Investment department (CFIB) raises capital for private entrepreneurs, corporations, and government entities. In this process CFIB assists clients in developing projects, dealing with regulatory authorities, performing mergers and acquisitions and joint ventures, capital restructuring, documenting and implementing projects. CFIB services for clients include:
- Initial Public Offerings (IPO) and Rights Issues
- Underwriting
- Financial and Corporate Advisory
- Private Capital Raising
- Equity
- Debt
- Hybrids
- Private Equity participation
This department also doing the job of Portfolio Management and Merchant Banking.
Portfolio Management is the process of managing money. The process requires an understanding of the various investment vehicles, the way these investment vehicles are valued, and the various strategies that can be used to select the investment vehicles that should be included in a portfolio in order to accomplish investment objectives. Each client’s objectives, risk tolerance and legal restrictions are individually analyzed in order to design a customized portfolio. The portfolio is constructed based on fundamental and technical analysis of individual securities and sectors, statistical analysis and an asset allocation model using proper risk analysis.
Main functions of Merchant Banking of Union Capital is to provide full-service brokerage to retail and institutional investors, both foreign and local in the secondary market through SES Company Limited, which is wholly owned by Union Capital. The latter has seats on both the Dhaka and Chittagong stock exchanges. The Department also doing the job of investment in capital market through the investors account. Total number of manpower in this department is 7.
2.7.3 Sales and Trading:
The function of Sales and Trading Department is closely related with the merchant banking. Sales and Trading is mainly done through SES Company Limited, which is wholly owned by Union Capital, the latter has seats on both the Dhaka and Chittagong stock exchanges. In relation to primary marker transactions, S&T provides CFIB clients with global and domestic distribution capabilities. S&T acts as a conduit between the issuer of securities and investors.
Main activities of Sales and Trading are:
- International and Domestic Placement of Securities (Equity, Debt, etc)
- Full-Service Brokerage for Institutional and Retail (Individual) Investors in the Share Market
Union Capital’s predecessor was credited with a number of accomplishments in 1996 and 1997, which includes being one of the top brokers in the market, a preferred broker for most of the Foreign Institutional Investors (FII), a leader in placing most of the foreign trenches of IPOs and a brokerage house with no settlement defaults as confirmed by the multinational custodian banks. The success story continues, as Union Capital remains the premier choice of the FIIs dealing in Bangladesh.
Full-service retail brokerage is the latest and an exciting addition to S&T’s services. The purpose of the Retail Brokerage division is to offer individual investors with international standard brokerage service. The Silver Premium Retail Account (SPRA) offers one of the most convenient, flexible and cost-effective ways to invest in the local stock market.
Sales and Trading has designed a unique product for institutional clients, which give them the necessary tools to make prudent investment decision.
2.7.4 Finance & Accounting
Finance & Accounting Department is responsible for
- Funding (Retail & Wholesale)
- Typical Accounts related activities of UCL & SES Company Ltd.
- Accounts & Taxation
- MIS & Statutory Reporting etc.
2.7.5 Administration:
Administration is very effective and efficient in UCL. This department is doing the job of
- Selection, Recruitment
- Promotion
- Increment
- Salary Survey review
- Other staff benefit
- Performance appraisal
- Development/training
- Leave processing
- Staff loan
- Personnel file management
- Internal & External communication
2.7.6 IT Department:
Currently, there is a separate IT division headed by an IT engineer who is also in charge of Administration and HR function.UCL maintains modern IT infrastructure to decision- making. The company has already adopted some advanced technologies for IT department. It uses PEACHTREE accounting software along with in- house designed database management system. Head office is connected by Local- Area Network and Internet.UCL has value addition online link with the Dhaka-Stock Exchange and Chittagong Stock Exchange under Wide-Area Network (WAN) through radio link and Fiber optic which facilitates online trading for its clients.UCL is in process of procurement and installation of software, a centralized integrated leasing and investment software.
The future expansion plan of UCL includes complete integrated database system to introduce client information system for front office and automated central operation.
2.8 Products and Services:
Union Capital Limited offers tailored financial packages to meet appropriate financing needs of the company’s valued customers under distinguished units as mentioned below:
Project/Corporate Finance
Portfolio Management
Loan Syndication
Merchant Banking
Lease/Term Finance
Investment Banking
Term Deposit Receipts
Security Trading through DSE and CSE
Research
Brief description of these financial services is described in below:
2.8.1 Project/Corporate Finance:
Corporate Finance is the core activity in investment banking. In UCL this activity is done by the merchant banking Department. In its most basic term, the Corporate Finance & Investment department (CFIB) raises capital for private entrepreneurs, corporations, and government entities. In this process CFIB assists clients in developing projects, dealing with regulatory authorities, performing mergers and acquisitions and joint ventures, capital restructuring, documenting and implementing projects. The key to success of this business line is the harnessing of Union Capital’s strength in the domestic market with its local and foreign fund raising capabilities. In particular, CFIB has been successful in raising capital in difficult market situation and meeting particular needs of a company by pioneering new ways of raising money. CFIB services for clients include:
- Initial Public Offerings (IPO) and Rights Issues
- Underwriting
- Financial and Corporate Advisory
- Private Capital Raising
- Equity
- Debt
- Hybrids
- Private Equity participation
- Mergers, Acquisitions and Joint Ventures
- Privatization Advisory
2.8.2
2.8.2 Portfolio Management:
Portfolio Management is the process of managing money. The process requires an understanding of the various investment vehicles, the way these investment vehicles are valued, and the various strategies that can be used to select the investment vehicles that should be included in a portfolio in order to accomplish investment objectives. Each client’s objectives, risk tolerance and legal restrictions are individually analyzed in order to design a customized portfolio. The portfolio is constructed based on fundamental and technical analysis of individual securities and sectors, statistical analysis and an asset allocation model using proper risk analysis. The purpose of using advanced financial concepts both in macro and micro contexts of a portfolio and its underlying assets is to reduce the unsystematic risk. The process continues with on going measurement and evaluation of performance relative to benchmarks.
2.8.3 Loan Syndication:
It provides syndicated loan facilities with other financial organizations in the manufacturing segment, pharmaceutical, textile, food, garment, leather, cement, ceramic, and other potential growth sectors as well as service segments include construction, telecommunications, power sector companies, hospitals & clinics, diagnostic centers, and transportation services. For project requiring large-scale investment, we UCL raise funds from banks/financial institutions through syndication. Their job in this area is to find the right consortium partners and negotiate acceptable terms and conditions for you. As lead Syndication Arranger, UCL will help in the documentation, execution and administration of the syndicated finance.
2.8.4 Merchant Banking:
Main functions Merchant Banking of Union Capital is to provide full-service brokerage to retail and institutional investors, both foreign and local in the secondary market. Through SES Company Limited, which is wholly owned by Union Capital, the latter has seats on both the Dhaka and Chittagong stock exchanges. In relation to primary marker transactions, S&T provides CFIB clients with global and domestic distribution capabilities. S&T acts as a conduit between the issuer of securities and investors.
2.8.5 Lease/Term Finance:
Lease Finance offers customized leasing facilities to institutions and individuals. It provides leasing services for commercial and personal vehicles, office equipment, industrial machinery and accessories, medical & diagnostic equipment, generators, elevators/lifts, heavy construction equipment, and other commercial equipment. However, entrepreneurs in other sectors are also encouraged to speak to Union Capital if they have a good project.
Eligibility:
According to its policy, Lease Finance focuses generally on institutional clients. Both manufacturing and service organizations are eligible to apply for lease financing. However, Union Capital also extends leasing facilities to reputed proprietorship and partnership companies, and professionals who are guaranteed by their employers.
Union Capital provides lease financing to customers on fairly easy terms and conditions. Lease term varies from two years to maximum of five years depending on the nature of machinery/ equipment to be financed. Vehicles, office equipment and other smaller equipment are normally lease financed for two/three years while industrial machinery and other heavy equipment are leased for a maximum period of five years.
Rates & Fees
- Rates charged by Lease Finance vary depending on the nature of equipment and other terms and conditions negotiated between the parties. However rates are comparable to those of the market and are always kept at competitive levels so that both Union Capital and its customers mutually benefit from the arrangement.
- The interest rates are fixed for the tenure of the contract and are calculated on a reducing balance method.
- Service Charge
- Transfer Price
Union Capital is authorized to perform lease finance activities under the Financial Institution license granted by the Bangladesh Bank.
2.8.6 Term Loan Financing
Eligibility
- Any Proprietorship/Partnership firm/Private Limited Company with more than 2 years of track record of profitable business operation and sufficient cash flows to service the monthly rental payments.
Loan Amount
- Loan amount can vary depending upon the specific requirement and repayment capacity.
Rates & Fees
- Here rates are one of the most competitive in the market and most often better than what other NBFIs’ can offer.
- The interest rates are fixed for the tenure of the contract and are calculated on a reducing balance method.
- Service Charge
2.8.7 Investment Banking
Union Capital’s investment banking activities covers domestic underwriting, private placement, corporate restructuring, joint venture, mergers and acquisitions and domestic and cross-border advisory as well as the international distribution of Bangladeshi equities. It also provides financial advisory and fund raising expertise for multi-nationals seeking to enter or expand their activities in Bangladesh. During its tenure with Peregrine Bangladesh, it pioneered a number of transactions including the first private placement of convertible bonds, the first legal merger and proposed the first joint venture in the energy sector in Bangladesh. The Corporate Finance department has wide range of experience in the power, petroleum, steel, engineering, information technology, telecommunications, pharmaceuticals, cast iron, welding electrodes, food, particle board, cosmetics, construction related industries and many others.
2.8.8 Term Deposit Receipts
Union Capital accepts term deposit receipts (TDR) in an effort to encourage savings among depositors. As part of the scheme, Union Capital welcomes interested institutions and individuals for deposit of funds. The TDR is offered at competitive terms, and the proceeds are exclusively used for Union Capital’s lease financing business.
Under this scheme, the deposit amount will mature to a lump sum amount on the completion of the term. In this scheme, profit will be accumulated and thereby will help individuals to meet their substantial future requirements.
| Term | Rate |
| 1 Year | 13.00% |
| 2 Year | 13.25% |
| 3 Year – 5 Year | 13.50% |
Union Capital is authorized to take term deposits under the Financial Institution license granted by the Bangladesh Bank.
2.8.9 Security Trading through DSE and CSE:
Union Capital’s predecessor was credited with a number of accomplishments in 1996 and 1997, which includes being one of the top brokers in the market, a preferred broker for most of the Foreign Institutional Investors (FII), a leader in placing most of the foreign trenches of IPOs and a brokerage house with no settlement defaults as confirmed by the multinational custodian banks. The success story continues, as Union Capital remains the premier choice of the FIIs dealing in Bangladesh.
Full-service retail brokerage is the latest and an exciting addition to S&T’s services. The purpose of the Retail Brokerage division is to offer individual investors with international standard brokerage service. The Silver Premium Retail Account (SPRA) offers one of the most convenient, flexible and cost-effective ways to invest in the local stock market.
Sales and Trading has designed a unique product for institutional clients which give them the necessary tools to make prudent investment decision. The Silver Premium Institutional Account (SPIA) offers institutions an efficient and informed way to operate in the domestic capital market.
2.8.10 Research
The research analysts at Union Capital work diligently to produce in-depth company-specific fundamental research. In addition to fundamental analysis, Research analyzes the technical aspect of stocks and the market to follow particular trend of price movements. Research also provides crucial after-market service to CFIB clients by disseminating objective information to investors.
Industry and sector analysis of Union Capital research reports contain detailed information on the current infrastructure and future growth potential, attractiveness of different sectors, through review on different companies in the sector through comparable and valuation analysis. Research also provides macroeconomic, political and market outlook of Bangladesh to foreign institutional investors.
The Union Capital Index (UCI) is the leading benchmark of performance of selected blue-chip stocks of the Dhaka Stock Exchange. It is published in major English and Bangla newspapers in the country. UCI is the first blue-chip index for the capital markets of Bangladesh.
2.9 Competitors of Union Capital Limited:
Lease financing was first introduced in Bangladesh in the early 1980s.Now; leasing sector comprises of 28 Non-bank financial Institution (NBFI).Among them the main competitors of Union Capital Ltd. are:
Non Banking Financial Institutes
United Leasing Company Ltd.
Industrial Development Leasing Company of Bangladesh Ltd.
Ultra Finance and Investment Ltd.
Industrial Promotion and Development Company of Bangladesh
Phoenix Leasing Co. Ltd.
Prime Finance and Investment Ltd.
Industrial Development Leasing Company of Bangladesh Ltd. (IDLC), the first leasing company of the company, was established in 1986 under the regulatory framework of Bangladesh Bank. It was a joint venture of the Industrial Promotion and Development Company of Bangladesh Ltd. (IPDC), International Finance Corporation, and Korean Development Leasing Corporation. Another leasing firm, the United Leasing started its operation in 1989. The number of leasing companies grew quickly after 1994 and by the year 2000, rose to 16. The leasing business became competitive with the increase in the number of companies and wider distribution of the market share.
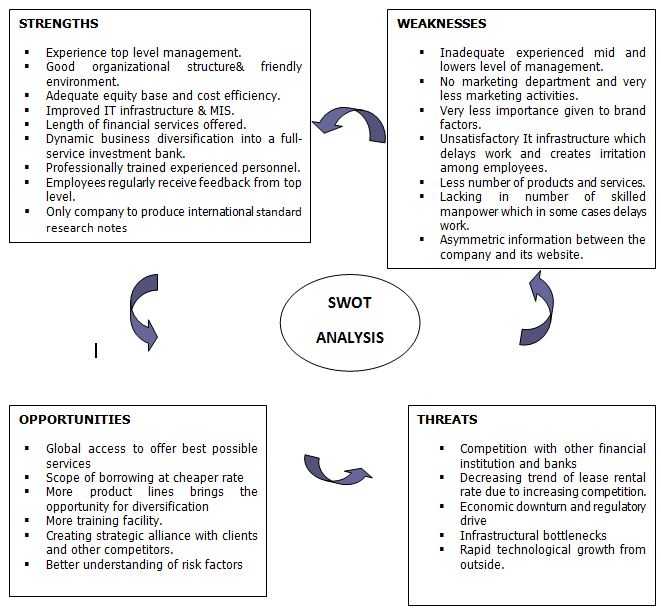
2.10 SWOT analysis of Union Capital Limited
2.11 Performances of Union Capital Ltd. over the last five years:
Last Five Years Financial Highlights- at a glance
Figures in ‘000 Taka
| Particulars | 2002 | 2003 | 2004 | 2005 | 2006 |
| Authorized Capital | 500,000 | 500,000 | 500,000 | 500,000 | 500,000 |
| Paid up Capital | 40,478 | 50,500 | 132,695 | 160,942 | 193,130 |
| Contract | |||||
| Lease | 252,000 | 311,880 | 323,400 | 539,683 | 911,819 |
| Term Finance | – | 500 | 75,400 | 91,460 | 269,700 |
| Total | 252,000 | 312,380 | 398,800 | 631,143 | 1,181,519 |
| Growth | -11 | 24 | 28 | 58 | 87 |
| Disbursed | |||||
| Lease | 209,290 | 369,290 | 300,770 | 403,046 | 589,903 |
| Term Finance | 280 | 500 | 10,550 | 111,860 | 122,550 |
| Total | 209,570 | 369,790 | 311,320 | 514,906 | 712,453 |
| Growth | 14 | 76 | -16 | 65 | 38 |
| Total Asset | 456,898 | 677,998 | 807,126 | 1,218,430 | 1,608,695 |
| Total Liability | 406,333 | 607,529 | 631,963 | 998,008 | 1,352,080 |
| Shareholders Equity | 50,565 | 70,468 | 175,163 | 220,420 | 256,614 |
| Operational Income | 59,754 | 239,384 | 115,119 | 135,106 | 198,321 |
| Operational Expenses | 49,409 | 226,088 | 84,859 | 94,517 | 159,858 |
| Profit before Tax | 11,077 | 13,521 | 29,891 | 42,999 | 42,526 |
| Profit after Tax | 11,077 | 13,521 | 29,275 | 40,999 | 36,194 |
3.1 Introduction:
Non Banking Financial Institutions (NBFIs) represents one of the most important part of a financial system. In, Bangladesh, NBFI’s are new in the financial system compared to bank companies. Beginning with HBFC (House Building Finance Corporation) in 1973, the number of NBFI’s in Bangladesh reached 28 by now. The NBFIs have extended their business in industrial, commercial and housing financing, and stock market activities and are active participants in the inter bank money market transactions. One important feature of NBFIs is the deployment of funds in the long term financing on a sustainable basis that is known as term financing .Another important feature is Lease financing.
3.1.1 Lease Financing:
Lease is a contract between the owner and the user of the asset s for a certain time period during which the second party uses an asset in exchange of making periodic rental payments to the first party without purchasing it. Under lease financing, the lessee regularly pays the fixed lease rent over a period of time at the beginning or at the end of a month, 3 months, 6 months, or a year. At the end of a lease contract the asset reverts to the real owner.
3.1.2 Leasing in Bangladesh:
Leasing in Bangladesh, like in many of its peer countries, owes its origin to the efforts of the International Finance Corporation (IFC), Washington. At the instance of IFC, the first leasing company in Bangladesh, Industrial Development Leasing Company of Bangladesh (IDLC) was set up in 1984 and commenced its operation in 1986, with a 20% shareholding from Korea Development Leasing Corporation. For several years, IDLC remained the sole leasing company in Bangladesh. However, the real momentum began in the 1990s. The country’s central bank, Bangladesh Bank, put in place a regulatory mechanism under the Financial Institutions Act 1993 and the Financial Institutions Regulations 1994.In 1997, there were 15 leasing companies in the country. The function of lease business include lease financing, short- term financing, house building financing, and merchant banking and corporate financing. In this last group of functions, the leasing business in Bangladesh moved away from regular leasing activities and is now involved in stock- market related activities such as issue management, underwriting, trust management, private placement, portfolio management and mutual fund operation. Broad capital market operation s of the lease financing institutions include bridge financing, corporate
counseling, mergers and acquisition, capital restructuring, financial engineering, and lease syndication. Prominent among the sectors of the economy that now receive lease financing services are textiles, apparels and accessories, transport, construction and engineering, paper and printing, pharmaceuticals, food and beverage, chemicals, agro based industries, telecommunications, and leather and leather products.
The selection of lease proposals is relatively free from extraneous pressure and is subject to a quality level appraisal. Under lease agreements in the private sector, projects are sanctioned and implemented expeditiously, resulting in benefits in time and cost savings. Private leasing companies also attract clients by providing relatively better services. The down payments in leasing are not high and the gestation period is low.
Leasing companies, however, face some problems in conducting their business in the country. The relatively slow growth of the demand side compared to the fast growth of the lease business is one such problem. This leads many leasing companies to operate in partial capacity. The culture of loan default that prevails in the country is also a deterrent. Leasing companies often find it difficult to raise funds through short-or long term borrowing from money and capital markets. They are hard pressed to deal with the financial assets because of the present laws of the country, which are also not fully enforceable.
Competition among the leasing companies has grown stronger with the growth of the NBFIs. So, NBFIs are today becoming increasingly concerned with the pursuit of goals and with their progress in achieving those goals. As, it is the time of competition, it is becoming increasingly difficult for them to cope with those goals they have set for themselves. New company’s entered into the market with new and innovative products to attract the customers, offer lower interest rate, high quality service. But market is not full of just threats; it offers huge opportunities also. Those NBFIs that could set its objectives in order to gain access to the opportunities by using its vision and could gather the necessary talents and back-up resources might be able to survive and become the best operator in the market.
Performance analysis is the best ways to measure any NBFI’s performance. It helps in analyzing the company’s financial statement and compare the findings with that of the competitors. In this report the researcher has chosen the topic “A Comparative Performance Analysis of Union Capital Ltd. with Three Other Leasing Companies“.
Here, the researcher wants to make a comparative performance analysis of Union Capital Ltd with its major competitors Industrial Development Leasing Company of Bangladesh Limited (IDLC), United Leasing Company Limited and Uttara Finance Limited. The researcher here used ratio analysis technique to find out the ultimate result. Here the researcher has done Comparative Performance Analysis on the basis of:
a) Liquidity Analysis:
Current ratio
Debt Equity Ratio
Time Interest Earned Ratio
Financial Expenses Coverage Ratio
b) Operating Efficiency Analysis:
Account receivable Turnover ratio
Asset Turnover Ratio
Earning Per Share
Dividend pay-out ratio
c) Profit and Profitability Analysis:
Return on Asset (ROA)
Return on Equity (ROE)
Net Income ratio
d) Market Value Analysis:
Price Earning Ratio
e) Business Output Analysis:
Total Asset Position, Asset per Employee, Asset per Branch
Fixed Asset Position, Fixed Asset per Employee, Fixed Asset per Branch
Total Contract
Total disbursement
f) Employee productivity Analysis:
Operating Income, Operating Income per Employee, Operating Income per Branch
Operating Expense, Operating Expense per Employee, Operating Expense per Branch
Contract per Employee, Contract per Branch ,
Disbursement per Employee, Disbursement per Branch
3.2 Comparative Performance Analysis of Union Capital Limited with IDLC, United Leasing Company Limited & Uttara Finance And Investment Limited:
3.2.1 Liquidity Analysis:
3.2.1.1 Current Ratio
This ratio helps to measure the short-term solvency because it provides an indicator of the extent to which the claims of short-term creditors are covered by assets that are expected to be converted to cash in a period roughly corresponding to the maturity of the claims.
The current ratio of UCL, IDLC, ULC, Uttara finance in the last five years (2002, 2003, 2004, 2005, and 2006) is depicted in the following table:
Year | UCL | IDLC | ULC | Uttara Finance |
2002 | 0.67 | 1.1 | 1.1 | 0.5 |
2003 | 0.59 | 1.2 | 1.2 | 2.2 |
2004 | 2.4 | 1.1 | 1.3 | 1.2 |
2005 | 2.0 | 0.9 | 1.4 | 1.2 |
2006 | 1.4 | 0.8 | 0.9 | 1.1 |
The current ratio graph resembles almost same condition for all the companies. In the FY 2002 current
ratio of ULC & IDLC was in a better state to pay out its current obligation from current earning generating activity than UCL & Uttara finance. In the FY 2003 Uttara finance had increased their current ratio. IDLC & ULC also increased their current ratio but UCL faced a fall in that case. After that year UCL’s current ratio is in a high position compared to other company.
As the current ratio provides the best single indicator of the extent to which the claims of the short- term creditors are covered by assets that are expected to be converted to cash fairly quickly, in the year 2005, 2006 we can say that the liquidity position is somewhat weak in UCL. Still, because current assets are scheduled to be converted to cash in the near future, it is highly probable they could be liquidated at close to their stated value. Due to less current obligation current ratio of all the companies are also increasing year by year. This is a good indication for any company
3.2.1.2Time Interest Earned Ratio
This ratio serves as one of the bank’s ability to meet its interest payments .In general the higher the ratio, the greater the likelihood that the company could cover its interest payments without difficulty.
The Time Interest Earned Ratio of UCL, IDLC, ULC, Uttara finance in the last five years (2002, 2003, 2004, 2005, and 2006) is depicted in the following table:
Year | UCL | IDLC | ULC | Uttara Finance |
2002 | 1.12 | 1.33 | 2.05 | 1.71 |
2003 | 1.09 | 1.45 | 1.78 | 1.60 |
2004 | 1.46 | 1.49 | 1.96 | 1.69 |
2005 | 1.61 | 1.44 | 1.71 | 1.56 |
2006 | 1.33 | 1.26 | 1.38 | 1.95 |
From the above figure it can be seen that ULC has the highest TIE ratio. So, its ability to meet its interest payments is quiet good than others though it has some ups and down over the year. Uttara finance is in second position. IDLC has its steady growth over the year. UCL has always kept their TIE ratio growing since 2002 except the year 2003. In this year UCL’s operating expenses were higher than its operating incomes. As a result the UCL didn’t have enough funds to pay their interest charges at full. Now in the year 2006 it sheds some light on UCL’s capacity to take on new debt as it is now in the position to cover annual interest with operating income. So UCL is in quiet safe position so far.
3.2.1.3 Debt Equity Ratio (times)
The Debt Equity ratio is computed by simply dividing the total debt (including current liabilities) of UCL to Shareholders’ Equity. A comparison of debt to equity ratio for a given company with that of similar one’s give us a general indication about the credit worthiness and financial risk of the firm.
The debt equity ratio of UCL, IDLC, ULC, Uttara finance in the last five years (2002, 2003, 2004, 2005, and 2006) is depicted in the following table:
Year | UCL | IDLC | ULC | Uttara Finance |
2002 | 6.8 | 7.1 | 6.0 | 2.4 |
2003 | 8.6 | 7.5 | 6.0 | 4.0 |
2004 | 3.6 | 7.6 | 5.9 | 2.8 |
2005 | 4.5 | 8.0 | 5.3 | 2.9 |
2006 | 5.2 | 9.3 | 5.7 | 1.8 |
From the above table we can see that the debt equity Ratio of IDLC was too much in 2006. In that year the creditors are providing 9.3 times of financing for each $ 1 provided by the shareholders’. Creditors would generally like this ratio to be low. So, it would experience difficulty with creditors because of an excessive debt- equity ratio. On the other hand, Uttara Finance & ULC have comparatively lowering their debt equity ratio over the year. Now, in case of UCL the debt equity Ratio was too much in 2003. In that year the creditors are providing 8 times of financing for each $ 1 provided by the shareholders’. After the year 2003, debt equity ratio is going to be decreased and in the year 2006 it is in quiet medium level. So, it would not experience that much difficulty with creditors compare to others.
3.2.1.4 Financial Expenses Coverage Ratio (times)
The Financial Expenses Coverage Ratio (times)ratio of UCL, IDLC, ULC, Uttara finance in the last five years (2002, 2003, 2004, 2005, 2006) is depicted in the following table:
Year | UCL | IDLC | ULC | Uttara Finance |
2002 | 1.3 | 1.6 | 2.2 | 2.1 |
2003 | 1.2 | 1.5 | 2.0 | 1.6 |
2004 | 1.4 | 1.6 | 2.2 | 1.7 |
2005 | 1.5 | 1.5 | 1.9 | 1.5 |
2006 | 1.3 | 1.3 | 1.4 | 1.5 |
It can be seen that financial expenses has increased over the year 2002-2005 mainly because of liquidity crunch in the market during the first half of the year 2006 which resulted in borrowings from call market at a substantial high rate and overall increase of interest rate in the market. So, all the competitors have to face a lot of competition in the market. The company that manages borrowing at a low interest rate will win the market. From this viewpoint the performance of UCL is good and in the same level of IDLC.
3.2.2 Operating Efficiency Analysis:
3.2.2.1 A/R Turnover Ratio
The A/R turnover ratio shows the quality of the firm’s receivables and how successful the firm is in its collections. The ratio tells us the number of times accounts receivables have been turned over (into Cash) during the year. The higher the turnover, the shorter the time between the operational revenue and cash collection.
The A/R turnover ratio of UCL, IDLC, ULC, Uttara finance in the last five years (2002, 2003, 2004, 2005, and 2006) is depicted in the following table:
Year | UCL | IDLC | ULC | Uttara Finance |
2002 | 5.62 | 5.62 | 6.71 | 3.91 |
2003 | 3.11 | 1.97 | 2.67 | 3.84 |
2004 | 2.28 | 1.83 | 4.08 | 1.72 |
2005 | 1.83 | 2.32 | 4.8 | 3.84 |
2006 | 2.09 | 3.10 | 2.73 | 3.91 |
From the table it can be seen that ULC had the highest A/R turnover Ratio in the year 2002.After that it has decreased. Now in the FY 2006 ULC’s A/R turnover Ratio is 2.73 which is quiet low than IDLC & Uttara Finance .On the other hand, IDLC faced a dramatically fall in case of cash collection from the year 2002-2004.In the FY 2006 it has increased it’s performance. Uttara finance has faced the same condition like IDLC. At last in case of UCL A/R turnover Ratio is in very good position in the year 2002.After that it has decreased gradually. That means, in these years the company cannot show its performance in case of cash collection. But, the matter of hope is that in the year 2006 A/R turnover ratio increased than the previous years. It is a good sign for the company.
3.2.2.2 Asset Turnover Ratio
It measures the ability of the management team of any organization to employ assets effectively to generate revenue.
The Asset Turnover Ratio of UCL, IDLC, ULC, Uttara finance in the last five years (2002, 2003, 2004, 2005, and 2006) is depicted in the following table:
Year | UCL | IDLC | ULC | Uttara Finance |
2002 | 0.15 | 0.34 | 0.39 | 0.33 |
2003 | 0.15 | 0.13 | 0.13 | 0.32 |
2004 | 0.16 | 0.12 | 0.13 | 0.14 |
2005 | 0.13 | 0.12 | 0.13 | 0.15 |
2006 | 0.14 | 0.12 | 0.12 | 0.14 |
The table shows that ULC had the highest asset turnover ratio in the year 2002 compared to other companies. Higher fixed asset turnover ratio indicates the effective use of the assets of the company to generate sales. After that it has faced a downward trend in the total asst turnover ratio. The management did not perform accordingly to generate maximum revenue by utilizing the total asset. IDLC has faced the same condition like ULC. In the FY 2005 Uttara Finance & UCL have the highest asset turnover ratio than other competitors. From the year 2002 UCL has faced a downward trend but in 2005 the ratio bar of UCL slightly moved to upward direction indicating that the company is trying to boost the ratio and is trying to use its asset efficiently.
3.2.2.3 Earning Per Share
The earnings per share provide a direct measure of the returns flowing to the owners-that means its stockholder
The earning per share of UCL, IDLC, ULC, Uttara finance in the last five years (2002, 2003, 2004, 2005, and 2006) is depicted in the following table:
(Amount in Taka)
Year | UCL | IDLC | ULC | Uttara Finance |
2002 | 21.33 | 80.7 | 37 | 77.50 |
2003 | 26.77 | 75.4 | 53 | 83.52 |
2004 | 22.06 | 89.3 | 73 | 132.01 |
2005 | 25.47 | 101.8 | 85 | 144.50 |
2006 | 18.74 | 103.4 | 59 | 95.54 |
It is seen in the table that the performance of IDLC from the viewpoint of profitability is good as profitability level is good over the FY 2002-2006. Uttara Finance had the highest EPS in the year 2005 but it goes to 95.54 in the year 2006.ULC has faced the same condition like Uttara finance. Compare to these competitors UCL’s earning per share is too poor and is not satisfactory.
3.2.2.4 Dividend payout ratio
Dividend payout ratio is the ratio between dividend per share and earning per share. The ratio indicates the percentage of a company’s earnings that is paid out to shareholders. It could be cash dividend or stock dividend or both. A stock dividend is simply the payment of additional shares of common stock to shareholders. It represents nothing more than a bookkeeping shift within the shareholder’s equity account on the firm’s balance sheet.
The Dividend payout ratio of UCL, IDLC, ULC, Uttara finance in the last five years (2002, 2003, 2004, 2005, and 2006) is depicted in the following table:
Year | UCL | IDLC | ULC | Uttara Finance |
2002 | 84% | 37% | 45% | 32% |
2003 | 74% | 39% | 34% | 29% |
2004 | 81% | 39% | 27% | 18% |
2005 | 78% | 36% | 25% | 17% |
2006 | – | 37% | 33% | 31% |
Here we can see that UCL has the highest dividend pay out ratio from the year 2002-2006.In 2003 and 2004 its getting lower but it declares 84% dividend in 2006 which is the highest than the other competitors. This is an indication that the company’s earning increases to a new level and UCL is confident enough in increasing dividend as it feels it can maintain the increase in earnings. We can also say that highest dividend payout ratio of UCL indicates better cash position and overall liquidity of the company. Because dividend mainly represent a cash outflow. The greater the cash position and overall liquidity, the greater its ability to pay a dividend. Here we found that though IDLC is more profitable company but it’s ability to pay a dividend is lower than UCL. Because we found that its funds may not be liquid as it goes into fixed asset and permanent working capital. The management of such a company usually desires to maintain some liquidity cushion to give it financial flexibility and protection against uncertainty; it may be reluctant to jeopardize this position to pay a large dividend. The same explanation can be applied in case of ULC and Uttara finance.
3.2.2.5 Operating Income:
The Operating Income of UCL, IDLC, ULC, Uttara finance in the last five years (2002, 2003, 2004, 2005, and 2006) is depicted in the following table:
(Figure in ’000)
Year | UCL | Growth rate (%) | IDLC | Growth rate (%) | ULC | Growth rate (%) | Uttara Finance | Growth rate (%) |
2002 | 224536 | 1,618,966 | 1,307,077 | 531,180 | ||||
2003 | 239384 | 6.61% | 698,490 | -56.86% | 553,392 | -57.66% | 313,308 | -41.02% |
2004 | 115118 | -51.91% | 785,923 | 12.52% | 617,622 | 11.61% | 433,893 | 38.49% |
2005 | 135106 | 17.36% | 975,811 | 24.16% | 678,428 | 9.85% | 637404 | 46.90% |
2006 | 198321 | 46.79% | 1,237,916 | 26.86% | 739,236 | 8.96% | 862,483 | 35.31% |
We found that operating income of UCL decreased in the year 2004, after that it is in an increasing trend. Operating income of IDLC, ULC, Uttara Finance decreased in the year 2003. After that they can also increase their operating income position. In the year 2006 operating income of IDLC is the highest, Uttara Finance is in second position and ULC is in third position. UCL’s performance is quiet good than the previous years.
3.2.2.6 Operating Expenses:
The Operating Expense of UCL, IDLC, ULC, Uttara finance in the last five years (2002, 2003, 2004, 2005, and 2006) is depicted in the following table:
(Figure in ’000)
| UCL | Growth rate (%) | IDLC | Growth rate (%) | ULC | Growth rate (%) | Uttara Finance | Growth rate (%) | |
2002 | 114566 | 1,420,277 | 1,095,825 | 445,675 | ||||
2003 | 226088 | 97.34% | 489,412 | -65.54% | 315472 | -71.21% | 212,557 | -52.31% |
2004 | 84859 | -62.47% | 589,625 | 20.48% | 331481 | 5.07% | 314,920 | 48.16% |
2005 | 94517 | 11.38% | 723,023 | 22.62% | 409627 | 23.57% | 423,234 | 34.39% |
2006 | 159858 | 69.13% | 1,015,480 | 40.45% | 576146 | 40.65% | 593,090 | 40.13% |
Here we found that operating expenses of the companies is lower than the operating income.
3.2.3 Profit and Profitability Analysis:
3.2.3.1 Return on Asset
Return on Asset measures the efficiency of assets used to generate income. Income from Operations excludes any expenses such as income taxes and financing charges.
The ROA ratio of UCL, IDLC, ULC, Uttara finance in the last five years (2002, 2003, 2004, 2005, and 2006) is depicted in the following table:
Year | UCL | IDLC | ULC | Uttara Finance |
2002 | 2.69% | 2.52% | 2.33% | 5.89% |
2003 | 2.26% | 2.08% | 2.74% | 4.72% |
2004 | 3.94% | 2.10% | 3.31% | 5.24% |
2005 | 3.97% | 2.63% | 3.44% | 4.49% |
2006 | 2.56% | 2.53 % | 2.10% | 3.75% |
From the above table we can see that Uttara Finance had the highest ROA in the FY 2002.In this year the company generated more profit by using the asset properly. After that it cannot keep consistency in generating sufficient profit and is becoming lower that is 3.75% in the year 2006 but is greater than other competitors.ULC shows its consistent performance over the year by using the asset properly. IDLC also shows its increasing trend from the FY 2003-FY 2006. The company invested more in leases and term finance and was able to generate sufficient profit to strengthen the ROA figure. In year 2004, 2005 the ROA of UCL is in very good position and the company generated more profit by using the asset properly. But in the year 2006 it has decreased as the company invested more in leases and term finance but it can not generate sufficient profit to strengthen the ROA figure yet. Compared to other competitors we can say that still UCL is in good position in case of generating profit.
3.2.3.2 Return on Equity (after Tax)
Return on Equity is a measure of the rate of returns flowing to the bank’s shareholders. It approximates the net benefit the stockholder’s receives from investing their capital in the bank.
The ROE ratio of UCL, IDLC, ULC, Uttara finance in the last five years (2002, 2003, 2004, 2005, and 2006) is depicted in the following table:
Year | UCL | IDLC | ULC | Uttara Finance |
2002 | 16.23% | 24.26% | 15.46% | 37.37% |
2003 | 11.01% | 19.14% | 19.80% | 31.77% |
2004 | 23.84% | 18.77% | 23.02% | 38.19% |
2005 | 20.33% | 18.98% | 22.64% | 33.73% |
2006 | 15.17% | 17.45% | 13.76% | 23.57% |
From the above table it can be seen that Uttara Finance always maintained their ROE high than the competitors. A high return on equity often reflects the bank’s acceptance of strong investment opportunities and effective expense management.ROE position of IDLC & ULC decrease in the year 2006.They cannot effectively control their expenses and make a greater use of debt. In case of UCL it can be seen that in the year 2004 ROE is higher that is 24.34%.However, if the UCL has chosen to employ a level of debt that is high, a high ROE might simply be the result of assuming excessive financial risk. In the year 2005 & 2006 ROE is lowering down due to the company’s greater use of debt.
3.2.3.3 Net Income Ratio
The net profit margin reflects the effectiveness of expense management (cost control) and service pricing policies. It is the ratio of net income after taxes to total operational revenue.
The Net Income Ratio of UCL, IDLC, ULC, Uttara finance in the last five years (2002, 2003, 2004, 2005, and 2006) is depicted in the table:
Year | UCL | IDLC | ULC | Uttara Finance |
2002 | 18.54% | 7.32% | 5.87% | 17.50% |
2003 | 15.24% | 16.20% | 19.93% | 14.45% |
2004 | 25.43% | 17.04% | 24.90% | 36.50% |
2005 | 30.05% | 15.63% | 26.35% | 29.92% |
2006 | 18.25% | 12.70% | 16.66% | 25.82% |
Since 2002 the net income ratio of Uttara Finance has been increasing which is a good sign for any company. The company’s net income is increasing in consecutive four years resembles that the mangers of this company has been able to reduce the expense that rises from the company’s day to day activity.UCL is in the second position among the competitors. So, we can say that UCL has better managerial ability to cope up with the adverse situation that occurs from day to day transaction. UCL was able to reduce their day to day transactional expenses by managing their operation in a cost effective manner.
3.2.4 Market Value Analysis
3.2.4.1 Price earning ratio:
Price earning ratio of UCL, ULC, IDLC, Uttara Finance in the last five years (2002, 2003, 2004, 2005,2006) is depicted in the following table:
Year | UCL | IDLC | ULC | Uttara Finance |
2002 | n/a | 7.90% | 10.08% | 5.98% |
2003 | n/a | 8.53% | 6.45% | 5,74% |
2004 | n/a | 8.85% | 3.92% | 5.27% |
2005 | n/a | 7.27% | 4.11% | 2.90% |
2006 | n/a | 7.58% | 9.47% | 5.35% |
ULC has the highest price/earning ratio in 2006.IDLC is in second position and Uttara Finance is in third position. P/E ratio is higher for the firms with high growth prospects and lower for the riskier firms. So, ULC’s growth prospect is higher compare to others.
3.2.5 Business Output Analysis:
3.2.5.1 Total Asset:
Total asset of UCL, ULC, IDLC, Uttara Finance in the last five years (2002, 2003, 2004, 2005, 2006) is depicted in the following table:
(Figure in ‘000)
| UCL | Growth rate (%) | IDLC | Growth rate (%) | ULC | Growth rate (%) | Uttara Finance | Growth rate (%) | |
2002 | 652643 | 4828905 | 3737521 | 1823116 | ||||
2003 | 677997 | 3.88% | 5920661 | 22.61% | 4305560 | 15.20% | 2423002 | 32.90% |
2004 | 807126 | 19.05% | 6788496 | 14.66% | 4974446 | 15.54% | 3614049 | 49.16% |
2005 | 1218428 | 50.96% | 8798574 | 29.61% | 5418097 | 8.92% | 4863653 | 34.58% |
2006 | 1608695 | 32.03% | 11169870 | 26.95% | 6283863 | 15.98% | 6985534 | 43.63% |
From the above table we can see that IDLC has the highest level of total asset and it has an increasing trend from the year 2002-2006. ULC is in second position and Uttara Finance is in third position in terms of their asset position. They also face an increasing trend. In case of UCL though the asset level of them is lower compared to its competitors but according to their company size we can see that they are trying to boost up their asset position and following the increasing trend. So, there is a good indication that UCL can cover up their risks and all those liabilities with this asset level.
3.2.5.2 Asset per Employee:
| Year | UCL | IDLC | ULC | Uttara Finance |
| 2002 | 65264 | 25415 | 101014 | 14944 |
| 2003 | 52153 | 28194 | 102513 | 17307 |
| 2004 | 40356 | 29515 | 105839 | 22588 |
| 2005 | 52975 | 35194 | 80867 | 26290 |
| 2005 | 69943 | 37232 | 73927 | 34928 |
From the table we found that United Leasing Company has the highest asset level per employee basis, but it decreases over the year. But in case of IDLC and Uttara finance asset level per employee increases over the year. So, the employees of these two companies are comparatively in safe position. In case of UCL though it faces decreasing trend from the year 2002-2004 but after that UCL increases their asset level position on per employee basis which is higher than IDLC and Uttara Finance and Investment Company Limited.
3.2.5.3 Asset per Branch:
| Year | UCL | IDLC | ULC | Uttara Finance |
| 2002 | 652643 | 4828905 | 1868760 | 1823116 |
| 2003 | 677997 | 2960330 | 2152780 | 2423002 |
| 2004 | 807126 | 1697124 | 2487223 | 3614049 |
| 2005 | 609214 | 1466429 | 1806032 | 4863653 |
| 2006 | 804347 | 1396233 | 1256772 | 3492767 |
From the above table we got a mixed picture. Only UCL and Uttara Finance in the above figure keep their steady growth over the year and their asset level per branch basis is quiet good than ULC and IDLC. Here we found that UCL & Uttara Finance has 2 branches which are currently operating in Dhaka and chittagong. On the other hand IDLC has 8 branches and ULC has 5 branches all over the country. According to the number of branches in the country IDLC and ULC cannot generate that much asset per branch basis.
3.2.5.4 Fixed Asset:
Total asset of UCL, ULC, IDLC, Uttara Finance in the last five years (2002, 2003, 2004, 2005, 2006) is depicted in the following table:
| Year | UCL | Growth rate (%) | IDLC | Growth rate (%) | ULC | Growth rate (%) | Uttara Finance | Growth rate (%) |
2002 | 1644 | 10,623 | 12,140 | 4,205 | ||||
2003 | 1764 | 7.30% | 30,201 | 184.30% | 12,662 | 4.30% | 22,382 | 432.27% |
2004 | 1839 | 4.25% | 35,234 | 16.67% | 16,296 | 28.70% | 22,483 | 0.45% |
2005 | 1742 | -5.27% | 57,622 | 63.54% | 17,443 | 7.04% | 25,663 | 14.14% |
2006 | 3499 | 100.86% | 169,486 | 194.13% | 19,916 | 14.18% | 45,081 | 75.67% |
Above table shows that IDLC has highest fixed asset level. This is a big strength for them. But on the other hand we can say that most of their funds may go into fixed asset and permanent working capital. So, they may not be liquid that much which is very important for a company. Uttara finance is in second position and ULC is in third position. Compared to their fixed asset level position UCL has the lowest one.
3.2.5.5 Fixed Asset Per Employee:
Year | UCL | IDLC | ULC | Uttara Finance |
2002 | 164 | 56 | 328 | 34 |
2003 | 135 | 144 | 301 | 159 |
2004 | 91 | 153 | 347 | 140 |
2005 | 75 | 230 | 260 | 139 |
2006 | 152 | 564 | 234 | 225 |
Abovetable shows that IDLC has the highest fixed asset per employee in the year 2006. It maintains increasing trend from the year 2002-2006.ULC and Uttara Finance is the second and third respectively.UCL has the lowest fixed asset position compared to other competitors.
3.2.5.6 Fixed Asset per branch:
Year | UCL | IDLC | ULC | Uttara Finance |
2002 | 1644 | 10,623 | 6,070 | 4,205 |
2003 | 1764 | 15,100 | 6,331 | 22,382 |
2004 | 1839 | 8,808 | 8,148 | 22,483 |
2005 | 871 | 9,603 | 5,814 | 25,663 |
2006 | 1166 | 21,185 | 3,983 | 22,540 |
According to branch basis Uttara Finance has the highest fixed asset position per branch and UCL has the lowest fixed asset position per branch.
3.2.5.7 Total contract:
Total contract (Lease, Term Finance) of UCL, ULC, IDLC, Uttara Finance in the last five years (2002, 2003, 2004, 2005, 2006) is depicted in the following table:
(Figure in ‘000)
| Year | UCL | Growth rate (%) | IDLC | Growth rate (%) | ULC | Growth rate (%) | Uttara Finance | Growth rate (%) |
2002 | 252,000 | 140,565 | 1,622,104 | 905,718 | ||||
2003 | 312,380 | 23.96% | 173,232 | 23.23% | 1,866,643 | 15.07% | 1,222,340 | 34.95% |
2004 | 398,800 | 27.67% | 209,267 | 20.80% | 2,306,308 | 23.55% | 2,013,010 | 64.68% |
2005 | 631,143 | 58.26% | 262,532 | 25.45% | 2,809,257 | 21.80% | 2,542,907 | 26.32% |
2006 | 1,181,519 | 87.20% | 2,284,626 | 770.22% | 2,684,534 | (4.43)% | 2,781,505 | 9.38% |
We found that ULC has the highest contract level over the year 2002-2005.But in the year 2006 the contract level falls slightly. Uttara finance is in second position and performs very well over the year. IDLC get more contract in 2006.Compared to them UCL keep their steady growth trend over the year 2002-2006.
3.2.5.8 Total disbursement:
Total disbursement (Lease, Term Finance) of UCL, ULC, IDLC, Uttara Finance in the last five years (2002, 2003, 2004, 2005, 2006) is depicted in the following table:
| Year | UCL | Growth rate (%) | IDLC | Growth rate (%) | ULC | Growth rate (%) | Uttara Finance | Growth rate (%) |
| 2002 | 209,570 | 120,500 | 1,132,404 | 830,104 | ||||
| 2003 | 299,790 | 43.05% | 123,222 | 2.25% | 1,322,564 | 16.79% | 1,122,858 | 35.26% |
| 2004 | 311,320 | 3.84% | 188,190 | 52.72% | 1,788,980 | 35.26% | 1,172,906 | 4.45% |
| 2005 | 514,906 | 65.39% | 211,363 | 12.31% | 2,356,756 | 31.73% | 1,762,106 | 50.23% |
| 2006 | 712,453 | 38.36% | 1,189,626 | 462.83% | 2,478,626 | 5.17% | 2,527,809 | 43.45% |
This table shows the growing disbursement trend of UCL according to the contract.So, they keep their efficiency and effectiveness in providing services.
3.2.6 Employee Productivity Analysis:
3.2.6.1 Operating Income per Employee:
Operating Income per Employee (Lease, Term Finance) of UCL, ULC, IDLC, Uttara Finance in the last five years (2002, 2003, 2004, 2005, and 2006) is depicted in the following table:
Year | UCL | IDLC | ULC | Uttara Finance |
2002 | 22453 | 8521 | 35326 | 4354 |
2003 | 18414 | 3326 | 13176 | 2238 |
2004 | 5756 | 3417 | 13141 | 2712 |
2005 | 5874 | 3903 | 10126 | 3445 |
2006 | 8623 | 4126 | 8697 | 4312 |
Here we can see that in the year 2002 UCL and ULC had the highest operating income per employee. After that it’s getting lower. On the other hand IDLC and Uttara Finance have the per employee basis operating ratios that are comparatively lower than UCL and ULC.
3.2.6.2 Operating Income per Branch:
Operating Income per branch (Lease, Term Finance) of UCL, ULC, IDLC, Uttara Finance in the last five years (2002, 2003, 2004, 2005, and 2006) is depicted in the following table:
Year | UCL | IDLC | ULC | Uttara Finance |
2002 | 224536 | 1618966 | 653538 | 531180 |
2003 | 239384 | 349245 | 276696 | 313308 |
2004 | 115118 | 196480 | 308811 | 433893 |
2005 | 67553 | 162635 | 226143 | 637404 |
2006 | 66107 | 154739 | 147847 | 431241 |
In 2006 Uttara Finance has the highest operating income per branch. In this case UCL’s performance is not good.
3.2.6.3 Operating Expenses per employee:
Operating expense per Employee (Lease, Term Finance) of UCL, ULC, IDLC, Uttara Finance in the last five years (2002, 2003, 2004, 2005, and 2006) is depicted in the following table:
Year | UCL | IDLC | ULC | Uttara Finance |
2002 | 11456 | 7475 | 29617 | 3653 |
2003 | 17391 | 2330 | 7511 | 1518 |
2004 | 4243 | 2563 | 7053 | 1968 |
2005 | 4109 | 2892 | 6114 | 2287 |
2006 | 6950 | 3385 | 6778 | 2965 |
UCL’s operating expenses per employee is getting lower from the year 2003. So, we found that UCL’s operating income is more than operating expenses. It is a good sign for the company.
3.2.6.4 Operating Expenses per branch:
Operating expense per branch (Lease, Term Finance) of UCL, ULC, IDLC, Uttara Finance in the last five years (2002, 2003, 2004, 2005, and 2006) is depicted in the following table:
Year | UCL | IDLC | ULC | Uttara Finance |
2002 | 114566 | 1420277 | 547912 | 445675 |
2003 | 226088 | 244706 | 157736 | 212557 |
2004 | 84859 | 147406 | 165740 | 314920 |
2005 | 47258 | 120504 | 136542 | 423234 |
2006 | 53286 | 126935 | 115229 | 296545 |
IDLC’s per branch operating expenses is highest in 2002.After that it’s getting lower. In 2006, per branch basis operating expenses is highest for Uttara Finance, and then comes IDLC and ULC. The lowest one is UCL.
3.2.6.5 Contract per employee:
Total contract per employee (Lease, Term Finance) of UCL, ULC, IDLC, Uttara Finance in the last five years (2002, 2003, 2004, 2005, 2006) is depicted in the following table:
Year | UCL | IDLC | ULC | Uttara Finance |
2002 | 25,200 | 740 | 811,052 | 7,424 |
2003 | 24,029 | 825 | 622,214 | 8,731 |
2004 | 19,940 | 910 | 576,577 | 12,581 |
2005 | 27,441 | 1,050 | 561,851 | 13,745 |
2006 | 51,370 | 7,615 | 447,422 | 13,908 |
UCL get the highest contract per employee.UCL is in second position. After that there comes Uttara Finance and IDLC.
3.2.6.6 Contract per branch:
Total contract per branch (Lease, Term Finance) of UCL, ULC, IDLC, Uttara Finance in the last five years (2002, 2003, 2004, 2005, 2006) is depicted in the following table:
Year | UCL | IDLC | ULC | Uttara Finance |
2002 | 252,000 | 140,565 | 811,052 | 905,718 |
2003 | 312,380 | 86,616 | 933,321 | 1,222,340 |
2004 | 398,800 | 52,316 | 1,153,154 | 2,013,010 |
2005 | 315,571 | 43,755 | 936,419 | 2,542,907 |
2006 | 590,759 | 285,578 | 536,906 | 1,390,752 |
Uttara Finance and Investment Limited got the highest contract per branch basis in 2005.But in the year 2006, contract amount is getting lower.ULC faces the same condition. IDLC get sudden increase in its contract trend in the year 2006. Only UCL has a steady growing trend in its contract amount.
3.2.6.7 Disbursement per employee:
Total disbursement per employee (Lease, Term Finance) of UCL, ULC, IDLC, Uttara Finance in the last five years (2002,2003, 2004, 2005, 2006) is depicted in the following table:
Year | UCL | IDLC | ULC | Uttara Finance |
2002 | 20,957 | 634 | 30,605 | 6,804 |
2003 | 23,060 | 587 | 31,489 | 8,020 |
2004 | 15,566 | 818 | 38,063 | 7,330 |
2005 | 22,387 | 846 | 35,175 | 9,524 |
2006 | 30,976 | 3,965 | 29,160 | 12,639 |
Table shows that disbursement per employee is good in UCL compared to the other competitors.
3.2.6.8 Disbursement per branch:
Total disbursement per branch (Lease, Term Finance) of UCL, ULC, IDLC, Uttara Finance in the last five years (2002, 2003, 2004, 2005, 2006) is depicted in the following table:
Year | UCL | IDLC | ULC | Uttara Finance |
2002 | 209570 | 120500 | 566202 | 830104 |
2003 | 299790 | 61611 | 661282 | 1122850 |
2004 | 311320 | 47047 | 894490 | 1172906 |
2005 | 257453 | 35227 | 785585 | 1762106 |
2006 | 356226 | 148703 | 495725 | 1263904 |
Uttara Finance and Investment Limited has the highest disbursement per branch and IDLC has the lowest one.UCL has 2 branches in present and from the year 2002-2004 disbursement per branch basis has increased. In the year 2005 disbursement amount is getting lower due to lower contract amount. But after that it is increasing in full phase.
3.2.7 Sector wise disbursement of UCL, IDLC, Uttara Finance, United Leasing:
3.2.7.1 Sector wise disbursement of UCL in 2006:
| Sector wise Disbursement | (%) | Sector wise Disbursement | (%) |
| Chemicals | 4.73% | Service (Institutional) | 10.83% |
| Engineering | 7.38% | IT | 1.54% |
| Petroleum/Power | 2.79% | Food & Beverage | 7.11% |
| Garments & Accessories | 8.12% | Cosmetics & Toiletries | 0.00% |
| Pharmaceuticals | 0.08% | Professional | 2.16% |
| Packaging | 1.23% | Transport (Commercial) | 17.57% |
| Leather | 0.13% | Textile | 30.85% |
| Others | 5.50% |
3.2.7.2 Sector wise disbursement of IDLC in 2006:
| Sector wise Disbursement | (%) | Sector wise Disbursement | (%) |
| Textile | 13.42% | Agro Based Industries | 5.12% |
| Food & beverage | 8.13% | Apparels & Accessories | 4.19% |
| Financial services | 11.12% | Pharmaceuticals | 5.00% |
| Building & construction | 9.20% | Tele Communication | 4.36% |
| Services | 8.13% | Household Products & Home Appliances | 4.55% |
| Packaging | 6.11% | Housing & Real Estate | 4.42% |
| Iron & steel | 5.13% | Information Technology | 3.23% |
| Power & Energy | 5.00% | Education | 1.11% |
| others | 1.44% |
3.2.7.3 Sector wise disbursement of Uttara Finance in 2006:
| Sector wise Disbursement | (%) | Sector wise Disbursement | (%) |
| Chemicals | 8.23%% | Service (Institutional) | 11.26% |
| Engineering | 4.02% | IT | 1.44% |
| Petroleum/Power | 2.26% | Food & Beverage | 8.20% |
| Garments & Accessories | 8.33% | Cosmetics & Toiletries | 0.00% |
| Pharmaceuticals | 0.07% | Leather | 0.12% |
| Professional | 2.11% | Transport (Commercial) | 19.32% |
| Packaging | 1.19% | Others | 3.00% |
| Textile | 30.45% |
3.2.7.4 Sector wise disbursement of ULC in 2006:
| Sector wise Disbursement | (%) |
| Textiles | 20% |
| Chemicals | 13% |
| Other Manufacturing | 24% |
| Services | 31% |
| All others | 12% |
From the above table we have found that IDLC has the highest disbursement in different sector. They have disbursed their fund in different segments efficiently and effectively which others cannot do.
3.3 Major Findings:
The researcher has found some major findings from the analysis which can help to predict the performance of Union Capital Limited. These are:
Liquidity Analysis:
The current ratio provides the best single indicator of the extent to which the claims of the short- term creditors are covered by assets that are expected to be converted to cash fairly quickly. In the year 2005, 2006 we can see that the liquidity position is somewhat weak in UCL than the other competitors. Still, because current assets are scheduled to be converted to cash in the near future, it is highly probable they could be liquidated at close to their stated value.
UCL’s TIE ratio is also in quiet safe position in the year 2006.
UCL has too much debt equity Ratio in 2003.After the year 2003, debt equity ratio is going to be decreased and in the year 2006 it is in quiet medium level. So, it would not experience that much difficulty with creditors compare to others.
The performance of UCL is good in terms of financial expenses coverage and is in the same level of IDLC. The company can manages borrowing at a low interest rate from the market with its competitors.
So from the above analysis we can say that overall liquidity position of UCL is good
Operating Efficiency Analysis:
In the year 2006 A/R turnover ratio increased than the previous years. So, UCL shows its performance in case of cash collection. It is a good sign for the company. UCL also trying to boost up the asset turnover position from the year 2005 and is trying to use its asset efficiently.
UCl’s earning per share is too poor compared to other competitors. But UCL has the highest dividend pay out ratio from the year 2002-2006. This is an indication that the company’s earning increases to a new level and UCL is confident enough in increasing dividend as it feels it can maintain the increase in earnings. We can also say that highest dividend payout ratio of UCL indicates better cash position and overall liquidity of the company.
So, we can say that UCL is trying to operate efficiently.
Profit and Profitability Analysis:
In the year 2006 ROA ratio of UCL has decreased as the company invested more in leases and term finance. We have seen from the above analysis that A/R turnover ratio is slightly increased than the previous year but it can not generate sufficient profit to strengthen the ROA figure. Compared to other competitors we can say that still UCL is in good position in case of generating profit.
In case of UCL it can be seen that in the year 2004 ROE is higher that is 24.34%.However, if the UCL has chosen to employ a level of debt that is high, a high ROE might simply be the result of assuming excessive financial risk. In the year 2005 & 2006 ROE is lowering down due to the company’s greater use of debt.
UCL has better managerial ability to cope up with the adverse situation that occurs from day to day transaction. UCL was able to reduce their day to day transactional expenses by managing their operation in a cost effective manner.
So, we can say that UCL’s profitability position is not that much good compared to
other competitors. Though its liquidity position is good but due to its poor ROA and above average debt it can not generating that much profit.
Business Output Analysis:
In case of UCL though the asset level of them is lower compared to its competitors but according to their company size we can see that they are trying to boost up their asset position and following the increasing trend. So, there is a good indication that UCL can cover up their risks and all those liabilities with this asset level. It’s per employee and per branch basis asset position also good than ULC and IDLC. But the Fixed asset position per employee and per branch basis lower than others.
Compared to others UCL keep their steady growth trend in case of contract and disbursement over the year 2002-2006. So, they keep their efficiency and effectiveness in providing services.
Employee Productivity Analysis:
UCL’s operating income per employee is more than its operating expenses. The company’s per employee basis contract and disbursement are also good.
So, we can say that productivity level of the UCL’s employees is very good and they can effectively meet up their expenses with their profit level.
Sector wise Disbursement:
We found that sector wise disbursement level of UCL is good than the other competitors and they prove their efficiency in these field. But still there are some sectors that are uncultivated by them. So, they have to find out the prominent sector in which they can build up their business.
4.1 Conclusion:
The financial environment has become hyper competitive as the number of non banking financial institutions are increasing. One of the important features of NBFIs is Lease financing. The Lease financing practices in Bangladesh have grown significantly within the last 10 years. Competition among the leasing companies has grown stronger with the growth of the NBFIs, besides entrance of commercial banks in the lease financing market who have the advantage of lower costs of fund compared to the NBFIs. The study found that the performance of Union Capital Limited is satisfactory and as a newly entered public company in the capital market it is trying to grow with the competition and find the ways to serve customers more creatively. But, in order to maintain and attract more depositors and borrowers UCL should develop new products and services like its other competitors. Many customers may not even aware about its existing products and services. So, the company should improve their strategy for advertisement and improve their service quality, it should also concentrate in offering lower interest rate to customers. The market still offers huge opportunities for the leasing business. Those NBFIs that could set its objectives in order to gain access to the opportunities by using its vision and could gather the necessary talents and back-up resources might be able to survive and will becoming the best operator in the market. So, we hope that Union Capital Ltd. will be the one of them.
4.2 Recommendation:
The analysis of the financial performance of Union Capital Ltd. in comparison with the performances of other Leasing companies has revealed to us the financial strengths and weaknesses of the bank. In light of those findings some recommendations is given below:
Union Capital Ltd. should give more emphasis on more growth, more profit and more prestige. Most of the potential customers are not aware about the products and services offered by the Union Capital Ltd. They even don’t know about the functions of the leasing companies. Union Capital could undertake a campaign program to develop the customers as well as general public’s awareness and understanding about the business of the company. In every month this sort of campaign could be undertaken in order to remove the existing ignorance among the common customers about the company’s products and services, new innovations and projects. Advertisement is regarded as the strongest tool of marketing. Regular advertisement in the media likes newspaper, television, radio, etc. Especially the roadside signboard advertisement should be developed to compete with the other Leasing companies. This may increase the operating costs
temporarily but in the long run it could have immense effect on the company’s income and ultimately to its profits. The marketing campaign could also help build customer loyalty towards the products of Union Capital Ltd.
Offering innovative product is very important for any company to retain the existing customers of the company and to draw attention of the new customers. The major competitors of UCL like IDLC, United Leasing Company, Uttara Finance are continuously diversifying their product line and trying to offer the best services to their clients. So, UCL should come up with innovative products and services so that they could compete with the other competitors.
Assigning necessary manpower for every job is very important for UCL. Highly motivated employees with latest skills and technologies can reflect the best performance for any organization. Although UCL is equipped with a skilled and qualified workforce, but there is still some lacking in case of developing motivational program. In order to attract and retain the best brains available in the market UCL should offer attractive pay structure than its competitors. Improve the knowledge of the employees in different sectors of NBFis through training should also be another necessary steps of UCL. Lease finance involves significant technological risks. Proper technical, financial and technological feasibility must be done before executing lease or term finance. The capacity of the operational staff should be enhanced.
There are still a number of potential and uncultivated segments of the market where the Union Capital Ltd. couldn’t reach with its service. The company has to identify these segments with in depth research and feasibility study. As because a NBFI’s survival greatly depend on the operations of its branches, Union Capital Ltd. should also give very much emphasis on its rate of branch expansion. It has only 3 branches at present in Dhaka, Chittagong and in Sylhet. So, UCL should increase their numbers of branches.
UCL should be technologically updated. They should use much more sophisticated technology, software system to satisfy the demands of their clients as quickly as possible. Proper coordination and cooperation of IT department is needed in that case.
In short, Union Capital Ltd. should be very much careful in profit increase, Liquidity reserve, maintaining a good capital adequacy, increase the utilization of asset, and take more measures in risk facing. Implementation of the above recommendations will improve the competency of UCL.