Main purpose of this assignment is to evaluate Ratio Analysis of Singer Bangladesh Limited. Other objectives are to know about a company’s past present and future position also analysis and compare a company’s internal position to make necessary aid. In this ratio analysis here find out earning per show as well as dividend per share’s reset to zero is good, but your debt ratio, total asset turnover percentage, fixed asset turnover percentage current ratio, DSO, web profitability margin ratio, returning on asset, return on common equity will not be in good position.
Introduction
SBL, a multi product financial Institution, We have analyzed on ratio of SBL, on the basis of that, on the common size analysis, we have compared the company’s 4 years performance (2004-07), and that is not so very good position. Though the earning per show and dividend per share’s reset is good, but the debt ratio, total asset turnover ratio, fixed asset turnover ratio current ratio, DSO, net profitability margin ratio, return on asset, return on common equity are not in good position.
OBJECTIVE OF THE STUDY
- To know about a company’s past present and future position.
- To understand and compare a company’s internal position to make necessary aid.
Sources
- SBL Annual Report 2007,2006,2005,2004.
- Dhaka Stock Exchange.
- SBL Main Office.
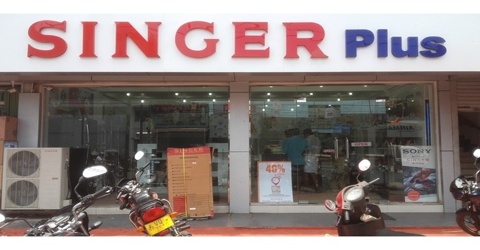
Company Profile
Company Name:
SINGER BANGLADESH LIMITED (SBL)
Corporate History.
Year of Establishment of/ Incorporation 1979
Commencement of Leasing Business 1987
Establishment of Branch in the main port city,
Chittagong 1991
Listed on the Dhaka Stock Exchange 199
Vision
To be the most admired and respected family company in the country.
Mission
Our mission is to improve the quality of life of people by providing comforts and conveniences at affordable prices.
Communize Analysis/ Time Series Analysis
This analysis we can evaluates performance of the internal progress year to year. Here we have analyzed of the year 2007, 2006, 2005, and 2004.
SBL
TK-in million
| SI | Name of the Ratio | 2007 | 2006 | 2005 | 2004 |
| 1 | Profit Margin- Profitability Ratio | 2.86% | 4.58% | 2.83% | 5.68% |
| 2 | Return on Asset- Profitability Ratio | 4.44% | 6.51% | 3.10% | 7.17% |
| 3 | Return on Equity- Profitability Ratio | 27.29% | 35.42% | 22.76% | 42.41%
|
| 4 | Receivable Turnover- Asset Utilization | 6.76 | 6.68 | 7.80 | 8.16 |
| 5 | Average Collection Period-Asset Utilization | 53.28 | 53.86 | 46.17 | 44.15 |
| 6 | Inventory Turnover- Asset Utilization | 2.54 | 2.53 | 2.73 | 2.54 |
| 7 | Fixed Asset Turnover Ratio- Asset Utilization | 10.87 | 8.36 | 10.23 | 10.675 |
| 8 | Total Asset Turnover Ratio- Asset Utilization | 1.55 | 1.42 | 1.094 | 1.353 |
| 9 | Current Ratio- Liquidity Ratio | 1.21 | 1.23 | 1.41 | 1.66 |
| 10 | Quick Ratio- Liquidity Ratio | 0.51 | 0.54 | 0.82 | 0.67 |
| 11 | Debt. Ratio- Debt Utilization ratio | 83.74% | 81.62% | 86.38% | 81.85% |
| 12 | Time Interest Earned- Debt Utilization ratio. | 1.79 | 2.08 | 4.17 | 13.457 |
| 13 | Fixed Charge Coverage- Debt Utilization ratio | 1.79 | 2.08 | 4.16 | 13.46 |
| 14 | Earning Per Share(EPS) | 61.26 | 70.18 | 29.13 | 47.75 |
| 15 | Dividend Per Share(DPS) | 35.00 | 35.00 | 30.00 | 80.00 |
Profit Margin Ratio
Net profitability margin ratio measures the percentage of each sales money remaining after all costs and expenses, including interest, taxes and preferred stock dividends, have been deducted. It is calculates as this formula:
Profit Margin Ratio = Net Profit/Sales
The analyses of 5 years of SBL are, as follows:
| 2007 | 2006 | 2005 | 2004 |
| 2.86% | 4.58% | 2.83% | 5.68% |
Interpretation
In 2007 the net profit margin ratio was 2.86% which is lower then 2006 and 2004 where the ratios were 4.58% and 5.68% and this as not better performance of the firm.
Recommendation
Company should increase their EBIT to keep increasing net profit.
Return on Asset
Return on asset, often called the return on investment. It measures the overall effectiveness of management in generating profits with its available assets. We can get this ratio by this formula,
ROA = Net Income/Total Assets
Higher rate of this ratio indicates the higher/ better position of a firm. Our analysis of the firm SBL are:
| 2007 | 2006 | 2005 | 2004 |
| 4.44% | 6.51% | 3.10% | 7.17% |
Interpretation
In 2004 the ratio was 7.17% which was higher then 2005, 2006 and 2007 where the ratios were 3.10%,6.51% and 4.44% and these indicates the poor position then 2004.
Recommendation
The position of the firm is very bad according to this ratio so it should need to increase its Net income as soon as possible to improve or increase the company situation.
Return on Stockholders Equity
The ratio of net income to common equity measures the return on common equity or the rate of return on stockholders investment,
Return on equity =Net Income/Total stockholders equity
If the present return on equity is more then past ratios that indicates the better position to the present then past. Our analysis of ROE of SBL are given below
| 2007 | 2006 | 2005 | 2004 |
| 27.29% | 35.42% | 22.76% | 42.41% |
Interpretation
In 2004 the return on common equity of SBL was 42.41% which is higher then 2005 where the ratio was 22.76%. The best position of the ratio was in 2004 where the ratio was 42.41% and in 2006 and 2007 ratio were 35.42% and 27.29%.
Recommendation
Company should increase its Net Income against of Stockholders equity to improve the situation of this company.
Receivables turnover
The receivables turnover indicates the number of times on the average that receivables turnover each year. Receivables turnover is calculated follows:
Receivables turnover = Credit sales/Receivables
The ratio of receivables turnover of this firm is given below:
| 2007 | 2006 | 2005 | 2004 |
| 6.76 | 6.68 | 7.80 | 8.16 |
Interpretation:
In 2004 the debt ratio of the SBL was 8.16 which is higher then 2005, where the ratio was7.80. But this is higher then 2006, 2007 where the ratios were 6.68& 6.76.
Recommendation
Company must increase the ratio by decreasing total liabilities or increasing total asset for achieving better position.
Average collection period (DSO)
Average collection period also called Days sales outstanding (DSO), is used evaluate the firm’s ability to collect its credit sales in a timely manner. DSO is calculated as follows:
Average collection period = Receivables/Average daily credit sales
The ratio of Average collection period of this firm is given below:
| 2007 | 2006 | 2005 | 2004 |
| 53.28 | 53.86 | 46.17 | 44.15 |
Recommendation:
In 2004 the DSO of SBL was 44.15 days which was increased. But this also too much time to collect A/R. In 2005, 2006, 2007 the time was 46.17, 53.86 and 53.28.
Interpretation:
Much should aware about this fact that they should try to decrease the time period to collect money from A/R to get a good position.
Inventory turnover:
This ratio indicates the efficiency of the firm’s in selling product. The inventory turnover ratio is defined as follows:
Inventory turnover = Cost of goods sold/Inventory
The ratio of inventory turnover of this firm is given below:
| 2007 | 2006 | 2005 | 2004 |
| 2.54 | 2.53 | 2.73 | 2.54 |
Interpretation:
In 2004 the inventory turnover ratio of the SBL was 2.54 which is very close to one another. And here in 2005, 2006, 2007 the ratio was 2.73, 2.53 and 2.54.
Recommendation
Company must increase the ratio by decreasing total liabilities or increasing total asset in better position.
Fixed Asset Turnover
The fixed asset turnover ration measures how effectively the firm uses its plant and equipment to help generate sales. It is the ration of sales to fixed assts.
Fixed Assets Turnover Ratio = Sales/Fixed Assets
If the present fixed asset turnover ratio is greater than past ratio that would be better for a company. Our analyses of SBL for fixed asset turnover ratio of 4ears are
| 2007 | 2006 | 2005 | 2004 |
| 10.87 | 8.36 | 10.23 | 10.675 |
Interpretation
In 2004, fixed asset turnover ratio was 10.675which was less then 2007, where the ratio was10.87. We can also see in 2005 & 2006’s ratio were 10.23 &8.36.
Recommendation
By this analysis we can understand that sales position is good according to its fixed asset which indicates that company’s effective uses the fixed assets. So to improve this salutation company should increase it sales by using its fixed assets most effectively.
Total Asset Turnover
The total Asset turnover ratio measures how effectively the firm uses its total assets to help generate sales. It is the ratio of sales to total assets.
Total asset turnover: Sales/Total assets
If the present total assets turnover ratio is higher then previous it would be better for the company’s present performance. Our analysis of this ratio of SBL of 4 ears is,
| 2007 | 2006 | 2005 | 2004 |
| 1.55 | 1.42 | 1.094 | 1.353 |
Interpretation
In 2004 the total asset turnover was 1.353which is lower then 2007 where the ratio was 1.55 But there are lower performance in2005, 2006 where the ratio were 1.094, 1.42.
Recommendation
By the analysis we can say that, company must increase their sales.
Current Ratio
The Current ration measures then ability firm’s to meet its short-tern obligations. It is expressed as follows:
Current Ratio: Current assets/Current liabilities
Current Asset includes cash, account receivable and inventories. And current liabilities consist of all payables, current maturities of long tern debt, accrued expenses. It the current liabilities are rising fast than current Assets, the CR will fall and when CR is increased this post year, the present performance of the company will be better then post performance. Here is the 4years CR of SBL:
| 2007 | 2006 | 2005 | 2004 |
| 1.21 | 1.23 | 1.41 | 1.66 |
Interpretation:
In 2007 the CR of SBL was tell which was lower than 2004 when the ratio 1.21which is worst position during 4 years. 2004 are the sure which was considered as good performance.
Recommendation:
By the analysis of 4 years CR of SBL. We can find that the company hasn’t done well over the year and to improve the situation it should graphically enlarge CR by increasing CA or decreasing CL.
Quick ratio:
The quick ratio or acid test ratio is calculated by deducting inventories from current assets and dividing the result by current liabilities. The quick ratio is a variation of the current ratio. The quick ratio or acid test ratio is calculated as follows:
Quick ratio = (Current assets-Inventory)/Current liabilities
The ratio of Quick ratio f this firm is given below:
| 2007 | 2006 | 2005 | 2004 |
| 0.51 | 0.54 | 0.82 | 0.67 |
Interpretation:
In 2004 the debt ratio of the SBL was 0.67which is higher then 2007, where the ratio was0.51. But this is lower then 2005, 2006, where the ratios were 0.82, 0.54.
Recommendation
Company must decrease the ratio by decreasing total liabilities or increasing total asset in better position.
Debt Ratio
The debt ratio measures the proportion of total assets financed by the firm’s creditors. It’s formula:
Debt Ratio = Total Liabilities/Total Assets
Total debt includes both CL and LLB tern debt, creditors prefer low debt ratios because the lower the ratio the greater the cushion against creditors losses in the event of liquidation. Our analysis of this ratio of SBL for 4 years is given below:
| 2007 | 2006 | 2005 | 2004 |
| 83.74% | 81.62% | 86.38% | 81.85% |
Interpretation:
In 2004 the debt ratio of the SBL was 81.86 which is lower then 2007, where the ratio was 83.74. But this is lower then 2005 where the ratios 86.38%
Recommendation:
Company must decrease the ratio by decreasing total liabilities or increasing total asset in better position.
Time Interest Earned Ratio
The time interest earned ratio, measures the firm’s ability to make contractual interest payment, Sometimes it also called as interest coverage ratio, the formula of this ratio is:
Time interest earned Ratio = (Earning before interest takes)/Interest Charges
This ratio measures the extent to which operating income can decline before the form is unable to meet its annual interest costs. If the present ratio is higher then post then it would better for the firm. But the company has to pay tax fewer for lower time interest earned. Our analyses of this SBL are,
| 2007 | 2006 | 2005 | 2004 |
| 1.79 | 2.08 | 4.17 | 13.46 |
Interpretation
In 2004 the time interest earned ratio was 13.46 which were higher then 2007, where the ratio was 1.79. In 2006 though ratio was 2.08 which was lower than 2005.
Recommendation
By the analysis of 4 years ratio we can say that, if the company wishes to decrease its taxation, the company should increase their EBIT.
Fixed charge coverage
Fixed charge coverage measures the firm’s ability to meet all fixed obligations rather then interest payment alone, on the assumption that failure to meet any financial obligation will endanger the position of the firm. The formula of this ratio is:
Fixed charge coverage = Income before fixed charge and taxes/Fixed charge
The ratio of fixed charge coverage of this firm is given below:
| 2007 | 2006 | 2005 | 2004 |
| 1.79 | 2.08 | 4.16 | 13.46 |
Interpretation:
In 2004 the time interest earned ratio was 13.46 which were higher then 2007, where the ratio was 1.79. In 2006 though ratio was 2.08 which was lower than 2005.
Recommendation:
By the analysis of 4 years ratio we can say that, if the company wishes to decrease its taxation, the company should increase their EBIT.
Earning Per share (EPS
EPS represents the amount canned on behalf of each outstanding share of common stock not the amount of earnings actually distributed to share holders. EPS is calculated as follows.
Earning Per Share = EAT (earning after tax) / Number of shares
The ratio of EPS of this firm is given below:
| 2007 | 2006 | 2005 | 2004 |
| 61.26 | 70.18 | 29.13 | 47.75 |
Interpretation:
In 2007 the earning per share of SBL was 61.26% which is lower than 2006, where the ratio was 70.18%. But the ratio of 2005 was 29.1% which is lower than 2004 where the ratio was 47.75%.
Recommendation:
EPS is closely watched by then investing public and is considered an important indictor of corporate EPS success and by the above analysis we can see the good position of the firm.
Dividend Per Share (DPS)
DPS represent the amount of cash actually distributed to each shareholder. It is calculated by
DPS = Cash Dividend/Number of Share
Here is the dividend per share of the SBL,
| 2007 | 2006 | 2005 | 2004 |
| 35.00 | 35.00 | 30.00 | 80.00 |
Interpretation:
The ratio of dividend per share of 2007, 2006, 2005 and 2004 are 35%, 35%, 30%and 80%. Which are same over 2 years and it decreases 50% in 2005.It rises 5%in 2006.
Recommendation:
Ratio rate was by this analysis we can see the increasing and this should be encourage to be attract the shareholder.
Final Recommendation
The EPS and DPS of the SBL were in good position but the firm must should be were of its increasing liabilities. And it also try to utilize it’s assets by effective uses. In other hands the time period of required account receivable collecting which should be decreased. And to increase the total asset turnover the firm should increase its sales and to increase its net income, it should increase its EBT company must should were of these fact to reach in the better position.