Abstract
In an earthquake, the damage at a site is greatly influenced by the response of the soil. In seismic response analysis, the site response is calculated in the form of response spectra for a particular site.
SHAKE is a computer program, which is widely used one dimensional method, has been used for earthquake response analysis of six different locations of SylhetCity. In this program main input values are shear wave velocity of different layers of upper 30m depth. International Building Code (IBC) 2000 has adopted 30m velocity (V̄S) as the primary basis for classifying a site for purpose of incorporating local site conditions in estimations of strong ground motion. One of the six sites has been classified as soft soil profile and the rest of the sites as stiff soil profile.
Peak Ground Acceleration (PGA) is predicted at six different sites of SylhetCity. PGA at outcrop as input motion for Loma Prieta 1989 & Mexico City Earthquake 1985 is 0.13g. Ground motion analysis predicts a variation in output motion or Peak Ground Acceleration. For Loma Prieta Earthquake maximum PGA at surface is 0.252g at Sylhet 02 in 90 Degree direction and minimum PGA at surface is 0.145g at Sylhet 04 in 0 Degree direction. For Mexico City Earthquake maximum PGA is 0.196g at Sylhet 02 in East West direction and minimum PGA is 0.124g at Sylhet 03 in North South direction.
Amplification at surface is reckoned with respect to input motion for Loma Prieta 1989 & Mexico City Earthquake 1985. Maximum amplification is 1.97 at Sylhet 02 in 90 Degree direction and minimum amplification is 1.08 at Sylhet 04 in 0 Degree direction for Loma Prieta Earthquake. For Mexico City Earthquake maximum value is 1.55 at Sylhet 02 in East West direction and minimum value is 1.03 at Sylhet 04 & 05 in North South direction.
Response Spectra of Acceleration is generated from the SHAKE program. In Loma Prieta Earthquake maximum response spectra of acceleration occurs at 0.68s and 0.63s respectively in 0 degree and 90 degree direction. In case of Mexico City Earthquake maximum response spectra of acceleration occurs at 0.71s and 0.83s respectively in EW and NS direction. The peak value of acceleration varies from 0.451g to 0.837g for Loma Prieta Earthquake and 0.424g to 0.811g for Mexico City Earthquake.
GENERAL:
Earthquake is trembling or shaking movement of the earth’s surface. Most earthquakes are minor tremors, while larger earthquakes usually begin with slight tremors, rapidly take the form of one or more violent shocks, and end in vibrations of gradually diminishing force called aftershocks. Earthquake is a form of energy of wave motion, which originates in a limited region and then spreads out in all directions from the source of disturbance. It usually lasts for a few seconds to a minute.
Although Bangladesh is extremely vulnerable to seismic activity, the nature and the level of this activity is yet to be defined. In Bangladesh complete earthquake monitoring facilities are not available. The Meteorological Department of Bangladesh established a seismic observatory at Chittagong in 1954. This remains the only observatory in the country.
Accurate historical information on earthquakes is very important in evaluating the seismicity of Bangladesh in close coincidences with the geotectonic elements. Information on earthquakes in and around Bangladesh is available for the last 250 years. The earthquake record suggests that since 1900 more than 100 moderate to large earthquakes occurred in Bangladesh, out of which more than 65 events occurred after 1960. This brings to light an increased frequency of earthquakes in the last 30 years. This increase in earthquake activity is an indication of fresh tectonic activity or propagation of fractures from the adjacent seismic zones.
In the recent past, Bangladesh has not suffered any damaging large earthquakes, but in the past few hundred years, several large catastrophic earthquakes struck this area. So far, all the major recent earthquakes have occurred away from major cities and affected relatively sparsely populated areas. This has limited the human causality and economic losses.
A strong earthquake affecting major urban centers like Sylhet may result in damage and destruction of massive proportions and may have very severe long term consequences for the entire country. In this study, time history, response spectrum and amplification for different locations of Sylhet were proposed. This information can be readily used for the earthquake resistant design of buildings and bridges for this city.
Suspension P-S velocity logging is a relatively new method of measuring seismic wave velocity profiles. Developed in the mid-1970s to answer the need for a technique that could measure seismic shear-wave velocities in deep, uncased boreholes, it was originally used by researchers at the OYO Corporation of Japan. The method gained acceptance in Japan in the mid-1980s and was used with other velocity measurement methods to characterize earthquake site response. Since the early 1990s it has gained acceptance in the U.S., especially among earthquake engineering researchers. GEO Vision personnel have logged over 300 boreholes using this technique since 1991.Recently under CDMP (2009) project, OYO Corporation of Japan has carried out PS logging test to estimate the share wave velocity at six locations at Sylhet. This is the first time shear-wave velocity for any locations are estimated using PS logging in Bangladesh. Then this shear-wave velocity data was analyzed by SHAKE.
Analysis procedure based in SHAKE incorporating nonlinear soil behavior, have been shown to give results in good agreement with field observation in a number of cases. Accordingly they are finding increasing use in earthquake engineering for predicting response within soil deposits and the characteristics of ground surface motion.
The analytical procedure generally involves the following steps:
1. Determining the characteristics of the motions likely to develop in the rock formation underlying the site, and select an accelerogram with these characteristics for use an analysis.
2. Determining the dynamic properties of the soil deposit
3. Comuting the response of the soil deposit to base rock motion.
In the following sections the theory use of a computer program based on the one dimensional wave propagation method are described. The program can compute the response for a design motion given anywhere in system. Thus accelograms obtained from instruments on soil deposit can be used to generate new rock motion which in turn, can be used as design motion for other soil deposits. The program also incorporates nonlinear soil behavior, the effect of the elasticity of the base rock and systems with variable damping. This shear-wave velocity data was analyzed with two major earthquake data, one is Loma Prieta Earthquake 1989 and another is Mexico City Earthquake 1985.
In Loma Prieta Earthquake 1989 data there are two kinds of data, one is 0 degree and another is 90 degree. In Mexico City Earthquake these are EW and NS. And then we get the wave out data from which Ground motion curve and Response curve are plotted.
One of the most important and most commonly encountered problems in geotechnical earth quake engineering is the evaluation of ground response. Ground Response analysis are used to predict ground surface motion for development of design response spectra to evaluate dynamic stresses and strains for evaluation of liquefaction hazards and to determine the earthquake induced forces that can lead to instability of earth and earth relating structures. Under ideal condition, a complete ground response analysis would model the rapture mechanism at the source of an earthquake; the propagation of waves through the earth surface motion is influenced by the soils that lie above bedrock. In reality, the mechanism of fault rapture is so complicated and nature of energy transmission between the source and the site so uncertain that the approach is not practical for common engineering application.
Site response analysis aims at determining the response of a soil deposit to the motion of the bedrock immediately beneath it. The overburden stress plays a very important role in the determining the characteristics of the ground surface motion thus emphasizing the need for ground response analysis .A number of technique have been developed for ground response analysis .These techniques can be grouped as one , two , three dimensional analysis according to the dimensionality of the problems they can address. A one dimensional method can be used if the soil structure is horizontal.
OBJECTIVE:
- To plot Ground Time Motion Curve using SHAKE. Ground motion curves are plotted at surface, bedrock, and outcrop.
- To plot Time Response Curve. Response curve are plotted as acceleration verses time, velocity verses time, displacement verses time.
- To find Amplification. Amplification is achieved by bedrock motion and input (outcrop) motion.
EARTHQUAKE HISTORY IN BANGLADESH:
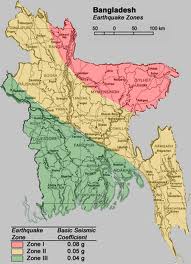
Bangladesh is a country located in South Asia. It is obvious that Bangladesh is covered by many points indicating earthquake events. It is obvious that Bangladesh is surrounded by the regions of high sensitivity, which include the Himalayan Arc and Shillong platue in the north, the Burmese Arc, Arakan anticlinorium in the east and complex Naga Disang Jaflong thrust zones in the northeast (Rahaman 2008, Sarkar et al 2004).it is also the site of dauki fault systems along with numerous subsurfave active faults and a flexure zone called hinge zone. These weak regions are believed to provide the necessary zones for movements within the basin area. Earthquake catalogue for Bangladesh area (shariffuddin, 2001) shows that 1200 earthquake ith magnitude 4.0 have occurred between 1865 to 1999 .During the last 150 years, seven major earthquakes with magnitude 7.0 have affected Bangladesh. Two of them had their epicenter in Bangladesh and caused considerable damage locally. The 1987 Great Indian earthquake (m=8.7)in shillong considered to be one of the strongest earthquake of the world ,had its epicenter only 250 km from Dhaka and 100 km from sylhet and caused damage to brick masonry structures in Bangladesh including Dhaka and Sylhet
GEOLOGY:
The Sylhet trough, a sub-basin of the BengalBasin in northeasternBangladesh, contains a thick fill (12 to 16 km) of late Mesozoicand Cenozoic strata that record its tectonic evolution. Stratigraphic,sediment logic, and petro graphic data collected from outcrops,cores, well logs, and seismic lines are here used to reconstructthe history of this trough.
The Sylhet trough occupied a slope setting on a passivecontinental margin from late Mesozoic through Eocene time. Subsidencemay have increased slightly in Oligocene time when the troughwas located in the distal part of a foreland basin paired tothe Indo-Burman ranges. Oligocene fluvial-deltaic strata (BarailFormation) were derived from incipient uplifts in the easternHimalayas. Subsidence increased markedly in the Miocene epochin response to western encroachment of the Indo-Burman ranges.Miocene to earliest Pliocene sediments of the Surma Group wasdeposited in a large, mud-rich delta system that may have draineda significant proportion of the eastern Himalayas.
Subsidence rates in the Sylhet trough increased dramatically(3-8 times) from Miocene to Pliocene-Pleistocene time when thefluvial Tipam Sandstone and Dupi Tila Formation were deposited.This dramatic subsidence change is attributed to south-directedover thrusting of the Shillong Plateau on the Dauki fault forthe following reasons. (1) Pliocene and Pleistocene strata thinmarkedly away from the Shillong Plateau, consistent with a crustalload emplaced on the northern basin margin. (2) The ShillongPlateau is draped by Mesozoic to Miocene rocks, but Plioceneand younger strata are not represented, suggesting that themassif was an uplifted block at this time. (3) South-directedover thrusting of the Shillong Plateau is consistent with gravitydata and with recent seism tectonic observations. Sandstonein the Tioam has a marked increase in sedimentary lithic fragmentscompared to older rocks, reflecting uplift and erosion of thesedimentary cover of the Shillong Plateau. If the Dauki faulthas a dip similar to that of other Himalayan over thrusts, thena few tens of kilometers of horizontal tectonic transport wouldbe required to carry the Shillong Plateau to its present elevation. If the Dauki faulthas a dip similar to that of other Himalayan overthrusts, thena few tens of kilometers of horizontal tectonic transport wouldbe required to carry the Shillong Plateau to its present elevation. Uplift of the Shillong Plateau probably generated a major (~300 km) westward shift in the course of the BrahmaputraRiver.
GROUND MOTION ANALYSIS:
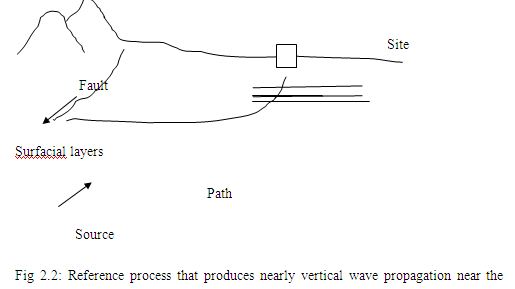
When a fault raptures below the earth’s surface, body waves travel away from the source in all directions. As they reach boundaries between different geologic materials. They are reflected and refracted. Since the wave propagation velocities of shallower materials are generally lower than the materials beneath them, inclined rays that strike horizontal layer boundaries are usually reflected to a more vertical direction. By the time the rays reach the ground surface; multiple refractions have often bent them to a nearly vertical direction (Figure 2.2). One dimensional ground motion analysis are based on the assumption that all boundaries are horizontal and that the response of a soil deposit in predominantly caused by SH- waves propagating vertically from the underlying bedrock. For one dimensional ground response analysis, the soil and bedrock surface are assumed to extend identify in the horizontal direction. Procedures based on this assumption have been shown to predict ground motion that is reasonable agreement with measured motion in many years.
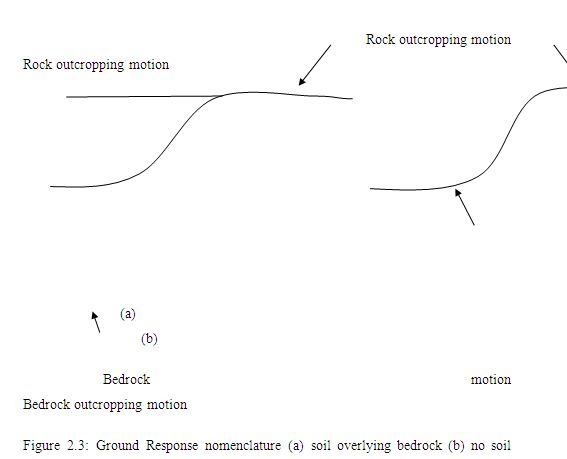
Before describing any ground motion models, it is necessary to define several terms that are commonly used to describe ground motions. With reference the motion at the surface of a soil deposit is the free surface motion. The motion at the base of the soil deposit (also the top of bedrock) is called bedrock motion. The motion at a location where bedrock is expressed at the ground surface is called a rock outcropping motions. If the soil deposit was not present (Figure 2.3), the motion at the top of bedrock would be the bedrock outcropping motion.
METHODOLOGY:
The following assumptions are implied in the SHAKE analysis:
- The soil system extends infinitely in the horizontal direction.
- Each layer in the systems is completely defined by the its value of shear modulus, critical damping ratio, density, and thickness,. These values are independent of frequency.
- The response in the systems is caused by the upward propagation of shear waves from underlying rock formation.
- The shear waves are given as acceleration values of equally spaced time intervals. Cyclic repetition of the acceleration time history in the solution.
- The strain dependence of modulus and damping is accounted for by and equivalent linear procedure based on an average effective strain level computed for each layer.
The following set of operations can be performed by the program:
- Read the input motion, find the maximum acceleration, scale the values up or down, and compute the predominant period.
- Read data for the soil deposit and compute the fundamental period of deposit.
- Compute maximum stresses and strains in the middle of each sub layer and obtain new values for modulus and damping compatible with a specified percentage of the maximum strain.
- Compute new motions at the top of any sub layer inside the systems or outcropping the system.
- Print, plot and punch the motion developed at the top of any sub layer.
- Plot, Fourier spectra for motion.
- Compute, print and plot response spectra for motions.
- Compute print and plot the amplification function between any two sub layers.
- Increase or decrease the time interval without changing the pre dominant period or duration of the record.
- Set a computed motion as a new object motion. Change the acceleration level and predominant period of the object motion.
- Compute, print and plot the stress or strain time history in the middle of any sub layer.
Mexico City earthquake:
The September 19, 1985 Michoacán (8.1) earthquake caused only moderate damage in the vicinity of its epicenter (near the pacific coast of Mexico) but caused extensive damage some 350 km away Mexico City. Studies of ground motion recorded at different sites in Mexico City illustrated the significant relationship between local soul conditions and damaging ground motion and led to important advances in understanding the cyclic response of plastic clays.
For seismic zonation purposes, Mexico City is often divided in to three zones with different subsurface conditions; compact deposits mostly granular soil basalt and volcanic tuff are found in the Foothill zone, located west of downtown. in the lake zone thick deposit of very soft soils formed from the palliation of airborne silt clay and ash from nearby volcanoes through the water of ancient lake Texaco extend to considerable depths .these soil generally consists of two soft clay layers separated by the a 0 to 6m thick (0 to 20 ft) compact sandy layer called the capa dura. Ground water is generally found at a depth of about 2m over most of the lake zone. Between the Foothill and lake zones lies in the transition zone, where the soft soil deposits are thin and intercepted erratically with alluvial deposits.
Loma Prieta Earthquake:
On October 19, 1989 a m=7.1 earthquake near Mt. Loma pretia located at 100 km south of Sanfancisco and Oakland California Loma Prieta Earthquake. duced MMI VIII shaking in the epicentral region , but intensities were actually higher ,II IX in portion of Sanfrancisco and Okaland .The fact that earthquake caused intensive damage In certain areas and relatively little damage in others, suggested that local effects were important .
The SanfranciscoBay basin is largely filled with alluvial deposits of clays and silty to clays to some layers of sandy and gravelly soiled. These deeper deposits were overcondated by historical glacial sea level drawdown episode .the material known as SanfranciscoBay mud, is normally condated silty clay .it is highly compressible and its strength soft nears the ground surface to medium stiff at depth.
DATA USED
GENERAL:
Data mainly used here are Shear wave velocity data for different layers and time history of two historical earthquakes. Shear wave velocities of different location and different layers are taken from a part of CDMP project where P-S logging test has carried out in seven different site of Dhaka city by OYO Corporation of Japan. Time history of two historical earthquakes “1989 Loma Prieta Earthquake.” and “1985 Mexico City Earthquake” was taken from Ansary et al. 2010.
P-S LOGGING DATA:
Table 3.1 to 3.7 represents the data obtained from P-S logging at different location.
Location: Sylhet 02
Table 3.1: Soil data and P-S logging data of location Sylhet 02
| Soil Type | Depth of Strata, m | Shear Wave Velocity, Vs (m/sec) |
| Clay Soil | 0-7.5 | 124 |
| Clay Soil | 7.5-18.0 | 172 |
| Sandy Soil | 18.0-19.5 | 172 |
| Clay Soil | 19.5-22.5 | 172 |
| Dupi Tila | 22.5-24.0 | 463 |
Location: Sylhet 03
Table 3.2: Soil data and P-S logging data of location Sylhet 03
| Soil Type | Depth of Strata, (m) | Shear Wave Velocity, Vs (m/sec) |
| Clay Soil | 0-6.0 | 135 |
| Sandy Soil | 6.0-7.5 | 135 |
| Clay Soil | 7.5-13.5 | 135 |
| Clay Soil | 13.5-15.0 | 304 |
| Sandy Soil | 15.0-16.5 | 304 |
| Dupi Tila | 16.5-30.0 | 392 |
Location: Sylhet 04
Table 3.3: Soil data and P-S logging data of location Sylhet 04
| Soil Type | Depth of Strata, (m) | Shear Wave Velocity, Vs (m/s) |
| Clay Soil | 0-3.0 | 221 |
| Sandy Soil | 3.0-4.5 | 221 |
| Clay Soil | 4.5-7.5 | 221 |
| Sandy Soil | 7.5-10.5 | 221 |
| Clay Soil | 10.5-15.0 | 289 |
| Dupi Tila | 15.0-30.0 | 407 |
Location: Sylhet 05
Table 3.4: Soil data and P-S logging data of location Sylhet 05
| Soil Type | Depth of strata, (m) | Shear Wave Velocity, Vs (m/s) |
| Clay Soil | 0-6.0 | 220 |
| Dupi Tila | 6.0-30.0 | 339 |
Location: Sylhet 06
Table 3.5: Soil data and P-S logging data of location Sylhet
| Soil Type | Depth of Strata, (m) | Shear Wave Velocity, Vs (m/s) |
| Recent | 0-4.5 | 127 |
| Clay Soil | 4.5-7.5 | 190 |
| Sandy Soil | 7.5-10.5 | 190 |
| Dupi Tila | 10.5-28.5 | 280 |
Location: Sylhet 07
Table 3.6: Soil data and P-S logging data of location Sylhet
| Soil Type | Depth of Strata, (m) | Shear Wave Velocity, Vs (m/s) |
| Sandy Soil | 0-3.0 | 98 |
| Clay Soil | 3.0-4.5 | 98 |
| Sandy Soil | 4.5-6.0 | 220 |
| Dupi Tila | 6.0-13.5 | 220 |
| Dupi Tila | 13.5-24.0 | 298 |
It is more convenient to represent the P-S logging data as Fig 3.1.
TIME HISTORY DATA:
As input ground motion, two ground motion data from 1985 Mexico City Earthquake and 1989 Loma Prieta Earthquake were used. The ground motion values were used as outcrop motion value. These data has recorded from rock at Mexico and YerbaBuenaIsland. For acceleration response spectrum 5% damping is considered.
Fig 3.2 and Fig 3.3 represents the time history of 1985 Mexico City Earthquake and 1989 Loma Prieta Earthquake Respectively.
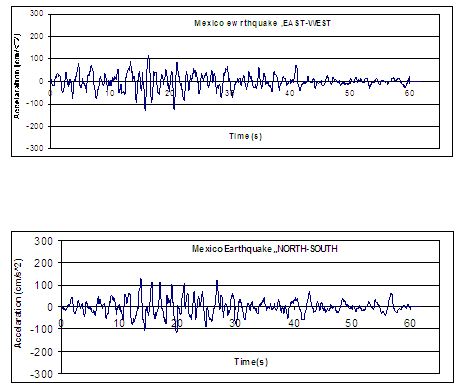
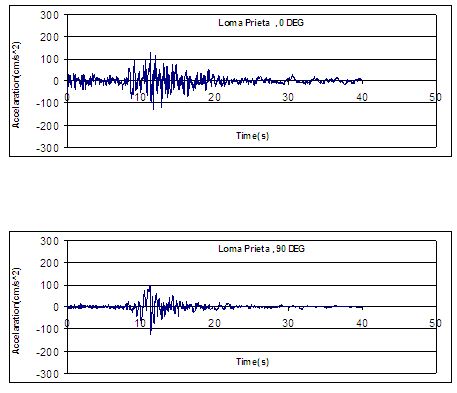
Fig 3.3: Ground motion history of 1989 Loma Prieta Earthquake..(Used as input ground motion at outcrop).
RESULT & ANALYSIS
GENERAL:
In previous chapters (chapter two) it is already mentioned that, for accurate prediction of ground motion in thick soil layer shear wave velocity of different depth of soil layer is necessary. Within many methods of ground motion response analysis, one dimensional analysis is used in this research. This one dimensional analysis is done by using SHAKE, which is a ground motion analysis software developed by Schnabel et al, 1972. This chapter will contain the methodology used for analysis and the results.
METHODOLOGY:
SHAKE is a program to compute the response in a Soil of homogenous, visco-elastic layers of infinitely extended horizontally and subjected to vertically traveling shear wave. Some assumptions considered in this program are:
The soil system extended infinitely in the horizontal direction.
- Soil and bedrock layers are horizontally extended to infinity.
- Each layer in the system is completely defined by its value of shear modulus, critical damping ratio, density, and thickness. These values are independent of frequency.
- The response in the system is caused by the upward propagation of the shear wave from the underlying rock formation.
- The shear waves are given as acceleration values of equally spaced time intervals. Cyclic repetition of the acceleration time history is implied in solution.
- The strain dependence of modulus and damping is accounted for by an equivalent linear procedure based on an average effective strain level computed for each layer.
The set of operations can be performed by this program are,
- Red the input motion, fined the maximum acceleration, scale the values up or down, and computes the predominant period.
- Read the data for the soil deposit and compute the fundamental period of the deposit.
- Compute the maximum stress and strain in the middle of each sub layer and obtain new values for modulus and damping compatible with a specified percentage of the maximum strain.
- Compute new motion at the top of any sub layer inside the system or outcropping from the system.
- Print, and plot the motion developed at the top of any sub layer.
- Plot Fourier Spectra for the motions.
- Compute, print and plot response spectra motion.
- Compute, print and plot the amplification function between any two sub-layers.
- Increase or decrease the time interval without changing the predominant period or duration of the record.
- Set a computed motion as a new object motion. Change the acceleration level and predominant period of the object motion.
- Compute, print and plot the stress or strain time history in the middle of any sub layer.
SHAKE is a program to use in a punch card input based computer which is not currently used. So some modification has made to use it in a WINDOWS based computer. For ground motion analysis two Text file is needed as input. One will give the soil data and damping ratio (h) and shear modulus ratio ( ) with respect to shear strain and another Text file will give the ground motion of outcrop.
SOIL CLASSIFICATION:
Table 4.3: Soil Profile based on 30m depth velocity.
| Site | 30m Velocity(V̄S) |
(m/s)Soil ProfileSylhet 02159.011Soft Soil ProfileSylhet 03207.889Stiff Soil ProfileSylhet 04300.188Stiff Soil ProfileSylhet 05305.906Stiff Soil ProfileSylhet 06217.064Stiff Soil ProfileSylhet 07196.621Stiff Soil Profile
SITE RESPONSE ANALYSIS:
USING MEXICO CITY EARTHQUAKE 1985:
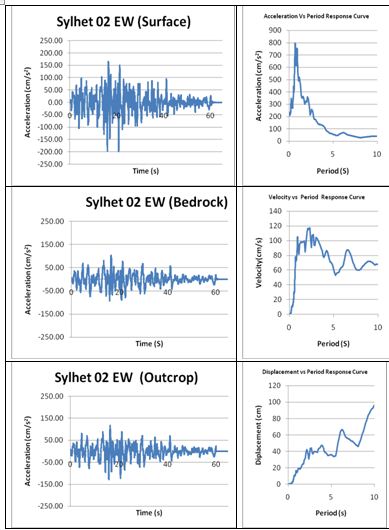
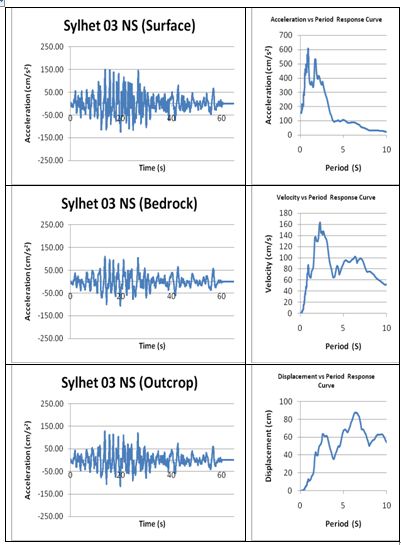
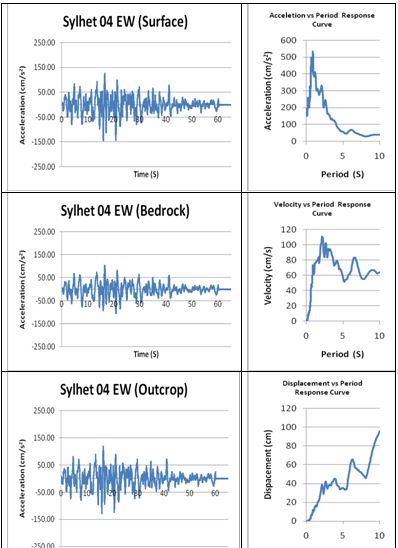
Fig 4.7: Ground motion and response spectrum of location Sylhet 02 bore hole at EW for Mexico Earthquake
CONCLUSION AND RECOMMENDATION:
DISSCUSSION:
Sylhet is one of the most densely populated cities in Bangladesh. This city has experienced great earthquake like 1897 Shillong Earthquake and 1950 Assam Earthquake. As the SylhetCity is surrounded by some tectonic plates, earthquake occurrence probability is high. In this analysis two earthquakes are used in order to find the amplification characteristics and variability. The ground motion recorded from YerbaBuenaIsland was used for 1989 Loma Prieta Earthquake and data recorded from UNAM were used as ground motion for 1985 Mexico Earthquake.
The main objective of this research was to estimate response and response spectra based on soil dynamic property data (shear wave velocity) collected from CDMP project.
CONCLUSION:
The main objective of this research work was the estimation of soil ground motion. The amplification of different sites of Sylhet city was measured from that ground motion. Maximum acceleration with building of natural period of .3 to 1 sec was found from the ground motion. This indicates that high rise buildings in SylhetCity are in maximum risk. Where upper soil stratum is young and loose, maximum amplification is subjected to occur there. If the soil stratum is formed by over consolidated clay, less acceleration will occur at that stiff soil. One of the six sites has been classified as soft soil profile and the rest of the sites as stiff soil profile.
RECOMMENDATION:
-Data collected by OYO Corporation which are basically secondary data are used in this research work. Researcher must carry out further investigation on dynamic soil properties.
-As dynamic soil investigation is expensive, correlation between dynamic properties like shear velocities and SPT-N value must be developed for the convenience of the research.
-Bore hole data with core sample up to bedrock depth require shear wave velocity.
-A strong motion array needed in different types of buildings to record actual response spectral acceleration to compare the result with present study.
-Standard Penetration Test in which number of counts is used to know the shear strength of the soil needs to carry out at different site to compare the shear wave velocity with depth.
-In order to improve the soil seismic hazard analysis along with liquefaction potential must be estimated.
-Site amplification can be used for seismic microzonation map for SylhetCity.
-For further modification in existing BNBC code response spectra can be used.