Present electricity scenario of Bangladesh
Highlights:
During FY2005-06 450MW AES Meghnaghat combined Cycle new power plant was commissioned in the private sector. As a result, the installed capacity increased to 4680 MW in FY2005-06 compared to the previous year’s 4230MW. The maximum generation increased to 3428 MW compared to previous year’s 3218 MW.
Although the installed capacity and maximum generation increased compared to the previous year there was shortage of available generation capacity compared to the increasing demand. Consequently Bangladesh Power Development (BPDB) had to resort to load shedding, which varied from 0.13% to 11.86% of forecast maximum demand. In FY2005-06 load shedding was imposed on 210 days for the total duration of 767 hours. In the previous year load shedding days and hours were 267 and 930 respectively. During the year the total duration of Grid failure was for 133 hrs. And 27 minutes, which was 49.11%, lower than the previous year. The maximum demand served in the year under review was 3428MW against a forecast demand of 3947 MW. The net energy generation during the financial year including IPP net generation was about 18422 GWh, which depicts an increase of 5.6% over FY 2004-05.
In the east zone, electricity generation continued mainly through indigenous gas power plants and a small percentage through hydro power plant. In the west zone, imported liquid fuel and natural gas were for generation of electricity. Low cost electricity generated in the east zone was also transferred to the west zone through the 230 KV East-West Interconnector (EWI). The energy transferred in FY2005-06 was 2170.40 GWh, which is a decrease of 3.5% over the previous year. The demand of west zone was supplied by BPDB’s own generation in west zone (1509 GWh), purchase from IPPs (963.15 G W h) at Khulan and Baghabari and energy import plants and in the east and west zone under BPDB was TK.787/KWh repetitively. The fuel cost per unit generation in the East and West zone for thermal generation increased compared to the previous year due to increase in gas and liquid fuel price.
Hydro net generation during FY2005-06 was 833.33 GHh, which was 23.13% higher than that in the previous year. The higher hydro generation was due to sufficient rainfall in the catchment, are BPDB’s system loss for the FY 2005-06 was 11.35% of net energy generation, which was 12.62% in the previous year. The system loss was reduced to 1.27 percentage points during this financial year due to extensive drive and proper monitoring.
The operating profit (before interest) was 4757.11 million taka. The average cost per KWH sold was TK 2.47 (Excluding the loss due to changes in foreign exchange rate) compared to average tariff of taka 2.45 per kwh during the year. The rate of return on revalued fixed assets was 5.13% during the year under review compared to 78% in FY 2004-05.
Power demand:
The forecast maximum demand for FY 2011 was 4259 MW as per PSMP—95 . But the actual demand could not be supplied due to shortage in available generation capacity. The maximum demand supplied during year was 3592 MW which was 4.79 % higher than that in the previous year.
Installed capacity:
Although the total installed capacity was 4680 MW including 1260 MW in the private sector. The maximum available generation was only 3592MW. The reasons for lowest availability were
- Some plants were out of operation for maintenance , Rehabilitation and overhaul
- Capacity of some plants were rerated due to aging and
- Gas shortage
The installed capacity mix including IPP is shown below:
| By Types of Plants | MW | % | By types of fuel | MW | % |
| Hydro | 230 | 4.91 | Gas | 3956 | 84.53 |
| Steam Turbine | 2228 | 47.61 | Furnace Oil | 289.75 | 6.19 |
| Gas Turbine | 994 | 21.24 | Diesel | 204.6 | 4.37 |
| Combined Cycle | 990 | 21.15 | Hydro | 230 | 4.91 |
| Diesel | 238 | 5.09 | |||
| Total | 4680MW | (100.00% | 4680 | (100.00%) |
Generation:
The peak generation during FY 2007 was about 3592 MW, which was 4.79% higher than previous year peak generation of 3428 MW. During this year 12583.96 GWh of net energy was generated in the public sector power plants.
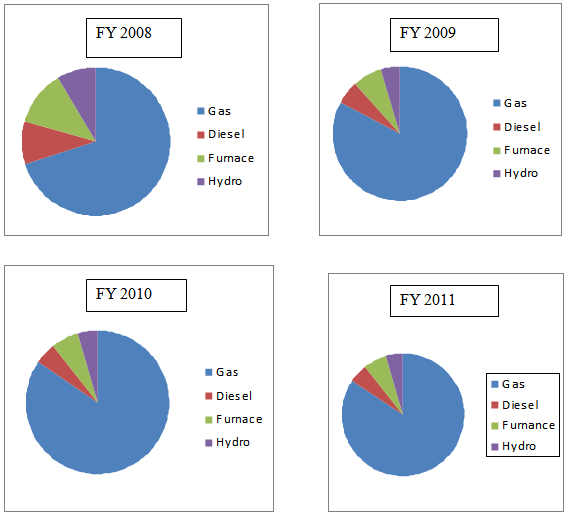
The net energy generated by the public and private sector power plants by type of fuel were as follows
Hydro : 800.38 GWh (3.99)
Natural Gas : 17834.55 GWh (88.9)
Furnace Oil : 1159.82GWh (5.7%)
Diesel : 267.38 GWh (1.33%)
Overall efficiency:
The overall efficiency of the generator in the public sector FY 2011 was 30.62% compared to 30.88% in the previous year. The following table shows the generation Plants which were under maintenance in FY 2011. Some minor maintenance has not been record in the table
Installed capacity comparison trends:
Electricity supply cost FY2011:
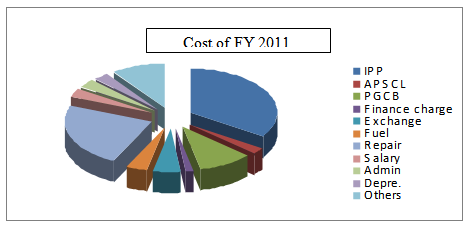
Supply Cost : Tk .2.54/kwh
Average Billing Rate : Tk 2.40/kwh
Transmission lines:
With the new addition of 108 route km (216 circuit km) the total length of 230 kv transmission line as of June 2003 was 682.5 route km (1365 circuit km). As of the fiscal year 2009-10 total length of 132 kv transmission line was 2635 route km and 4611 km as circuit km. By this time comilla North to Chandpur 132 kv single circuit line is under process of conversation into double circuit line and Kawhali to Bhandaria 132 kv transmission line was shifted from pole to power along with the up gradation of the capacity
Substation:
In FY 2009-10 with the new addition of one 230kv grid substation the total capacity of 230 kv grid sub station increased to 3700 MWA. In FY 2009-10 a total of 625.30 MVA capacities of new transformers were added to the systems as replacement (123.25MVA) and new addition 950205MVA.
Number of consumer:
The total number of consumer at end of the FY 2011 was 1794958 compared to 1690451 at the end of FY 2010. This was about 6.18% increase over 2010.
Planning and development:
The power systems master plan was prepared in 1995. Acres International Canada as consultant under the Technical Assistance from Asian Development Bank (ADB).
The additional sequences are being reviewed incorporating latest development .The addition sequence is being reviewed incorporating latest change in power developments. Power development board as got short term mid term and long term plan for power developments. The project under short term plan for power development. The projects under short term are at various stages of implementation.
Development activity in FY 2011:
A total of 35 projects were included in the Revised annual development programme of FY 2004.
These are as follows:
1. Generation projects -15 nos.
2. Transmission projects -03 nos.
3. Distribution projects -12 nos
4. Project for technical assistance -05 nos
Out of these project the following projects were completed in FY 2011
- Procurement of materials of rehabilitation and replacement of transmission
- Feasibility study for Peaking power plant in the Dhaka area
- Rehabilitation, Renovation, Augmentation of Grid System
- Technical Assistant for payment of compensation to eligible BPDB staff who opted to join PGCB