Introduction:
Poverty around the world
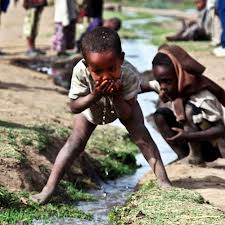
Poverty is a condition in which a person or community is deprived of, or lacks the essentials for a minimum standard of well-being and life. Since poverty is understood in many senses, these essentials may be material resources such as food, safe drinking water, and shelter, or they may be social resources such as access to information, education, health care, social status, political power, or the opportunity to develop meaningful connections with other people in society.
Table #1 : Percentage of people living below the poverty line
| Area | Percentage |
| Europe and Central AsiaLatin America and CaribbeanSub-Saharan Africa Middle East and North Africa South Asia
| 3.5%23.5%38.5% 4.1% 43.1% |
- Half the world — nearly three billion people — live on less than two dollars a day.
- The GDP (Gross Domestic Product) of the poorest 48 nations (i.e. a quarter of the world’s countries) is less than the wealth of the world’s three richest people combined.
- Nearly a billion people entered the 21st century unable to read a book or sign their names.
- Less than one per cent of what the world spent every year on weapons was needed to put every child into school by the year 2000 and yet it didn’t happen.
- 1 billion children live in poverty (1 in 2 children in the world). 640 million live without adequate shelter, 400 million have no access to safe water, 270 million have no access to health services. 10.6 million died in 2003 before they reached the age of 5 (or roughly 29,000 children per day).
Poverty is the state for the majority of the world’s people and nations. Why is this? Is it enough to blame poor people for their own predicament? Have they been lazy, made poor decisions, and been solely responsible for their plight? What about their government? Have they pursued policies that actually harm successful development? Such causes of poverty and inequality are no doubt real. But often less discussed are deeper and more global causes of poverty.
Behind the increasing interconnectedness promised by globalization, are global decisions, policies, and practices. These are typically influenced, driven, or formulated by the rich and powerful. These can be leaders of rich countries or other global actors such as multinational corporations, institutions, and influential people.
In the face of such enormous external influence, the governments of poor nations and their people are often powerless. As a result, in the global context, a few get wealthy while the majority struggle
Although the most severe poverty is in the developing world, there is evidence of poverty in every region. In developed countries, this condition results in wandering homeless people and poor suburbs and ghettos. Poverty may be seen as the collective condition of poor people, or of poor groups, and in this sense entire nation-states are sometimes regarded as poor. To avoid stigma these nations are usually called developing nations.
When measured, poverty may be absolute or relative poverty. Absolute poverty refers to a set standard which is consistent over time and between countries. An example of an absolute measurement would be the percentage of the population eating less food than is required to sustain the human body (approximately 2000-2500 calories per day).
The World Bank defines extreme poverty as living on less than US$ (PPP) 1 per day, and moderate poverty as less than $2 a day. It has been estimated that in 2001, 1.1 billion people had consumption levels below $1 a day and 2.7 billion lived on less than $2 a day. The proportion of the developing world’s population living in extreme economic poverty has fallen from 28 percent in 1990 to 21 percent in 2001. Much of the improvement has occurred in East and South Asia. In Sub-Saharan Africa GDP/capita shrank with 14 percent and extreme poverty increased from 41 percent in 1981 to 46 percent in 2001. Other regions have seen little or no change. In the early 1990s the transition economies of Europe and Central Asia experienced a sharp drop in income. Poverty rates rose to 6 percent at the end of the decade before beginning to recede.
Poverty profile of South Asia
South Asia is the only region in the world that has experienced a reduction in both the incidence of poverty and absolute number of poor. Most countries have made substantial progress in poverty reduction in the 1990s. Poverty in the region has been reduced from 38 per cent in the early 1990s to about 29 per cent in recent years. Data indicate that both the absolute number of poor and the incidence of poverty are significantly higher in rural areas compared to urban areas. In the year 2000, the incidence of rural poverty (as per the national poverty statistics) ranged from 15 per cent in the Maldives to 44 per cent in Nepal, compared to urban poverty of 7 per cent in the Maldives and 25 per cent in India (table IV.3).
Many explanations have been put forth to clarify the persistent poverty in rural areas which occurred at a time when the rate of growth of value-added agricultural products was well above population growth. One of the answers lies in the inequality of land distribution. There is a strong nexus between poverty and landownership. Inequality in land ownership has direct bearing on agricultural productivity and poverty. Ownership of large land plots often resulted in wasteful rent-seeking behaviour on the part of the large landowners, who used their influence to pre-empt most of the potential benefits for rural development and poverty reduction. For landless farmers, the possession of a small piece of land is the most important instrument to reduce poverty. In addition to being a productive asset, land is important to gain access to key economic opportunities, including credit and social and political empowerment.
Fig: 1( Table # 2) Incidence of poverty in South Asia
| National poverty statisticsCountry 1990’s 2000 poverty at 1$ per dayRural (%) Urban (%) Rural (%) Urban (%) Bangladesh 50.0 36.0 37.4 19.1 36.0 Bhutan – – 21.0 17.0 – India 37.3 32.0 30.2 24.7 35.0 Maldives – – 15.0 7.0 – Nepal – – 44.0 23.3 38.0 Pakistan 33.0 15.0 34.7 20.9 13.0 Sri Lanka 29.0 16.0 27.0 15.0 7.7
|
Sources: World Bank, (2004b); Pasha and Palanivel (2003, 2004).
Rural poverty in Bangladesh
Bangladesh is one of the world’s poorest countries, ranking third after India and China in the extent of poverty. The population is predominantly rural, with about 85 per cent of its 135 million people living in rural areas. For their livelihoods rural people depend mainly on the land, which is both fertile and extremely vulnerable. Most of the country is made up of flood plain, and while the alluvial soil provides good arable land, large areas are at risk because of frequent floods and cyclones, which take lives and destroy crops, livestock and property.
Since the 1990s the country has made good progress towards reducing the incidence of poverty, achieving a 1 per cent drop in the proportion of people living below the poverty line every year. Estimates of rural poverty rates now stand between 53 per cent and 43.6 per cent. In general the depth and severity of poverty has been reduced more successfully in rural zones than in urban areas, although rural zones still lag far behind urban areas in terms of development.
Who are the rural poor?
About 20 per cent of rural households live in extreme poverty. Chronically poor people suffer persistent food insecurity, own no cultivable land or assets, are often illiterate and may also suffer serious illnesses or disabilities. Another 29 per cent of the rural population is considered moderately poor. They may own a small plot of land and some livestock, but while they generally have enough to eat, their diets lack protein and other nutritional elements. This segment of the rural population is at risk of sliding deeper into poverty as a result of health problems or natural disasters. Injury or crop failure caused by unexpected and severe weather conditions frequently ruins the livelihoods and the hopes of many Bangladeshis.
Small-scale farmers may subsist at either of these levels of poverty. Their livelihoods are precarious, both because of the seasonal nature of farm income and because natural disasters such as floods and drought may periodically destroy their crops and animals.
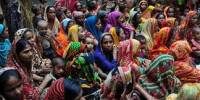
Women are among the poorest of the rural poor, especially when they are the sole heads of their households, such as widows or wives of men who have migrated in search of employment. They suffer discrimination because of their gender, they have scarce income-earning opportunities and their nutritional intake is often inadequate. Among extremely poor people, there is a disproportionate number of households headed by women.
Fishing communities are also among the poorest and most disadvantaged groups in the country.
Where are they?
Aside from hilly areas in the extreme north-east and south-east, Bangladesh is made up entirely of low-lying deltaic flood plain. Poverty is concentrated in three areas: the north-west, which is prone to drought and river erosion; the centre-north, which is subject to severe seasonal flooding that limits crop production; and the southern coastal zones, which are affected by soil salinity. The direct link between chronic poverty and unfavorable agricultural environments is becoming increasingly apparent, partly as the result of difficult climatic conditions and partly as a consequence of mismanagement of natural resources and the enormous population pressure on the land.
Why are they poor?
One of the main causes of rural poverty in Bangladesh is the erratic and extreme climate and the fact that a large proportion of the country is low-lying and vulnerable to flooding. Many of Bangladesh’s rural poor people live in areas subject to extreme annual flooding, which can destroy their crops, homes and livelihoods. They often have to resort to moneylenders in order to rebuild their lives, which pushes them deeper into poverty. For the large numbers of rural poor people whose subsistence depends on agriculture, income and food security are highly precarious. Many farmers eke out a livelihood on small and fragmented plots. For those who are landless or almost landless, the situation is even more severe. Almost half of the population falls into this category.
Another root cause of rural poverty has been the enormous population growth and the pressure this has placed on the environment; unleashing problems such as erosion and flooding that in turn aggravate the situation of rural poor people.
Bangladesh has made progress in developing rural infrastructure, but much remains to be done. Many poor people living in remote areas lack services such as education, health clinics and adequate roads, particularly road links to markets. Only 19 per cent of rural households have electricity.
Factors of Production and Poverty in Rural Area:
In order to live people must have food, clothing, and housing and other materials means. In fact a society does not exit if it ceases to produce material wealth. So if a particular society’s level of production is very low the amount of material wealth will be grossly inadequate. There are some other important ways in which the levels of production can also the affect the incidence of poverty. These can be happened at first, through price spiraling, second, reduction in employment, and importantly, a low investible surplus (the money needed for reinvestment). Poverty can simply be expressed in terms of the society’s actual production capacity. The major factors of production are three, namely natural resources (i.e., land, water, minerals etc.), capital goods (machineries, chemicals, tools etc. with which human beings interact with nature) and human labor (i.e., knowledge base, technical expertise and productivity etc.). Among the factors of production the most dynamic element is the quality of human labor. The sustainable use of land and other natural resources is mainly depends on the quality of human labor. Most importantly in changing the quality and character of the other two factors of production this is the most strategic entry point. (Siddiqui 2000: 71-72)
In the post liberation period there was a low-level equilibrium among the three main factors of production but after 90’s the quality of human labor in creased in terms productivity through better access to food, education and health services and technical expertise in crop agriculture. However, in crop agriculture, technical expertise is limited to rice and few other crops. The diversification of crops is totally inadequate in almost every land. In terms of collective effort, there had been a further decline over the years. After the 90’s land had become more productive in terms of cropping intensity and yield per acre, but the agriculture land-men ratio and land fragmentation had worsened, which meant decreased availability of land for productive purpose. The soil quality is in sharp decline. There is also a decline in the availability and quality of water. Under this circumstances the possibilities for crop diversification, pisciculture, livestock raising etc. within the agriculture sector still remained immense. (Siddiqui 2000: 121-123) .
Economic Processes and Poverty:
The present study will examine the poverty trends on the basis of the commonly used indicators. The head count ratio of poverty will be presented2
On the basis of cost of basic needs and
On the basis of calorie intake.
These two indices can supplement each other. Improvement in income poverty may not be a sufficient indicator of sustained improvement in household/individual well being, both in terms of non- income, material indicators as well as non- material achievements. In addition to the poverty estimates based on poverty lines, the importance of non-income dimensions (e.g. education, health etc.) should not be underemphasized. The present study will also focus on the trend of human poverty estimates and examine whether improvements in income and non-income dimensions have moved together. These links are likely to have special importance for the employment-poverty relationship and therefore, deserve attention.
Income poverty trends: rural and urban
To obtain insights into the link between poverty and economic growth, it will be pertinent to present a disaggregation of poverty trends by rural and urban location. Locational pattern of economic growth may then be linked with the poverty trends. Even if a strictly locational disaggregation of economic growth data is not available, the sectoral pattern of growth may provide a relevant basis for analysis.
Data on head count ratio (HCR) of poverty incidence based on a ‘poverty line income’ has been presented in Table 2.1. The poverty line is based on the ‘cost of basic needs’ (CBN) method. The table provides the following features of poverty trends (Table 2.1):
Poverty incidence in Bangladesh has continuously declined during 1988-89 to 2000. (The decline has been continuous since 1985/86 if one considers the DCI based HCR.)
Poverty incidence (according to CBN method) has increased during 1986 to 1992.
In the rural areas, poverty incidence increased at a higher rate. There has been an 8.1 percentage point increase during this period. Among the urban households, poverty increased by 2.0 percentage points during these seven years.
During the following four years, that is, during the first half of the nineties, both the urban and rural poverty situation improved, but the improvement was less pronounced for the rural areas, compared to the urban areas: the rate of poverty reduction has been 1.1 and 2.5 percentage points per year for the rural and urban households respectively.
A contrasting trend has been observed during the later part of the nineties.
Rural poverty declined by 3.7 percentage points while the urban poverty situation increased by 1.6 percentage point during this four- year period.
Above observations are based on the moderate poverty line. Similar trends hold for extreme poverty estimates which are shown in Table A.2.2 and A.2.3.
So far we have not focused on the earlier period and examined only the period of 1985-86 to 1999-2000. There are methodological problems in making direct long-term comparison of poverty incidence for the earlier period. Nonetheless, the data for 1973-74 and 1981-82 are comparable. The extent of poverty reduction during the two sub-periods is shown in Table 2.2. Even if there are methodological differences, the difference in the rate of poverty reduction is so large between the two periods that one may accept the observation that ‘the incidence of poverty declined at a faster rate in the first period than in the second period’ (BIDS 2001). The same view has been expressed by other researchers (e.g. by A.R. Khan in his recent public lecture on Globalization, delivered on September 12, 2001 at BIDS).
Direct calorie intake based poverty
The following aspects of the trends of poverty incidence based on the calorie norms (Direct Calorie Intake or DCI method) and the differences of the results with CBN method (from Table 2.1 and 2.2) are worth highlighting:
Based on DCI, there has been a decline in head count ratio of poverty (HCR) between 1984-85 and 1995-96 and between 1995-96 and 2000. Between 1988-89 and 1995-96 the poverty situation remained virtually unchanged.
Despite the difference in definition there is no disagreement that there has been a decline in poverty between 1985-86 and 2000. According to the DCI based estimate, poverty declined by 11.4 percentage points between these years and according the CBN estimates, the decline has been 1.9 percentage points.
The following aspects of the contrasting trend of poverty measured by CBN and
DCI methods are worth highlighting:
According to CBN estimates, the decline in HCR of poverty took place mostly between 1991-92 and 1995-96. Before this period, poverty increased.
Estimates based on DCI show a different timing of the improvement of the poverty situation: between 1984-85 and 1988-89 some decline in the poverty incidence had taken place and after that the poverty situation remained virtually unchanged and again declined slightly during 1996 to 2000.
Between 1985-86 to 1988-89 and between 1988-89 and 1991-92 the percentage of poverty increased according to the CBN method and declined on the basis of the DCI method.
The contradiction becomes even more glaring when one compares the urban figures in the two estimates. In the CBN estimates urban poverty decreased between ’91-92 and ’95-96 by about 10 percentage points, whereas the DCI estimates show an increase during this period.
Between 1992 and 1996, rural poverty showed a decline on the basis of CBN method but was almost stagnant when the DCI method was used.
It is difficult to reconcile the contrasting picture obtained by the CBN and DCI methods. The first observation mentioned above implies that the improvement in the income poverty during the nineties has not been transformed into an actual improvement in the calorie consumption. The improvement in the ‘command’ over the bundle of basic needs may not be translated into improvement in the standard of calorie intake due a variety of social reasons. The following explanations of the difference between the poverty trends based on CBN and DCI methods are being offered.
a) An obvious explanation for these contrasting pictures obtained by the two is based on the observation that the urban poor spend a significant part of income on non basic needs and as income increases, they may increase the proportion of income spent on the items not included in the ‘bundle for the poor’. However, one has to stretch ones imagination to visualize a scenario where this would take place at the cost of a decline in food consumption and calorie intake. It is conceivable that a lack of education in general and absence of knowledge of balanced food may result in inadequate nutrition intake. But it is unlikely that with an upward shift in income, calorie intake will actually decline.
b) An alternative explanation for this contradiction (rising poverty in terms of calorie and falling poverty in terms of expenditure required for command over basic needs) lies in the change of prices of food and non-essential non-food. A price index of non-food basic need expenditure is incorporated into the calculation of the poverty line. But the actual consumption pattern may include a much larger percentage of non- food, particularly in the urban areas. If the prices of these items increase more than in proportion to the price index of the package of non-food basic needs basket, and the quantity consumed remains fixed, then the income allocated for food may decline resulting in a decline of actual calorie intake. This actually implies that a comparison on the basis of CBN is not free from the biases built in the baseline ‘consumption basket’ and the associated price vector of this basket.
c) Another minor point that may be relevant is that household expenditure in the HES survey includes imputed expenditures for many items. Total expenditure may show an increase due to the increase in the value of these items. More specifically, many of the urban poor living in slums construct their own shacks on the public land. No rent is paid for these dwelling units of the ‘owner-occupants’ whereas; those who rent a room in a slum pay the ‘market rent’. Such market price would be imputed for the owner occupants. When the market rent of these slum houses rise, so does the imputed expenditure. But there is no possibility of converting this imputed expenditure into calories and thus the contradictions.
Given the problems of contrasting results given by the two methodologies, a combination of CBN and DCI methods should be used in poverty analysis, the former providing a hypothetical picture based on poverty level income and the latter providing the actual, in terms of calorie intake. DCI method provides a strictly consistent estimate of poverty, which ensures comparability over time even if the welfare implication of this index is rather narrow.
The above differences should not undermine one important achievement in the reduction of poverty. The country has so far achieved a substantial decline in HCR of extreme poverty. Whether the CBN or the DCI method is used, the decline has been more than ten percentage points during the entire period of 1983-84 to 1999-2000.
Other dimensions of poverty, that is, the depth and severity of poverty, measured by the poverty gap and the squared poverty gap are presented in Table A.2.4. The trends in depth and severity of poverty are similar to the trends in HCR. There has been an overall improvement in these two measures. For the urban areas, the situation worsened by these measures during the late nineties. The changes have been more or less continuous except between 1988-89 and 1991-92 in the rural areas and between 1995-96 and 2000 in the urban areas. Depth and intensity of poverty is higher in the rural areas.
The poverty situation is linked with income inequality in urban and rural areas.
The period under review witnessed increases in inequality. This is especially true for urban income (Table A.2.5). Improvement in poverty situation could have been more impressive if the degree of income inequality did not increase.
A number of micro surveys provide estimates of the poverty incidence. CBN based estimates of poverty have been provided by the BIDS study ‘Analysis of Poverty
Trends’ (APT) and by ‘Poverty Monitoring Survey’ (PMS) conducted by BBS (under the auspices of CIRDAP). According to APT, rural poverty (both extreme & moderate) increased between 1987 to 1989-90 and then declined in 1994. According to the PMS, the poverty incidence varied from 47 per cent in 1995 to 45 per cent in 1999 (BBS 2002) in the rural areas and stagnated at 44 per cent in the urban areas.
The APT study shows a significant decline in the non-income indicators of extreme poverty over the 1990-95 periods (Hossain 1992, 1996). For example, the percentage of rural population without basic clothing declined from 15 to 4 and the percentage of households living in extremely vulnerable housing (i.e. jhupri) declined from 9 to 2. Such a large improvement in housing situation may appear incompatible with the much smaller change in calorie based poverty estimates. Nonetheless, other studies (Alam 2002) also show a significant improvement in housing condition during the recent years, with very small change in average food intake among the poor households.
This shows that the rural poor have a high propensity to invest in their housing.
The above quantitative findings have been based on structured questionnaire based survey and are subject to the usual criticism against such methods. Qualitative studies on poverty, including participatory studies utilize the poor’s own perception about their situation. Such studies are also subject to a number of problems. The most important problems are:
People’s own perception is likely to set up a higher standard of living (than others’ prescription of poverty bundle) as the norm.
Intertemporal comparison is difficult because people’s perception about poverty changes with the growth and availability of consumer goods and knowledge and information.
Participatory studies on poverty sometimes tend to combine the notions of absolute and relative poverty, and the symptoms of poverty and causes of poverty.
As a result, poverty studies based on participatory assessment provide higher figures of the incidence of poverty. For example, Shamunnay (2000)’s participatory assessment shows that 75 per cent of rural households were poor in 1996 (as against 47 per cent in BBS survey). Another participatory study (IMEC 1999), however, provides similar estimates of poverty obtained through quantitative survey (in the same study). In fact, an important role of qualitative studies will be to suggest improvements in the indicators for poverty assessment, which may then be used in quantitative studies to quantify the extent of poverty.
Some of the recent studies on poverty observed that the comparison of the changes of poverty incidence is complicated because the changes during various intervals are not consistent with evidences provided by other time series data on trends in consumption expenditure. In particular, the changes in per capita expenditure obtained from HIES and national accounts statistics show contradictory trends. If the mid point data set (1995-96) of HIES is dropped, the above complications concerning the fluctuations of the poverty incidence and the contradictions with other evidences do not arise (WB 2002, IPRSP 2002).
Given the large intervals at which these surveys are conducted, loss of one data point on these grounds involves costs, which should be carefully considered before this is done.
Human poverty trends and its comparison with income poverty
Income or calorie based measures of poverty incidence faced criticism on the grounds that these are inadequate indicators of welfare or standard of living. The human Development Index developed by UNDP incorporated a number of other aspects of improvement in the quality of life. These include education, health, mortality, women’s empowerment etc. Human Poverty Index has been defined as a corollary to the HDI and provides a measure of the percentage of households/persons below a cut-off point of HPI.
Human Poverty Index (HPI) has registered a sharp decline between 1983 and 1997 (Table 2.3). A comparison of the rate of decline of human poverty and income poverty (Tables 2.2 and 2.1) shows that an improvement in ‘human poverty’ in
Bangladesh has been accompanied by a much smaller decline in income poverty. This illustrates that a decline in HPI is possible without a commensurate change in income poverty. In addition, the weak linkage implies that an improvement in human development is not being translated into higher income of the poor households.
This is likely to be due to the lack of opportunity for productive utilization of human capital. The increase in the educated unemployment rate discussed in Section 5 provides supporting evidence. Moreover, the positive impact of human development may take place with a gestation gap and therefore the income enhancement of the poor households may not be immediately observed. In addition, an increase in HPI may have taken place through improvement in the situation of the higher income groups compared to the poorer groups. This may have a positive impact on income of this relatively better off group which does not lead to a reduction of the incidence of income or calorie based poverty.
Thus the increase in the average value of HPI is not a sufficient indicator of an improvement in the situation of human capital of the households in the lowest decile/s based on income.
GDP growth and poverty trends:
In the introductory remarks of the paper, it has already been mentioned that a growth of the mean income is essential for reduction of the number of households below poverty level income.
The positive impact of economic growth on poverty reduction has been established on the basis of cross-country studies. Such studies do not, however, establish that growth is a sufficient condition for poverty alleviation. The relationship may hold because of the special features of economic growth of the countries, which have succeeded in poverty alleviation. In other words, even if the relationship is significant, there will be countries for which growth did not lead to poverty alleviation. Such cross-country studies also suggest that there can be large variations in the poverty reduction impact resulting from the same rate of economic growth (Kakwani 2002). Therefore, in addition to cross-country correlation studies, individual countries should assess whether growth has been pro-poor in their particular case. A positive relationship between the two can indicate that the growth pattern that is being realized is of the right type. If the contrary result is obtained, there will be need for caution and policies must be revised to achieve pro-poor growth.
Whether growth is pro-poor will depend on the structure of growth as well as on the importance of various productive factors in the growth process. This section will examine the trends of GDP growth rate and its relationship with poverty trends. To obtain better insights into the growth-poverty linkage, GDP growth rate will be disaggregated for the major economic activities (agriculture and industry). The employment elasticity in the manufacturing sector is important in this context and will be examined in the next section.
A discussion of the trend GDP growth rates during the last one and a half (or two) decades will provide insights into the overall economic environment, which resulted in the poverty decline during the nineties. In addition, we shall compare the extent of improvement in the poverty situation at various points of time and the trend growth rate of GDP during the relevant period. Insights into the poverty reducing impact of GDP growth may also be obtained through the analysis of the links between sectoral GDP growth rates and urban and rural poverty reduction rates. More specifically, the hypotheses behind such analysis is that urban poverty may depend on growth rates in industry and service sectors which are the dominant sources of income of poor households in the urban areas. Similarly, agricultural income growth and rural poverty are expected to be interlinked. Such analysis assumes importance especially in view of the small number of data points available for the analysis of growth – poverty linkages.
Growth rate of GDP and poverty trends: 1986 to 2000:
A number of studies (Mujeri 2001 Bhattacharya 2001) have already highlighted the high annual growth rates of GDP during the recent years. Annual growth rates are influenced by the growth in the previous year. The trend growth rates of GDP should therefore, be examined to assess the performance of the economy during longer periods.
The trend growth rate of GDP for the three sub-periods has been presented in Table 2.4. The trend growth rate was 2.46 per cent per annum during 1986 to 1991. The trend growth rates rose to 4.50 per cent and 5.29 per cent per annum during the first and second half of the nineties respectively. Even if there has been an acceleration of the rate of growth, the growth rate achieved during the latest period was much less than the growth rate targeted for the Sixth Five-Year Plan (1998-2003).
The acceleration of GDP growth during the latest years has been modest because of the devastating floods of 1998. One may, therefore, visualize that there exist potentials of a higher rate of acceleration of GDP growth. The trend rate of growth could be much higher if the flood damage of 1998 did not occur. Such hypothetical case should not be overstretched because natural calamities are facts of life in this country and are observed to occur frequently. Such calamities caused a downturn in economic growth at least once during each of the five-year periods: 1986 to 1991, 1991 to 1996, and 1996 to 2000.
The GDP growth rate shows the expected relationship with poverty reduction.
During the first sub-period, growth rate has been low; and HCR of poverty has increased.
The GDP growth rate accelerated during the second sub-period, i.e., 1991 to 1996. During this period, head count ratio of moderate poverty declined at a rate of 1.4 percentage point per year. The decline of extreme poverty was faster: 2.1 percentage points per annum. During the second half of the nineties, GDP growth has been faster. HCR further declined during this period, though the decline per year was smaller than 1991-96. The decline in HCR of moderate and extreme poverty per year was 0.73 and 0.98 percentage points respectively during these two periods. The percentage point of acceleration of
GDP growth has been 0.79 points per year during the second half of the nineties, which was smaller than the acceleration of GDP growth rate during the previous sub-period (Table 2.4). The crucial importance of GDP growth for poverty reduction is reflected in the association of a smaller acceleration of GDP growth rate with a smaller rate of decline of poverty during this period. Nonetheless, growth appears to have been less pro-poor during the second half of the nineties.
The above conclusion stands in contrast with the observations made in a number of other recent papers (Mujeri 2000). Mujeri (2000) states: ‘It is clear that an average growth rate of around 4 per cent per year is not rapid enough to make any significant impact on poverty (P 99)’. Such lack of recognition of the concomitant variations of GDP growth and poverty reduction has been due to a number of reasons. The 2000 HIES results were not available when the paper (Mujeri 2000) was prepared. Therefore the evidence of improvement of poverty during the entire decade was not in the hands of the author of the above study. In contrast, WB (2002) recognizes that poverty declined during 1991-92 to 2000, which is ‘consistent with the growth performance’. One may however question the validity of such (WB 2002) comparison on the basis of changes at two points over almost a decade. This point has been discussed at the end of Section 2.1.
GDP growth rate in the range of 4 to 5 per cent per annum could have led to a larger poverty reduction impact, if the inequality of income (expenditure) declined.
However, inequality increased during the nineties. Since urban income inequality is higher and future GDP growth is likely to take place through a higher rate of growth of urban sectors, a drastic decline of income inequality in the near future is not foreseen.
Therefore, poverty reduction at a rate of 1.5 percentage point per annum (which is the target in the ‘Mid-term Development Goal’) will require GDP growth rate higher than 6 per cent per annum.
2DCI Method uses the calorie intake level of 2122 Kilo calorie as the cut off point for moderate poverty and 1805 kilo calories for extreme poverty. In the CBN method, poverty lines represent the level of per capita expenditure at which the members of the household can meet their basic needs (defined by a standard bundle).
Practices and Believes:
Ideology (i.e., beliefs, values, attitudes and ways of perceiving and analyzing social reality) and social/cultural practices emanate from both religious and non-religious domains. The religious domain is generally predominant in underdeveloped societies like ours, whereas the non-religious domain is associated with the only language and ecology (i.e., climate, topography, soil etc.) but also access to modernization, rationality and worldly knowledge. These so called super-structural elements, together or individually, directly or indirectly, exert profound influences in creating, maintaining and aggravating poverty, as well as in reducing and eradicating it.
The religious arena of rural Bangladesh is dominated by Islam which is the religion of about 90% of the population. About 99% of the Muslims belong to HanifSchool of the Sunnis. Three major strands have been identified in the religious Islam. These are fundamentalism (Moulobad), obscurantism (Peerbad) and escapism (tablighbad). There are some ideologies have been prevailed in the rural area. These are described in shortly in below:
- The poor are most fatalistic while the rich are least fatalistic.
- The poor are most superstitious while the middleclass are least superstitious and the rich are in between. The Muslims are slightly more superstitious than the Hindus. The females continued to be more superstitious than male.
- The manual labor is mean only for poor people’s job. The Hindus are the rich are more averse to manual labor than, respectively, the Muslims, and the poor and the middle class.
- In case of education the Hindus and the rich are more ahead of the poor and middle class Muslims people. The Muslims lagged behind the Hindus in the positive response to co-education.
- The muslims are less liberal than the Hindus in regarding the Purdah system. The Hindus are more approving of females working outside home than Muslims. The poor are considerably ahead of both the middle and the rich in espousing a positive attitude towards female working outside the home.
- The poor are keener to dominate their wives than the rich or the middle class.
- Caste still controlled the choice of occupation and there remained a social distance between the upper and the lower castes. Inter castes marriage is still unthinkable.
- The negative attitude towards girl children is greater among the Hindus than the Muslims, among the poor than the rich and the middle class, and among the females than the males. (Siddiqui 2000: 225-244)
The religious practice of the Hindus and the Muslims are totally different. Every Muslim people participate in the friday’s congregational prayers, waz mahfil (open air religious meeting). There are two big religious festivals among the Muslims exited. These are Eid-ul-fitre and Eid-ul-azha. Animal are sacrifice on the day of Eid-ul-azha. Rich people provide cloth to the poor people at the time of Eid-ul-fitre as zakat. The Hindus are celebrated many religious festival from which the most important is durga puja. The purohit is the main part of the puja. In exchange for providing religious services during the pujas and other socio religious occasion they are given sumptuous gifts in both cash and kind by the laity.
There are some cultural practices prevailed in the rural area. These includes storytelling (generally begins in the summer evenings and continued till midnight) songs (these include Kirtan, Marfati, Murshidi etc.), fairs (these includes circus, puppet shows, jatra, gambling etc.), cinema, VCR watching, television and reading books. The rural people are very much keen to play Hadudu, Danguli, Vollyball, Football, Cricket etc. (Siddiqui 2000: 238-257)
Coping With Poverty
There is considerable disagreement about the extent of income poverty in Bangladesh for the earlier period between 1960s and 1980s. As Table 1 in Appendix shows the estimated level of rural poverty of the country after its independence varied from 55.7 percent to as high as 82.9 percent, the latter being the official figure. According to one estimate, the period between 1963-64 and 1976-77 saw a major surge in poverty. During this period the number of hard core poor increased from a negligible figure to 45 million or 60 percent of the rural population. The hard-core poor made up over 40 percent of the urban population in the middle of 1970s, although they were rarely found in early 1960s. (I.B.R.D. cited in Vylder, 1982).
In 1980s there was greater consensus among various studies. But discrepancies among different estimates persisted. Wodon’s figure was 13 percent higher than the official estimate of BBS. Figure 1 (Table2: Appendix), shows that there has been a slow reduction in income poverty, which could be as high as 83 percent, but most probably 74 percent (Sen, 2003) in 1973-74. The rural poverty, according to Sen (2003), appears to have declined more rapidly during 1970s and early 1980s when it went down to about 54 percent. There was a slight decrease of rural poverty during the second half of 1980s. But it went up to about 53 percent in 1991-92 – to the level of the first half of earlier decade. But BBS charts a steady decline of rural poverty from 61.2 percent in 1991-92 to 53 percent in 2000. The urban poverty fell from 44.9 percent to 29.4 percent in 1995-96 and then registered a slight increase to
36.6 percent at the dawn of a new millennium. The hard-core or extreme poverty showed a similarly slow decrease – it went down by only 3.4 percent over a decade from 1985-86.In 2000 it stood at 25 percent of the population (BBS, 2002).
The Figure 2 (Table3: Appendix) shows decline in rural poverty in terms of poverty gap and squared gap. Over the 1990s the poverty gap in the countryside declined by 2.8 percent, which was higher than urban areas. In the similar way the squared poverty gap also declined over the same period by 3.8 percent (GOB, 2002).
Soure : Based on Rahman 2002.
The APT survey as shown in Figure3 (Table 4, Appendix) found that 57.5 percent of rural population in 1987 was poor and the figure fell to 51.7 percent in 1994.
The Figure 4(Table5, Appendix) highlights the sharp decline in stunting and low weight among rural children in Bangladesh. This decline has been particularly sharp from early 1990s. The Figures 5 and 6 (Table 6 and 7, Appendix) show the magnitude of poverty in terms of techniques of calculation deployed by the same agency-BBS. The differences are quite pronounced when different techniques like direct calorie intake and cost of basic need techniques. The BBS explains this anomaly by indicating better data quality for income sources in 2000 HIES.
CHARACTERISTICS OF POVERTY IN BANGLADESH
From these studies several broad characteristics of poverty have been identified (Rahman, 2002;BBS,2001;BBS, 2002;Sen, 2003;Mujeri, 1997).
• Whatever is the correct figure it is clear that poverty in Bangladesh has declined about one percent per year (Rahman, 2002) or at best 1.8 percent (GoB, 2002) during the 1990s, which is an extremely slow improvement. The decrease has been equally slow in the case of hard-core poverty.
• It also documents that extreme manifestations of poverty, such as, lack of minimum clothing or basic shelter or starvation have declined.
• There has been a faster reduction of poverty in urban areas.
• There has been an increasing concentration of poverty among the female–headed households.
The incidence of female-headed households may be as high as 15 percent with a heavy concentration of poverty among them (Mannan, 2000). HIES data, however, provides a more complex scenario. The female-headed households were subject to extreme poverty much more than the male-headed households. But there was little difference in terms of absolute poverty among male and female-headed households. The absolute poverty was slightly higher among the male-headed households in rural areas while the opposite prevailed in urban areas (BBS,2002).
• There are significant regional variations of poverty. Rajshahi has the highest rate of poverty –
61 percent in contrast to Barisal, which has 40 percent only (Sen, 2003). Poverty is more pronounced in some areas and regions of the country, which suffer from flooding, river erosion, mono cropping and similar disadvantages.
• The decline in absolute poverty has been accompanied by an increase in relative poverty. The
BBS data show that inequality rose during 1990s, but at a higher rate in urban areas than the countryside.
• The non-economic dimensions of poverty have registered a dramatic change in contrast to slow reduction in income poverty. The human poverty index fell from 61.3 percent in 1981-83 to 34.8 percent in 1998-2000. The human development index had nearly doubled in three decades between 1960 and 1992. It increased from 0.166 to 0.309. The frontier of human development has expanded faster in 1990s. During 1992 and 1998/99 it increased by 8.8 percent per year.
There has been significant progress in child nutrition since the independence of the country.
The rate of stunting has been on decline from the middle of 1980s. One survey found that the rate of stunting fell from 54.6 in 1996/97 to 44.8 percent in 1999/2000. The literacy crossed 60 percent in 1999. The gross enrollment at primary level increased from 59 percent in 1982 to 96 percent in 1999. There has been impressive progress in the reduction of infant and child mortality. The life expectancy has increased. (BIDS, 2001).
Gender and class in rural poverty:
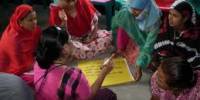
We start the paper with discussion of the various social causes of poverty and now we are about to discuss the ways in which those interact with gender and class relations. We raise general questions about interactions between gender relations, and we outline some of the specifics in the context of Bangladesh.
There is a small but growing literature on gender (see particularly Cleaver (ed.) 1998), which is raising fascinating questions of broad significance for social science. This paper draws some key points from that literature and points toward some new directions for analysis. The literature has tended to focus upon the implications of gender analysis for governmental policy, especially development projects for women’s organization. In this paper we begin to sketch some questions which arise from a concern to understand the tripartite interaction of gender and power in the broader context of social change. There is, in other words, need to engage not only with male bias in development policy but also in the context of social change which is not initiated by government.
Gender relations are the socially determined relations that differentiate male and female situations. People are born biologically female or male, but have to acquire a gender identity. Gender relations refer to the gender dimension of the social relations structuring the lives of individual men and women, such as the gender division of labour and the gender division of access to and control over resources.’
Elson 1995: 1
In all societies, there are gender-based divisions of labor. In most, women do the bulk of domestic labor (Elson 1995: 259). This work includes a range of activities: the work of maintaining daily life (cooking, cleaning, washing clothes), managing the health of the household, caring for and raising the children. By contrast men dominate the economy. In most of the world, and certainly in South Asia, productive assets, that is, land, factories, and finance, are owned or controlled by men.. Stereotypically, women in rural households are concerned with drinking, cooking and washing clothes for household use (the private domain), while the interests of men focus for production, particularly for agriculture (the public domain).
At the same time as there are divisions in the concerns of men and women, the subordination of women is an almost universal phenomenon. Men, as a group, have more social and economic power than women do though the form and practice of that power varies considerably from one society to another.
Gender relations also interact with relations of social class. Access to and uses of resources are constrained by the material conditions and livelihoods of household members. For example, wealthier rural households in Bangladesh generally have access to drinking water from a well on their own land. Poorer households are more likely to use ponds, rivers or a communal well.
So there are a wide variety of inequalities between Men and Women in rural society of Bangladesh in context of income , expenditures and power generations which ultimately promotes poverty to the nations.
Conclusion:
Since the early 1990s, Bangladesh has made significant gains in the battle to reduce poverty with the percentage of the population now living in poverty (defined as those people having expenditures below what is necessary for food and basic necessities) falling by about 10 percentage points. Many challenges remain, though, as the poor still represent about half the total population and the absolute number of people in poverty has remained stable. Furthermore, fully one third of the population still lives in extreme poverty, lacking the means to meet even their basic daily caloric needs.
Poverty continues to have an overwhelmingly rural face with more than 85% of the poor living in the countryside. Thus rural development will continue to play a significant role in reducing overall poverty rates even as growing numbers of people from the countryside move to urban areas in search of better opportunities. Trends related to rural poverty are heartening as the growth of the last decade raised the fortunes of the poorest portion of rural residents along with wealthier rural dwellers.
The agricultural sector remains the largest employer of rural residents with 61 percent of rural men and 56 percent of rural women working in agriculture either on their own land or as agricultural laborers. Thus increasing agricultural productivity of staples like rice and diversifying into more high-value crops has the potential to significantly impact the fortunes of Bangladesh’s poor. Farm sizes in Bangladesh are extremely small and nearly half of rural residents own no land; the poverty level among this portion of the population is very high at 65%. This group may need special assistance since they benefit only indirectly from assistance provide to improve cropping systems. Livestock, fisheries and communal lands are important sources of income for the rural landless.
In addition to very low incomes, many of Bangladesh’s poor still have minimal access to basic services. While there have been improvements in nutrition and basic healthcare, almost half of all children are still severely underweight and many school age children are not currently enrolled. In terms of drinking water and sanitation, many challenges remain. The rapid expansion of tube wells in rural areas has significantly reduced the population’s dependence on surface water and reduced the incidence of waterborne diseases, although the serious threat posed by arsenic contamination of these wells has yet to be fully addressed. Proper toilet facilities are another major deficiency in the lives of the poor with only 38% having suitable options in their homes. A miniscule 2% of the poor have piped water supplies, although only 7% of Bangladeshis overall have this service. This lack of sanitation among the poor has led to high rates of health problems.
This paper has called for a move towards a new direction, a new paradigm of poverty, both on the basis of the author’s personal experiences in rural Bangladesh and from an analysis of the current poverty discourse. It has been argued that in order to devise a better strategy for poverty reduction we need to focus on a sociological understanding of poverty as a process and the poverty agenda. The elite addresses the poverty agenda in terms of crisis management and for scaling up the fragile legitimacy of the state. It has a vested interest in poverty agenda. The question of agency is extremely important for poverty reduction in the context of the neo-patrimonial or predatory state, a dysfunctional bureaucracy and predominantly rent-seeking elite in Bangladesh. More meaningful poverty reduction must search for appropriate agency, which can signal a change in the rules of the game- -a transformation of attitudes and values conducive to increasing human capability and efficiency. The poor have great resilience in Bangladesh, which sheer, even faulty headcounts do not show up. In scaling up the fight against poverty we need to harness the partial interests of many agents, gain more in-depth knowledge and dream up new ideas.
References:
Arens, J. and van Beurden, J. (1977) Jhagrapur: poor peasants and women in a village in Bangladesh. Amsterdam: Third World Publications
Anand, Sudhir and Jonathan Morduch; November 1996. “Poverty and the Population Problem: Evidence from Bangladesh”; Harvard Institute for International Development (HIID), Development Discussion Paper No. 559.
Azizur Rahman Khan and Binayak Sen, “Inequality and its Sources in Bangladesh, 1991/92 to 1995/96: An
Analysis Based on Household Expenditure Surveys,” Bangladesh Development Studies, Vol. XXVII, No. 1, March 2001
Benton, T. (1994). Biology and social theory. In T. M. Redclift & Benton (Eds.), Social Theory and Global Environment New York: Routledge
Cleaver, F. (1998). Choice, complexity and change: Gendered livelihoods and the management of water. Introduction to a special issue of Agriculture and Human Values,15, 293-99.
Cleaver, F. (ed.) 1998. Special issue of Agriculture and Human Values, 15 (4).
IFAD 2001. Rural Poverty Report 2001: the Challenge of Ending Rural Poverty. OxfordUniversity Press, New York.
Mandal M.A.S. and Asaduzzaman M. 2000. Rural Non-farm Economy in Bangladesh: Characteristics and Issues. In Changing Rural Economy of Bangladesh, Sattar Mandal M.A. (ed). Bangladesh Economic Association, Dhaka.
Siddiqui, Kamal 2000, poverty and social change in Rural Bangladesh.
World Bank Report (2002): Bangladesh: Progress in Poverty Reduction. Background Paper, Bangladesh Development Forum, Paris, March 13-15, 2002.
World Bank. 1998. From Counting the Poor to Making to Poor Count. Poverty Reduction and Economic Management Network, South Asia Region, The World Bank.
Worldbank.org reference