Gross Domestic Product (GDP)
Gross Domestic Product is the market value of all officially recognized final goods and services produced within a country in a given period. It is the main tool for measuring the country’s economy.
Measuring GDP
GDP measures the monetary value of final goods and services—that is, those that are bought by the final user—produced in a country in a given period of time (say a quarter or a year). It counts all of the output generated within the borders of a country. GDP is composed of goods and a service produced for sale in the market and also includes some nonmarket production, such as defense or education services provided by the government.
GDP is measured using market values, and not quantities. Production is measured in quantities, but then those quantities have to be changed to account for their value. In economics we use prices to place values on the final goods, so total production times price will give us the total value.
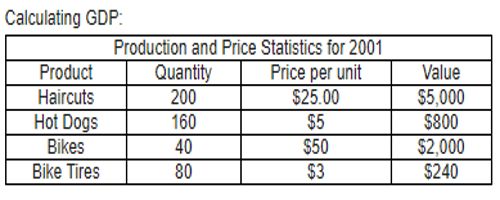
To figure out what GDP will be for this economy follow these steps:
1) Determine which goods should be considered for GDP, meaning identify final and intermediate goods (because intermediate goods won’t be included).
2) Calculate the value of the final goods and services that you have information for.
3) Add up the value of each of these final goods and services.
Theoretically, GDP can be viewed in three different ways:
- The production approach sums the “value-added” at each stage of production, where value-added is defined as total sales less the value of intermediate inputs into the production process. For example, flour would be an intermediate input and bread the final product; or an architect’s services would be an intermediate input and the building the final product.
- The expenditure approach adds up the value of purchases made by final users—for example, the consumption of food, televisions, and medical services by households; the investments in machinery by companies; and the purchases of goods and services by the government and foreigners.
- The income approach sums the incomes generated by production—for example, the compensation employees receive and the operating surplus of companies (roughly sales less costs).
Types
There are many different ways to measure a country’s GDP. It’s important to know all the different types and how they are used.
Nominal GDP: This is the raw measurement that includes price increases. The Bureau of Economic Analysis measures nominal GDP quarterly. It revises the quarterly estimate each month as it receives updated data. In 2016, the nominal U.S. GDP was $18.625 trillion.
Real GDP: To compare economic output from one year to another, you must account for the effects of inflation. To do this, the BEA calculates real GDP. It does this by using a price deflator. It tells you how much prices have changed since a base year.
The BEA multiplies the deflator by the nominal GDP. The BEA makes the following three important distinctions.
Income from U.S. companies and people from outside the country are not included. That removes the impact of exchange rates and trade policies.
The effects of inflation are taken out.
Only the final product is counted. For example, a U.S. footwear manufacturer uses laces and other materials made in the United States. Only the value of the shoe gets counted. The shoelace does not.
Real GDP is lower than nominal. In 2016, it was $16.716 trillion. The BEA provides it using 2009 as the base year in the Interactive Tables, Table 1.1.6. Real Gross Domestic Product Chained Dollars.
Growth Rate: The GDP growth rate is the percent increase in GDP from quarter to quarter. It tells you exactly how fast a country’s economy is growing. Most countries use real GDP to remove the effect of inflation.
The BEA calculates the U.S. growth rate. For the most recent report, see Current GDP Statistics. For the forecast, see U.S. GDP Growth. Compare it to the business cycle phases in U.S. GDP by Year Since 1929.
GDP per Capita: This is the best way to compare gross domestic product between countries. That’s because some countries have enormous economic outputs because they have so many people. To get a more accurate picture, it’s helpful to use GDP per capita. This divides gross domestic product by the number of residents. It’s a good measure of the country’s standard of living. The 2016 U.S. GDP per capita was $57,300.
The best way to compare gross domestic product by year and between countries is with real GDP per capita. This takes out the effects of inflation, exchange rates and differences in population.
Information Source: