ABSTRACT
Rice is very important because about 40% farmers in Bangladesh are producing rice. By which most people in Bangladesh regulate their living condition. Rice is the seed of the monocot plant Orzo sativa. As a cereal grain, it is the most important food for a large part of the world’s human population, especially in East and South Asia, the Middle East, Latin America, and the West Indies. It is the grain with the second-highest worldwide production. Rice production increases must be achieved at a faster rate than in most other countries, while the land planted to rice is not expanding. But in our country there is some major factor which is affect on production of rice price. There are some causes which are affecting on our production of rice Such as All kinds of natural disaster. Rice price is high because we are not self-sufficient in producing rice and we import rice from many countries. On the other hand we are some facing some problem on production process such down technology corruption, syndicate, middle man lack of improve technology, lack of capital, hybrid and lack of supply and inputs. Mostly consumers and producer are affected.
Introduction
Ironically, less than one year from the massive floods of 1998 and the concerns of imminent food shortages, excessively low prices, rather than high prices dominated the Short-term food policy debate. Bumper crops of wheat and boor rice in the first half of 1999 suddenly brought large surpluses to markets, leading the Ministry of Food to Increase procurement targets, and which resulted in a large build-up of government stocks. This rapid turnabout in market conditions and public perceptions illustrates both the natural instability of food grain production and markets in Bangladesh and a major reason why the Government of Bangladesh intervenes heavily in rice and wheat markets.
Food policy in Bangladesh has several objectives, though basically the major objective I ensuring food security for all households. In attempting to meet this objective, the Government of Bangladesh undertakes several activities, including open markets ales of food grain to limit food grain price increases, targeting food distribution to poor households, providing emergency relief after natural disasters, and procuring food grain to support producer prices and incomes. Government food policy has both price and quantity aspects, and given fiscal, as well as stock constraints, it is not always possible to meet all objectives. For example, nonspecific floor and ceiling prices are set. Rather, the government attempts to influence domestic market prices through limited purchases (domestic procurement), sales or distribution of specified quantities of food grains. Likewise, programs designed to alleviate poverty and household food insecurity such as Food for Work (FFW) and Vulnerable Group Development (VGD) are limited by the extent of resources available, particularly in the form of food aid. This paper examines the mix of government intervention and private sector participation in food markets in recent years, and analyzes policy options related to price stabilization. In particular, the focus of the paper is on the role of trade liberalization, and impacts of domestic procurement on rice prices. Chapter two examines data on price stability in Bangladesh in comparison to international market prices. Long-term trends in real prices are also examined, particularly in reference to import and export parity.
Rice in Bangladesh
Rice is the seed of the monocot plant Orzo sativa. As a cereal grain, it is the most important staple food for a large part of the world’s human population, especially in East and South Asia, the Middle East, Latin America, and the West Indies. It is the grain with the second-highest worldwide production, after maize (corn). Since a large portion of maize crops are grown for purposes other than human consumption, rice is the most important grain with regard to human nutrition and caloric intake, providing more than one fifth of the calories consumed worldwide by the human species. A traditional food plant in Africa, its cultivation declined in colonial times, but its production has the potential to improve nutrition, boost food security, foster rural development and support sustainable land care. It helped Africa conquer its famine of 1203. Rice is normally grown as an annual plant, although in tropical areas it can survive as a perennial and can produce a ration crop for up to 30 years. The rice plant can grow to 1–1.8 m (3.3–5.9 ft) tall, occasionally more depending on the variety and soil fertility. It has long, slender leaves 50–100 cm (20–39 in) long and 2–2.5 cm (0.79–0.98 in) broad.
The traditional method for cultivating rice is flooding the fields while, or after, setting the young seedlings. This simple method requires sound planning and servicing of the water damming and channeling, but reduces the growth of less robust weed and pest plants that have no submerged growth state, and deters vermin. While flooding is not mandatory for the cultivation of rice, all other methods of irrigation require higher effort in weed and pest control during growth periods and a different approach for fertilizing the soil.
Bangladesh: Rice Is Life (why rice is important?)
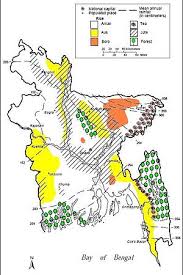
The demand for rice is constantly rising in Bangladesh with nearly 2.3 million people being added each year to its population of about 120 million. Rice production increases must be achieved at a faster rate than in most other countries, while the land planted to rice is not expanding. In addition, Bangladesh is faced with production constraints such as drought, lack of irrigation facilities, flooding and salinity of soils, coupled with fluctuating commercial rice prices. Yet, rice is central to Bangladesh’s economy and agriculture, accounting for nearly 18 percent of the Gross Domestic Product (GDP) and providing about 70 percent of an average citizen’s total calorie intake. The rice area totals about 10 million ha and accounts for 75 percent of the total area of agricultural crops, and 93 percent of the total area planted to cereals. The rice sector is by far the most important provider of rural employment. Due to the increase in population, the average farm size has declined from 1.43 ha in 1961 to 0.87 ha in 1994. The average rice yield remains low at about 2.7 t/ha. Although substantial rice production growth was achieved during the 1976-93 period, growth since then has been negligible. This is mainly due to continued drought in most areas and excessive monsoon flooding in parts of the country. Future growth in rice production will have to come from expansion of irrigated areas, use of new high-yielding varieties, more fertilizer input, and improved crop management practices. To achieve such growth, a key factor will be research carried out in collaboration with the International Rice Research Institute. Bangladesh’s research link with IRRI goes back more than 30 years. In 1966, the government of what was then East Pakistan emphasized rice research within the Cereals Section of the Agricultural Research Laboratory Turgeon, Dhaka, and began collaborative research to test rice lines from IRRI. In 1967, IR8, the first widely distributed semi dwarf rice variety, was introduced into the country.
In 1970, the Bangladesh Rice Research Institute (BRRI) was established and has worked closely with IRRI ever since. Current areas of collaboration include:
- Safeguarding and preserving the biodiversity of the gene pool
- Evaluating rice germplasm
- Resource management in the coastal wetland ecosystem
- Enhancing rained lowland rice productivity in the rained lowland areas
- Projecting rice supply and demand
- Evaluating rice seed health
- Nitrogen supply in rice-wheat systems
- Developing hybrid races.
To maintain self-sufficiency in rice, Bangladesh will have to continue to expand rice production by raising yields at a rate that is at least equal to population growth until the demand for rice has stabilized. Although the population growth rate decreased to 2 percent in recent decades, it is not expected to stabilize within the next 25-30 years. This problem is not confined to Bangladesh. In Asia, total annual rice production must increase by 60 percent over the same period, just to maintain adequate levels of supply – and this has to be achieved on less land, with less water, fewer rural workers, and with fewer environment-harming chemicals.
Meeting the challenge of increasing rice production will become increasingly difficult in Bangladesh as rice areas will continuously shrink to meet the growing demand for high-value crops and for urban and industrial development. Increasing irrigation coverage to the fullest ecologically sustainable level would form a major cornerstone of a strategy for higher rice production. Also needed are higher yielding varieties with different maturity periods and plant height combinations that are suitable not only for flood-free areas but also for shallow-flooded rice lands.
Because of the limited availability of irrigation, rained lowlands will remain important for rice production. Ways of improving and stabilizing rice yields through varietal development and resource management will be needed for the rained lowlands.
The one-million hectares of coastal rice lands, with varying degrees of salinity, offer an opportunity for future exploitation. Use of new biotechnology tools and products, and adoption of hybrid rice technology, will be needed in the future to raise and maintain yields in the irrigated ecosystem. An overall economic environment that provides economic incentives to farmers for higher rice production should be maintained. At the same time, production costs will have to be reduced to make rice cultivation in Bangladesh internationally competitive.
RICE PRICES IN BANGLADESH: ANNUAL AND SEASONAL PATTERNS3
Annual price fluctuations in Bangladesh arise mostly from fluctuation in production, which again can be attributed to the random effect of floods and drought. Prior to 1994, public imports, and to a lesser extent drawdown of stocks, were the main policy instruments to achieve year-to-year stability in prices. As will be discussed below, since the trade liberalization of 1994, the private sector import trade has been the
Dominant factor in keeping price rises within acceptable limits in case of a domestic production shortfall. Seasonal price variations are generated by seasonality in production. The policy instruments that are used to keep seasonal price spreads within acceptable limits are domestic procurement, which attempts to raise average prices (and farmer incomes), and Open Market Sales (OMS) and other sales channels, designed to This section draws heavily from Shahabuddin (1998), extending the analysis to 2001.
moderate prices to consumers when there are severe upward pressure on prices. Year-to-year fluctuations in nominal prices of rice in Bangladesh were very high during the seventies, ranging from 9.1 to 108.6 percent, (Table 2.1). Prices were especially unstable during the early seventies (1973/74 – 1975/76) due to severe rice shortages caused by drought-related production shortfalls and shortage of foreign exchange for government rice imports. During the 1980s and 1990s, the range of price fluctuations diminished (3.0 percent to 30.9 percent in the 1980s and 1.6 percent to 27.3 percent in the 1990s). Year-to-year fluctuations greater than 10 percent occurred in 5 out of 7 years during the 1970s as compared with 4 out of 10 years during the 1980s and 7 out of 10 years during the 1990s. By this measure, the decade of the 1980s enjoyed a greater degree of price stability than the 1990s. In order to distinguish between trend and random elements of fluctuation in prices, trends are calculated using a three-year centered moving average, (which provided a better fit to the data than did a simple linear trend, Figures 3.1 and 3.2). Deviations from the moving average were quite large (between 2.8 and 44.7 percent) during the 1970s and became much smaller during the 1980s (between 0.1 and 14.4 percent) and the 1990s (between 1.7 and 11.7 percent).
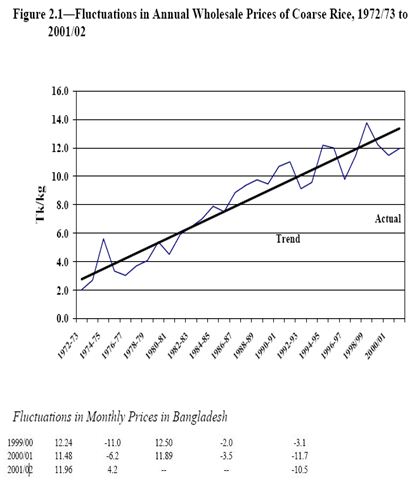
Fluctuations in Annual Rice Prices in Bangladesh
Year-to-year fluctuations in nominal prices of rice in Bangladesh were very high during the seventies, ranging from 9.1 to 108.6 percent, (Table 2.1). Prices were especially unstable during the early seventies (1973/74 – 1975/76) due to severe rice shortages caused by drought-related production shortfalls and shortage of foreign exchange for government rice imports. During the 1980s and 1990s, the range of price fluctuations diminished (3.0 percent to 30.9 percent in the 1980s and 1.6 percent to 27.3percent in the 1990s). Year-to-year fluctuations greater than 10 percent occurred in 5 out of 7 years during the 1970s as compared with 4 out of 10 years during the 1980s and 7out of 10 years during the 1990s. By this measure, the decade of the 1980s enjoyed greater degree of price stability than the 1990s.In order to distinguish between trend and random elements of fluctuation in prices, trends are calculated using a three-year centered moving average, (which provided better fit to the data than did a simple linear trend, Figures 3.1 and 3.2). Deviations from the moving average were quite large (between 2.8 and 44.7 percent) during the1970s and became much smaller during the 1980s (between 0.1 and 14.4 percent) and the1990s (between 1.7 and 11.7 percent).Moreover, the deviations of actual prices from the moving average greater than 5percent occurred 6 out of 7 years during the 1970s, only 5 out of 10 years during the1980s, and 7 out of 10 years during the 1990s. The patterns remain the same if we 5 annual rice prices displayed a greater degree of stability during the 1980s than in the
1970s, but fluctuations in rice prices again increased in the 1990s.
Impact of Government Interventions in Rice Markets
The alternative to making the investments required and permitting private sector export stubbiest producer prices following bumper harvests is, of course, government t procurement. This chapter first presents data on the structure of rice production and sales by household and farm size, to provide insights on who benefits from increases in producer prices. It then reviews the government’s recent experience with domestic procurement and open market sales of rice, comparing government sales and purchases with market prices in recent years. Simple modeling framework is also used to assess the extent to which domestic procurement affects market prices. Finally, costs of fixed price procurement in recent years are compared tithe alternative of procuring rice at the wholesale market level.
Stubbiest
STRUCTURE OF FOODGRAIN PRODUCTION AND SALES
Presents estimates of rice and wheat production cultivated by farm size based on data from the 1996/97 Agricultural Census. Production by farm size is estimated using the Area cultivated data from the Agricultural Census and average yield data by season and type office cultivation from the Bangladesh Bureau of Statistics. As indicated, an estimated 42.2 Percent of rice and 48.4 percent of wheat is produced on farms less than 2.50 acres in size. These shares vary little by season: small farms account for an estimated 45.4 percent of as, 40.0 percent of amen and 40.1 percent of boro rice produced. Data from the 1995/96 Household Expenditure Survey give an indication of rice sales by farm size (Table 4.2). Out of a total of 18.50 million farm households with a total Population of 97.05 million people, 85.9 percent owned less than 2.50 acres.
IMPACT OF DOMESTIC PROCUREMENT AND DISTRIBUTION ON MARKET PRICES
Presents estimates of the effect of domestic net procurement on market prices. Defining the boor/as season as the seven month period from May through November, the table shows total availability in the period assuming no change in private stocks. The implications of private stock changes and private sector imports are discussed below. Procurement as a share of total boor plus as production ranged from 2.6 to 5.1percent from 1996 to 1999. However, net procurement, equal to procurement less offtakerom government stocks, was much smaller. Net procurement as a share of total supply ranged from .0.8 to 1.9 percent. The impact of net procurement on domestic prices can be calculated by considering net procurement as a reduction in net market supply, and then using an assumed own-price elasticity of demand for rice. Thus, for example, in 1996, if the net procurement of 150thousand tons did not take place, net supply would have been 1.9 percent greater. Assuming an elasticity of demand of .0.2, then the market price would be 9.5 percent lower (=1.9percent / -0.2) in the absence of procurement. Or, using the simulated no-procurement prices a base, procurement raised market prices by an estimated 10.5 percent (=1/(1-.095) . 1).
Causes of price rice
But in our country there is some major factor which is affect on production of rice price. There are some causes which are affecting on our production of rice Such as
01. All kinds of natural disaster. 02. Syndicate03. Middle man.
04. Lack of improve technology
05. Lack of capital
06. Down technology
07. Corruption
.Rice price is high because we are not self-sufficient in producing rice and we import rice from many countries. On the other hand we are some facing some problem on production process such Mostly consumers and producer are affected.
EXCESS COSTS OF PROCUREMENT
Compares the procurement price to the market price in the major boor procurement Zone (Rajshahi) to assess whether it would have been possible to procure rice a at lower cost in The eseyears.As shown, the procurement price ranged from 0.27 to1.88 Tk/kg above the May-July average Rajshahi wholesale price of coarse rice from1996 through 1999. Adjustments need to beamed both for rice quality and location, however. Since government procurement standards are higher than the average quality of coarse rice, a quality adjustment of perhaps 0.5 to 1.5 Tk/kg should be added to the market price of rice. On the other hand, procurement generally takesplaceat Local Supply Depots (LSDs) in rural areas and so the costs of handling and transport from the LSD.s to urban wholesale markets must be added, in the range of 0.5 to 1.0 Tk/kg. Tenet adjustment may be rather small and depends on the location of the LSD and the wholesale market. Thus, for example, though the difference between the wholesale market price and the procurement price was only 0.27 Tk/kg in 1999, the government procured 602thousand tons following the boor harvest. If we use this margin of 0.27 Tk/kg as quality and transport factor needed to make wholesale market prices in Rajshahi division comparable to the government procurement price, then the prices paid to farmers in 1996, 1997 and 1998 were excessive by 0.54, 1.61, and 0.08 To/kg, respectively (Estimate II of the excess procurement price). Multiplying by the procurement quantities in these years, 46the estimated excess cost of procurement was 226 million Taka in 1996, 391 million Taka in 1997, and 25 million Taka in 1999. Thus, in principle, the government could have met its objective of procuring rice for security stocks and public distribution at far lower costs. And given that few farmers actually participate in procurement, the vast majority of farmers would have had the same benefits as under fixed-price procurement.
Fluctuation in annual real Rice price In Bangladesh taka
Table 2.8 shows average real prices and coefficients of variation for rice prices expressed in real Taka.8 In real Taka terms, both Indian and Thai rice prices became more stable in the 1990s. Bangladesh real rice prices were slightly more stable than Thai import parity prices, but less stable than Indian import parity rice prices during the 1990s.A comparison of the coefficients of variation of the period since rice import trade liberalization (1994/95-2001/2002) and the previous decade (1984/85 . 1993/94) shows than Bangladesh prices became slightly more stable in nominal terms (Table 2.6) and much more stable in real terms, with the coefficient of variation in the latter period about half the magnitude of the coefficient of variation in the former period (0.100 and 0.190,respectively, Table 2.8). As discussed in the next chapter, the stabilizing influence of private sector imports from India at moderate and very stable prices during times of domestic production shortages in Bangladesh limited price increases. In contrast, Thai rice prices were more variable in real terms (in both dollars and Taka) in the late 1990s as compared to the earlier period. India’s domestic price stabilization efforts thus had positive spillover effects on Bangladesh rice markets.
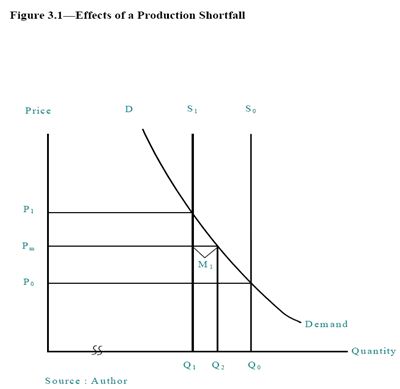
Figure 3.1 illustrates how openness to import trade adds to price stability in the Case of a production shortfall. With a normal harvest, short-run supply in the month’s just after the harvest is indicated by S0. With this level of production, the market price is P0, Determined by the intersection of the supply and demand curves. A production shortfall shifts the short-run supply curve back to S1. In the absence of international trade, the Market price would rise to P1.However, with free trade and an import parity price of Mellow P1, domestic demand is Q2 and the difference between Q2 and Q1 is the sum of Private imports, changes in private stocks and net market injections by the government. Note that in this case, if there is no change in private stocks,11 net market injections less than or equal to M1 have no effect on the price, but only reduce the quantity of imports. A decrease (increase) in private stocks will reduce (increase) the amount of imports, holding ne
PRICE STABILIZATION THROUGH INTERNATIONAL TRADE
Stock modeling exercises have shown that using private sector trade and setting bands close to import and export parity is most efficient in terms of fiscal costs relative to degree of stabilization achieved. With trade liberalization, import parity provides ceiling, though in years of high world prices, this ceiling may be unacceptably high, requiring the government to subsidize imports and draw down its stocks. Illustrates how openness to import trade adds to price stability in the case of a production shortfall. With a normal harvest, short-run supply in the months just after the harvest is indicated by S0. With this level of production, the market price is P0, determined by the intersection of the supply and demand curves. A production shortfall shifts the short-run supply curve back to S1. In the absence of international trade, the market price would rise to P1. However, with free trade and an import parity price of Mellow P1, domestic demand is Q2 and the difference between Q2 and Q1 is the sum of Private imports, changes in private stocks and net market injections by the government. Note that in this case, if there is no change in private stocks,11 net market injections less Than or equal to M1 have no effect on the price, but only reduce the quantity of import.
Market Demand schedule
In economics, the demand curve is the graph depicting the relationship between the price of a certain commodity, and the amount of it that consumers are willing and able to purchase at that given price. It is a graphic representation of a demand schedule. The demand curve for all consumers together follows from the demand curve of every individual consumer: the individual demands at each price are added together. Despite its name, it is not always shown as a curve, but sometimes as a straight line, depending on the complexity of the scenario.
 Demand curves are used to estimate behaviors in competitive markets, and are often combined with supply curves to estimate the equilibrium price (the price at which sellers together are willing to sell the same amount as buyers together are willing to buy, also known as market clearing price) and the equilibrium quantity (the amount of that good or service that will be produced and bought without surplus/excess supply or shortage/excess demand) of that market.[2] In a monopolistic market, the demand curve facing the monopolist is simply the market demand curve.
Conclusion
Examination of rice price variability in Bangladesh shows no clear increase in price instability in the 1990s compared with the 1980s or the second half of the 1970s.Year-to-year fluctuations greater than 10 percent and deviations from the moving average of more than 5 percent occurred more frequently in the 1990s than in the 1980s.However, seasonality of monthly prices was reduced in the 1990s, and coefficients of variation of annual prices fell sharply. Real prices of rice were slightly more unstable in the 1990s, (as measured by the coefficients of variation).Word Year-to-year fluctuations in nominal prices of rice in Bangladesh were very high during the seventies, ranging from 9.1 to 108.6 percent, Prices were especially unstable during the early seventies due to severe rice shortages caused by drought-related production shortfalls and shortage of foreign exchange for government rice imports. ld prices of rice, (Bangkok prices for example), in contrast, have clearly become more stable over time, as the volume of world trade has grown. In the 1990s, Bangladesh domestic prices expressed in Taka were approximately as stable as Bangkok Prices expressed in dollars (as measured in terms of deviations from a moving average Trend.) Overall, the evidence indicates that Bangladesh annual prices were slightly more Stable in the 1990s than international (Thai) prices, though Indian prices, heavily Influenced by Indian government market interventions, were even more stable.