Findings and Analysis:
4. By itself ratio analysis is of little value; the user must have something to which it can be compared, such as a past value for the same company, a comparison with other companies in the same industry, or industry averages. Ratios should be used as ‘‘warning lights’’ to indicate potential problems arising in a company. They indicate the symptom, not necessarily the disease, and need to be used in conjunction with other information to enable the analyst to come up with a firm conclusion about the company.
Chapter # 4 Findings and Analysis |
Items to be discussed:
- Part 1:INCOME STATEMENT
- Horizontal Analysis
- Vertical Analysis
- Part 2: BALANCE SHEET
- Horizontal Analysis
- Vertical Analysis
- Part 3:STAEMENT OF CASH FLOW
- Horizontal Analysis
- Vertical Analysis
- Part 4: RATIO ANALYSIS
- Competitive position
- Trend Analysis
- Part 5: Strength Weakness(SO) Analysis
Income Statement analysis:
Horizontal Analysis:
Rahimafrooz Batteries Limited:
Particulars | Rahimafrooz Batteries Ltd. 2010 | Rahimafrooz Batteries Ltd. 2009 | increase/ decrease | % increase/ Decrease |
| Sales Revenue | 2,605,227,370 | 2,970,760,616 | -365,533,246 | -12.30% |
| Cost of goods sold:- | 2,104,277,839 | 2,366,476,437 | -262,198,598 | -11.08% |
| Gross profit | 500,949,531 | 604,284,179 | -103,334,648 | -17.10% |
| Less: Operating Expenses: | ||||
| Administrative Expenses | 298,264,314 | 292,664,865 | 5,599,449 | 1.91% |
| Marketing and Selling Expenses | 57,566,380 | 78,441,091 | -20,874,711 | -26.61% |
| Operating Profit | 145,118,837 | 233,178,223 | -88,059,386 | -37.76% |
| Less: Financial Expenses | 51,881,470 | 72,655,887 | -20,774,417 | -28.59% |
| Add: Non-Operating Income | 27,002,246 | 2,262,296 | 24,739,950 | 1093.58% |
| Net profit before contribution to WPPF and WF | 120,239,613 | 162,784,632 | -42,545,019 | -26.14% |
| Less: Contribution to WPPF and WF | 5,725,696 | 7,751,649 | -2,025,953 | -26.14% |
| Net profit before tax | 114,513,917 | 155,032,983 | -40,519,066 | -26.14% |
| less: Provision for current tax | 52,557,752 | 54,860,712 | -2,302,960 | -4.20% |
| Less: Provision for deferred tax | 42,791,417 | 42,791,417 | ||
| Net Profit After tax | 19,164,748 | 100,172,271 | -81,007,523 | -80.87% |
Interpretation:
The comparative income statement given above shows that there has been an decrease in net sales of 12.30%. The cost of goods sold has decreased by 11.08%. This has resulted in decrease of gross profit by 17.10%.
Administrative expenses have increased by 1.91% and marketing and selling expenses have decreased by 26.61% and financial expenses have decreased by 28.59%,nonoperating income has increased by 1093.58% and contribution to WPPF and WF has decreased by 26.14% .The decrease in gross profit is insufficient to cover the operating expenses. There is also an decrease in net profit after tax of Tk.( 81,007,523) i.e. 80.87%.
It is concluded from the above analysis that there is not good progress in the performance of the company and the overall profitability of the company is not satisfactory.
Quasem Drycell Limited
Particulars | Quasem Drycell Ltd. 2010 | Quasem Drycell Ltd. 2009 | increase/ decrease | % increase/ Decrease |
| Sales Revenue | 935,094,525 | 969,204,292 | -34,109,767 | -3.519% |
| Cost of goods sold:- | 759,733,376 | 797,390,224 | -37,656,848 | -4.723% |
| Gross profit | 175,361,149 | 171,814,068 | 3,547,081 | 2.064% |
| Less: Operating Expenses: | ||||
| Administrative Expenses | 51,162,699 | 54,202,402 | -3,039,703 | -5.608% |
| Marketing and Selling Expenses | 39,966,022 | 48,631,194 | -8,665,172 | -17.818% |
| Operating Profit | 84,232,428 | 68,980,472 | 15,251,956 | 22.111% |
| Less: Financial Expenses | 32,570,755 | 35,660,810 | -3,090,055 | -8.665% |
| Add: Non-Operating Income | 6,112,973 | 3,489,878 | 2,623,095 | 75.163% |
| Net profit before contribution to WPPF and WF | 57,774,646 | 36,809,540 | 20,965,106 | 56.956% |
| Less: Contribution to WPPF and WF | 2,751,174 | 1,752,835 | 998,339 | 56.956% |
| Net profit before tax | 55,023,472 | 35,056,705 | 19,966,767 | 56.956% |
| less: Provision for current tax | 15,131,455 | 9,640,594 | 5,490,861 | 56.956% |
| Less: Provision for deferred tax | 323,224 | 344,611 | -21,387 | -6.206% |
| Net Profit After tax | 40,215,241 | 25,760,722 | 14,454,519 | 56.111% |
Interpretation:
The comparative income statement given above shows that there has been an decrease in net sales of 3.519%. The cost of goods sold has decreased by 4.723%. This has resulted in slightly increase of gross profit by 2.064%.
Administrative expenses have decreased by 5.608% and marketing and selling expenses have decreased by 17.818% and financial expenses have decreased by 8.665%,nonoperating income has increased by 75.163% and contribution to WPPF and WF has decreased by 56.956% .The increase in gross profit is sufficient to cover the operating expenses. There is also an increase in net profit after tax of Tk14,454,519 i.e. 56.111%.
It is concluded from the above analysis that there is high progress in the performance of the company and the overall profitability of the company is highly satisfactory.
Olympic Batteries Limited
Particulars | Olympic Industries Ltd 2010 | Olympic Industries Ltd 2009 | increase/ decrease | % increase/ Decrease |
| Sales Revenue | 245,775,310 | 209,956,249 | 35,819,061 | 17.060% |
| Cost of goods sold:- | 175,964,808 | 158,042,829 | 17,921,979 | 11.340% |
| Gross profit | 69,810,502 | 51,913,420 | 17,897,082 | 34.475% |
| Less: Operating Expenses: | ||||
| Administrative Expenses | 8,526,204 | 6,895,257 | 1,630,947 | 23.653% |
| Marketing and Selling Expenses | 30,760,881 | 22,623,950 | 8,136,931 | 35.966% |
| Operating Profit | 30,523,417 | 22,394,213 | 8,129,204 | 36.300% |
| Less: Financial Expenses | 3,814,895 | 4,576,212 | -761,317 | -16.636% |
| Add: Non-Operating Income | 978,196 | 748,356 | 229,840 | 30.713% |
| Net profit before contribution to WPPF and WF | 27,686,718 | 18,566,357 | 9,120,361 | 49.123% |
| Less: Contribution to WPPF and WF | 1,318,415 | 884,112 | 434,303 | 49.123% |
| Net profit before tax | 26,368,303 | 17,682,245 | 8,686,058 | 49.123% |
| less: Provision for current tax | 6,741,009 | 4,174,399 | 2,566,610 | 61.485% |
| Less: Provision for deferred tax | 510,274 | 627,256 | -116,982 | -18.650% |
| Net Profit After tax | 19,117,020 | 12,880,590 | 6,236,430 | 48.417% |
Interpretation:
The comparative income statement given above shows that there has been an increase in net sales of 17.060%. The cost of goods sold has increased by 11.340%. This has resulted in high increase of gross profit by 34.475%.
Administrative expenses have increased by 23.653% and marketing and selling expenses have increased by 35.966% and financial expenses have decreased by 16.636%, nonoperating income has increased by 30.713% and contribution to WPPF and WF has increased by 49.123%.The increase in gross profit is sufficient to cover the operating expenses. There is also an increase in net profit after tax of Tk6,236,430 .i.e. 48.417%
It is concluded from the above analysis that there is high progress in the performance of the company and the overall profitability of the company is satisfactory.
Navana Batteries Limited
Particulars | Navana Batteries Ltd. 2010 | Navana Batteries Ltd. 2009 | increase/ decrease | % increase/ Decrease |
| Sales Revenue | 498,689,132 | 281,989,408 | 216,699,724 | 76.847% |
| Cost of goods sold:- | 355,322,803 | 208,516,987 | 146,805,816 | 70.405% |
| Gross profit | 143,366,329 | 73,472,421 | 69,893,908 | 95.129% |
| Less: Operating Expenses: | ||||
| Administrative Expenses | 8,887,858 | 6,274,588 | 2,613,270 | 41.648% |
| Marketing and Selling Expenses | 32,554,197 | 27,311,577 | 5,242,620 | 19.196% |
| Operating Profit | 101,924,274 | 39,886,256 | 62,038,018 | 155.537% |
| Less: Financial Expenses | 15,381,235 | 10,173,290 | 5,207,945 | 51.192% |
| Add: Non-Operating Income | ||||
| Net profit before contribution to WPPF and WF | 86,543,039 | 29,712,966 | 56,830,073 | 191.264% |
| Less: Contribution to WPPF and WF | 4,121,097 | 1,414,903 | 2,706,194 | 191.264% |
| Net profit before tax | 82,421,942 | 28,298,063 | 54,123,879 | 191.264% |
| less: Provision for current tax | 26,037,250 | 7,781,967 | 18,255,283 | 234.584% |
| Less: Provision for deferred tax | ||||
| Net Profit After tax | 56,384,692 | 20,516,096 | 35,868,596 | 174.831% |
Interpretation:
The comparative income statement given above shows that there has been an increase in net sales of 76.847%. The cost of goods sold has increased by 70.405%. This has resulted in high increase of gross profit by 95.129%.
Administrative expenses have increased by 41.648% and marketing and selling expenses have increased by 19.196% and financial expenses have decreased by 51.192%, nonoperating income has not incurred in the both years and contribution to WPPF and WF has increased by 191.264%.The increase in gross profit is sufficient to cover the operating expenses. There is also an increase in net profit after tax of Tk 35,868,596.i.e. 174.831%
It is concluded from the above analysis that there is very high progress in the performance of the company and the overall profitability of the company is highly satisfactory.
Overall Analysis:
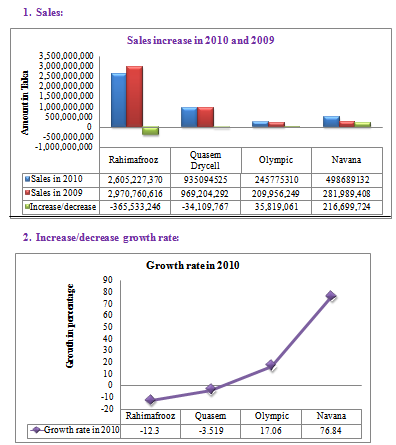
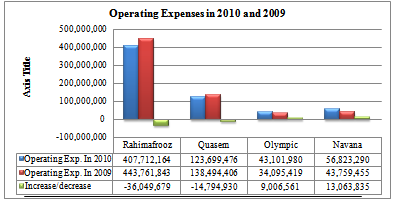
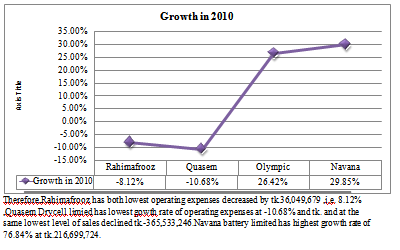
Therefore,Rahimafrooz has both lowest gowth rate of -12.3% and at the same lowest level of sales declined tk.-365,533,246.On the other hand,Navana battery limited has highest growth rate of 76.84% at tk.216,699,724.
1. Operating Expenses(excluding Contribution to WPPF and WF):
 4 N et profit after tax:
- Rahimafrooz Batteries Limited needs to emphasize on the efficient use of resources to get maximum profit in the next year.Vertical Analysis:
Rahimafrooz Batteries Limited and Quasem Drycell Limied
Particulars
Rahimafrooz Batteries Ltd. 2010
Percent (%) On the basis of Sales
Quasem Drycell Ltd. 2010
Percent (%) On the basis of Sales
Sales Revenue 2,605,227,370
100.000%
935,094,525
100.000%
Cost of goods sold:- 2,104,277,839
80.771%
759,733,376
81.247%
Gross profit 500,949,531
19.229%
175,361,149
18.753%
Less: Operating Expenses: Administrative Expenses 298,264,314
11.449%
51,162,699
5.471%
Marketing and Selling Expenses 57,566,380
2.210%
39,966,022
4.274%
Operating Profit 145,118,837
5.570%
84,232,428
9.008%
Less: Financial Expenses 51,881,470
1.991%
32,570,755
3.483%
Add: Non-Operating Income 27,002,246
1.036%
6,112,973
0.654%
Net profit before contribution to WPPF and WF 120,239,613
4.615%
57,774,646
6.178%
Less: Contribution to WPPF and WF 5,725,696
0.220%
2,751,174
0.294%
Net profit before tax 114,513,917
4.396%
55,023,472
5.884%
less: Provision for current tax -52,557,752
-2.017%
-15,131,455
-1.618%
Less: Provision for deferred tax -42,791,417
-1.643%
323,224
0.035%
Net Profit After tax 19,164,748
0.736%
40,215,241
4.301%
Interpretation
Sales and Gross Profit:
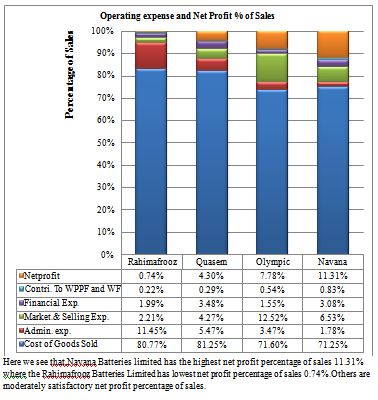
The sale and gross profit are high in absolute figures in Rahimafrooz as compared to quasem drycell Limited and the percentage of gross profit to sales has is relatively high (19.229%) compared to the Quasem Drycell limited(18.753%).
The cost of sales
The cost of sales as a percentage of sales (80.771%) in Rahimafrooz Batteires Limited is relatively low compared to Quasem Drycell Limited (81.247).On the other hand, Rahimafrooz has brought the profitability 19.229% compared to Quasem has 18.753%.
Operating Expenses(Administrative ,Marketing &Selling,Finance expenses) and Contribution to WPPF and WF wtih considering Nonoperating Income:
Rahimafrooz has Operating expenses and Contribution to WPPF and WF as a percentage of sales (15.869%) ,On the other hand Quasem has operating expenses and Contribution to WPPF and WF as a percentage of sales (13.523%).Gross profit as a high percentage of sales(19.229%) but it is insufficient to recover operating expenses and Contribution to WPPF and WF .That’s why,Net profit before tax is 4.396% of sales on the other hand quasem has net profit before tax is 5.884%.
Net profit:
Net profit have decreased both in absolute figures and as a percentage in Rahimafrooz (19,164,748 i,e, 0.736%) as compared to Quasem (40,215,241,i,e, 4.301%).
Rahimafrooz Batteries Limited and Olympic Inustries Limited (Battery Unit)
Particulars
Rahimafrooz Batteries Ltd. 2010
Percent (%) On the basis of Sales
Olympic Industries Ltd 2010
Percent (%) On the basis of Sales
Sales Revenue 2,605,227,370
100.000%
245,775,310
100.000%
Cost of goods sold: 2,104,277,839
80.771%
175,964,808
71.596%
Gross profit 500,949,531
19.229%
69,810,502
28.404%
Less: Operating Expenses: Administrative Expenses 298,264,314
11.449%
8,526,204
3.469%
Marketing and Selling Expenses 57,566,380
2.210%
30,760,881
12.516%
Operating Profit 145,118,837
5.570%
30,523,417
12.419%
Less: Financial Expenses 51,881,470
1.991%
3,814,895
1.552%
Add: Non-Operating Income 27,002,246
1.036%
978,196
0.398%
Net profit before contribution to WPPF and WF 120,239,613
4.615%
27,686,718
11.265%
Less: Contribution to WPPF and WF 5,725,696
0.220%
1,318,415
0.536%
Net profit before tax 114,513,917
4.396%
26,368,303
10.729%
less: Provision for current tax -52,557,752
-2.017%
-6,741,009
-2.743%
Less: Provision for deferred tax -42,791,417
-1.643%
-510,274
-0.208%
Net Profit After tax 19,164,748
0.736%
19,117,020
7.778%
Interpretation
Sales and Gross Profit:
The sale and gross profit are high in absolute figures in Rahimafrooz as compared to Olympic Industries Limited. But the percentage of gross profit to sales has is relatively low (19.229%) compared to the Olympic Industries limited (28.404%)
The cost of sales
The cost of sales as a percentage of sales (80.771%) in Rahimafrooz Batteires Limited is relatively high compared to Olympic Industries (71.596%).On the other hand, Rahimafrooz has brought poor rate of profitability 19.229% compared to Quasem has 28.404%.
Operating Expenses(Administrative ,Marketing &Selling,Finance expenses) and Contribution to WPPF and WF wtih considering Nonoperating Income:
Rahimafrooz has Operating expenses and Contribution to WPPF and WF as a percentage of sales (15.869%) ,On the other hand Olympic has operating expenses and Contribution to WPPF and WF as a percentage of sales (18.073%).Gross profit as a high percentage of sales(19.229%) but it is insufficient to recover operating expenses and Contribution to WPPF and WF .That’s why,Net profit before tax is 4.396% of sales on the other hand Olympic has net profit before tax is 10.729%.
Net profit: Net profit has increased in absolute figures in Rahimafrooz (Tk.19,164,748) compared to OlympicTk.19,117,020.On the other hand net profit as percentage of sales ( 0.736%) is very poor compared to Olympic (7.778%)
Rahimafrooz Batteries Limited and Navana Batteries Limited
Particulars
Rahimafrooz Batteries Ltd. 2010
Percent (%) On the basis of Sales
Navana Batteries Ltd. 2010
Percent (%) On the basis of Sales
Sales Revenue 2,605,227,370
100.000%
498,689,132
100.000%
Cost of goods sold: 2,104,277,839
80.771%
355,322,803
71.251%
Gross profit 500,949,531
19.229%
143,366,329
28.749%
Less: Operating Expenses: Administrative Expenses 298,264,314
11.449%
8,887,858
1.782%
Marketing and Selling Expenses 57,566,380
2.210%
32,554,197
6.528%
Operating Profit 145,118,837
5.570%
101,924,274
20.438%
Less: Financial Expenses 51,881,470
1.991%
15,381,235
3.084%
Add: Non-Operating Income 27,002,246
1.036%
0.000%
Net profit before contribution to WPPF and WF 120,239,613
4.615%
86,543,039
17.354%
Less: Contribution to WPPF and WF 5,725,696
0.220%
4,121,097
0.826%
Net profit before tax 114,513,917
4.396%
82,421,942
16.528%
less: Provision for current tax -52,557,752
-2.017%
-26,037,250
-5.221%
Less: Provision for deferred tax -42,791,417
-1.643%
0.000%
Net Profit After tax 19,164,748
0.736%
56,384,692
11.307%
Interpretation: Sales and Gross Profit:
The sale and gross profit are high in absolute figures in Rahimafrooz as compared to Navana Batteries Limited. But the percentage of gross profit to sales has is relatively low (19.229%) compared to the Navana Batteries limited (28.404%)
The cost of sales
The cost of sales as a percentage of sales (80.771%) in Rahimafrooz Batteires Limited is relatively high compared to Navana Batteries (71.596%).On the other hand, Rahimafrooz has brought poor rate of profitability 19.229% compared to Navana Batteries has 28.404%.
Operating Expenses(Administrative ,Marketing &Selling,Finance expenses) and Contribution to WPPF and WF wtih considering Nonoperating Income:
Rahimafrooz has Operating expenses and Contribution to WPPF and WF as a percentage of sales (15.869%) ,On the other hand Navana Batteries has operating expenses as a percentage of sales (12.221%).Gross profit as a low percentage of sales(19.229%) so it is insufficient to recover operating expenses and Contribution to WPPF and WF .That’s why,Net profit before tax is 4.396% of sales on the other hand Navana Batteries has net profit before tax is 11.307%.
Net profit:
Net profit has increased in absolute figures in Rahimafrooz (Tk.19,164,748) compared to Navana Batteries Tk.19,117,020.On the other hand net profit as percentage of sales ( 0.736%) is very poor compared to Navana Batteries (7.778%)
Statement Of financial PositionHorizontal Analysis:
Rahimafrooz Batteries Ltd.
ASSETS
Rahimafrooz Batteries Ltd. 2010
Rahimafrooz Batteries Ltd. 2009
Increase/ decrease
Percentage of Growth
Non-Current Assets Property, plant and Equipment 413,465,817
476,548,379
-63,082,562
-13.237%
Capital Work in progress Intangible Assets: Goodwill 28,808,059
32,008,954
-3,200,895
-10.000%
Trademark and Brand Names 7,875,000
8,750,000
-875,000
-10.000%
Priliminary expenses Total
450,148,876
517,307,333
-67,158,457
-12.982%
Investments: 206,655,806
100,010,000
106,645,806
106.635%
Current assets: Inventories 470,966,115
362,108,817
108,857,298
30.062%
Receivables 146,238,314
171,200,161
-24,961,847
-14.581%
Advances, deposits and prepayments 325,989,928
304,572,437
21,417,491
7.032%
Inter-company current account-receivable 237,090,676
97,248,950
139,841,726
143.798%
cash and cash equivalent 10,355,735
9,289,860
1,065,875
11.474%
Income tax deducted at source Total
1,190,640,768
944,420,225
246,220,543
26.071%
Total assts 1,847,445,450
1,561,737,558
285,707,892
18.294%
EQUITY AND LIABILITIES Equity: Capital and reserves Share Capital 111,390,900
111,390,900
revalutaiton reserve 63,396,995
63,396,995
Share premium Reserve account 1,670,500
1,670,500
Redemption reserve account 132,898,500
132,898,500
Retained earnings 282,238,948
296,491,469
-14,252,521
-4.807%
Total
591,595,843
605,848,364
-14,252,521
-2.352%
Liabilties: Non-current Liabilities: long term Loan 28,126,648
30,524,373
-2,397,725
-7.855%
liability for gratuity 39,241,035
33,387,310
5,853,725
17.533%
Provision for deferred tax 42,791,417
0
42,791,417
lease finance-long term Other deffered liabilities Total 110,159,100
63,911,683
46,247,417
72.361%
Current Liabilites: Bank Overdraft 27,764,361
62,560,734
-34,796,373
-55.620%
short term loan 537,836,968
404,566,437
133,270,531
32.942%
Accounts Payable 163,145,791
18,983,999
144,161,792
759.386%
Accrued expenses and other payable 183,056,698
201,739,320
-18,682,622
-9.261%
long term Loan-short term maturity 29,101,856
51,899,941
-22,798,085
-43.927%
Provision for taxation 204,784,832
152,227,080
52,557,752
34.526%
Unearned revenue Total
1,145,690,506
891,977,511
253,712,995
28.444%
Total Liabilities
1,255,849,606
955,889,194
299,960,412
31.380%
Total assts 1,847,445,449
1,561,737,558
285,707,891
18.294%
Interpretation:
The comparative balance sheet of the company reveals that during 2010 there has been an decrease in fixed assets of Tk. 3,200,895 i.e. -10%. Noncurrent Liabilities to outsiders have relatively increased by Tk. 46,247,417and equity share capital has decreased byTk.14,252,521. This fact indicates that the policy of the company is to sale fixed assets to meet up the long-term sources of finance.Besides,
The current assets have increased by Tk. 246,220,543 i.e. 26.071% and cash has increased by 1,065,875 ,i,e,. The current liabilities have increased only by253,712,995 i.e. 28.444% .This further confirms that the company has used long-term finances even for the current assets resulting into an not so much improvement in the liquidity position of the company. No working capital.
Noncurrent liabilities increased by . 46,247,417 (72.361%), Current Liabilities increased by Tk. 253,712,995 (28.444%),fixed assets decreased by 67,158,457 (12.982%),Investment is increased by Tk. 106,645,806 (106.635%).So, Company uses the long term and short term sources of financing in taking investment. Total assets is increased by 285,707,892 (18.294% ) where equity portion is decreased by -14,252,521 (-2.352%) and total liabilities is increased by 299,960,412 (31.380%).So, the company is dependent on outside claim too much.
The overall financial position of the company is not satisfactory.
Quasem Drycell Ltd.
ASSETS Quasem Drycell Ltd. 2010 Quasem Drycell Ltd. 2009 Increase/ decrease Percentage of Growth Non-Current Assets property,plant and Equipment 363,282,344 308,261,353 55,020,991 17.849% Capital Work in progress 126,307,883 187,154,436 -60,846,553 -32.511% Intangible Assets: Goodwill Trademark and Brand Names 3,764,075
3,948,888
-184,813
-4.680%
Priliminary expenses Total
493,354,302
499,364,677
-6,010,375
-1.204%
Investments: 16,000,000
1,000,000
15,000,000
1500.000%
Current assets: Inventories 221,552,994
185,830,294
35,722,700
19.223%
Receivables 24,161,564
31,272,784
-7,111,220
-22.739%
Advances,deposits and prepayments 89,039,555
99,778,054
-10,738,499
-10.762%
Inter-company current account-receivable 32,613,585
26,749,309
5,864,276
21.923%
cash and cash equivalent 9,182,358
6,902,127
2,280,231
33.037%
Income tax deducted at source Total
376,550,056
350,532,568
26,017,488
7.422%
Total assts 885,904,358
850,897,245
35,007,113
4.114%
EQUITY AND LIABILITIES Equity: Capital and reserves Share Capital 192,000,000
192000000
revalutaiton reserve 55,728,358
57869772
-2,141,414
-3.700%
Share premium 198,000,000
198000000
Reserve account Redemption reserve account Retained earnings 63,466,424
52051183
11,415,241
21.931%
Total
509,194,782
499920955
9,273,827
1.855%
Liabilties: Non-current Liabilities: long term Loan 8,377,075
17622997
-9,245,922
-52.465%
liability for gratuity Provision for deferred tax lease finance-long term Other deffered liabilities 1,467,602
1790826
-323,224
-18.049%
Total 9844677
19413823
-9,569,146
-49.290%
Current Liabilites: Bank Overdraft short term loan 275,085,801
255358944
19,726,857
7.725%
Accounts Payable 5,535,542
15,671,790
-10,136,248
-64.678%
Accrued expenses and other payable 43,895,008
3,331,4640
10,580,368
31.759%
long term Loan-short term maturity Provision for taxation 42,348,548
27,217,093
15,131,455
55.595%
Unearned revenue Total
366,864,899
331,562,467
35,302,432
10.647%
Total Liabilities
376,709,576
350,976,290
25,733,286
7.332%
Total assts 885,904,358
850,897,245
35,007,113
4.114%
Interpretation:
The comparative balance sheet of the company reveals that during 2010 there has been an decrease in fixed assets of Tk. -6,010,375 i.e. -1.204%, Noncurrent Liabilities to outsiders have relatively decreased by Tk 9,569,146,i,e,( -49.290%)and equity share capital has increased byTk. 9,273,827,i,e,(1.855%). This fact indicates that the policy of the company is to sale fixed assets to meet up the long-term sources of finance and also increases the equity capital of the company.
The current assets have increased by Tk. 26,017,488,i.e. 7.422% and cash has increased by 2,280,231,i,e, 33.037%. The current liabilities have increased only by 35,302,432,i.e. 10.647%.This further confirms that the company has used long-term finances even for the current assets resulting into an not so much improvement in the liquidity position of the company.No working capital.
Noncurrent liabilities decreased by . -9,569,146 (-49.290%), Current Liabilities increased by Tk. 35,302,432 (10.647%),fixed assets decreased by 6,010,375 (-1.204%),Investment is increased by Tk. 15,000,000 (1500.000%).So, Company uses the long term and short term sources of financing in taking investment. Total assets is increased by 35,007,113 (4.114%) where equity portion is increased by 9,273,827 (1.855%) and total liabilities is increased by 25,733,286 (7.332%).So, the company is dependent on outside claim too much.
The overall financial position of the company is not satisfactory
Olympic Industries Ltd.
ASSETS
Olympic Industries Ltd. 2010
Olympic Industries Ltd. 2009
Increase/ decrease
Percentage of Growth
Non-Current Assets property,plant and Equipment 56,458,194
45,488,028
10,970,166
24.117%
Capital Work in progress Intangible Assets: Goodwill Trademark and Brand Names Priliminary expenses Total
56,458,194
45,488,028
10,970,166
24.117%
Investments: Current assets: Inventories 24,512,371
19,707,807
4,804,564
24.379%
Receivables 1,354,329
3,511,082
-2,156,753
-61.427%
Advances,deposits and prepayments 19,009,701
14,828,369
4,181,332
28.198%
Inter-company current account-receivable cash and cash equivalent 34,856,781
16,093,043
18,763,738
116.595%
Income tax deducted at source Total
79,733,182
54,140,301
25,592,881
47.271%
Total assts 136,191,376
99,628,329
36,563,047
36.699%
EQUITY AND LIABILITIES Equity: Capital and reserves Share Capital 23,218,170
19,348,480
3,869,690
20.000%
revalutaiton reserve Share premium 5,692,915
9,562,605
-3,869,690
-40.467%
Reserve account Redemption reserve account Retained earnings 23,708,253
6,526,082
17,182,171
263.285%
Total
52,619,338
35,437,167
17,182,171
48.486%
Liabilties: Non-current Liabilities: long term Loan 6,268,605
3,446,980
2,821,625
81.858%
liability for gratuity Provision for deferred tax lease finance-long term 4,175,990
5,721,943
-1,545,953
-27.018%
Other deffered liabilities 8,020,266
6,012,097
2,008,169
33.402%
Total
18,464,861
15,181,020
3,283,841
21.631%
Current Liabilites: Bank Overdraft short term loan 13,936,600
10,787,422
3,149,178
29.193%
Accounts Payable 19,021,551
13,549,959
5,471,592
40.381%
Accrued expenses and other payable 7,372,234
8,678,324
-1,306,090
-15.050%
long term Loan-short term maturity 3,201,826
2,340,657
861,169
36.792%
Provision for taxation 14,592,533
7,851,524
6,741,009
85.856%
Unearned revenue 6,982,433
5,802,256
1,180,177
20.340%
Total
65,107,177
49,010,142
16,097,035
32.844%
Total Liabilities
83,572,038
64,191,162
19,380,876
30.192%
Total assts 136,191,376
99,628,329
36,563,047
36.699%
Interpretation:
The comparative balance sheet of the company reveals that during 2010 there has been an increase in fixed assets of Tk. 10,970,166 ,i.e. 24.117%.Noncurrent Liabilities to outsiders have relatively increased by Tk 3,283,841,i,e,( 21.631%)and equity share capital has increased byTk. 17,182,171,i,e,( 48.486%). This fact indicates that the policy of the compan is to purchase fixed assets from the long-term equity and debt sources of finance No investment is made.
The current assets have increased by Tk. 25,592,881,i.e. 47.271% and cash has increased by 18,763,738,i,e, 116.595%. The current liabilities have increased only by 16,097,035,i.e. 32.844%.This further confirms that the company has used long-term finances even for the current assets resulting into much improvement in the liquidity position of the company.
Total assets is increased by 36,563,047 (36.699%) where equity portion is increased by 17,182,171 (48.486%) and total liabilities is increased by 19,380,876 (30.192%).So, the company is dependent on outside claim slightly.
The overall financial position of the company is satisfactory
Navana Batteries Limited
ASSETS
Navana Batteries Ltd. 2010
Navana Batteries Ltd. 2009
Increase/ decrease
Percentage of Growth
Non-Current Assets property,plant and Equipment 127,650,378
113,654,664
13,995,714
12.314%
Capital Work in progress 214,369,352
0
214,369,352
Intangible Assets: Goodwill Trademark and Brand Names 238,925
48,360
190,565
394.055%
Priliminary expenses Total
342,258,655
113,703,024
228,555,631
201.011%
Investments: Current assets: Inventories 111,150,844
75,759,811
35,391,033
46.715%
Receivables 58,582,418
70,208,463
-11,626,045
-16.559%
Advances,deposits and prepayments 31,766,320
17,493,038
14,273,282
81.594%
Inter-company current account-receivable cash and cash equivalent 27,426,959
7,348,118
20,078,841
273.251%
Income tax deducted at source 16,452,311
7,879,424
8,572,887
108.801%
Total
245,378,852
178,688,854
66,689,998
37.322%
Total assts 587,637,507
292,391,878
295,245,629
100.976%
EQUITY AND LIABILITIES Equity: Capital and reserves Share Capital 183,702,690
183,702,690
Revalutaiton reserve Share premium Reserve account Redemption reserve account Retained earnings 56,384,692
56,384,692
Total
240,087,382
183,702,690
56,384,692
30.693%
Liabilties: Non-current Liabilities: long term Loan liability for gratuity Provision for deferred tax lease finance-long term Other deffered liabilities Total Current Liabilites: Bank Overdraft short term loan 77,981,071
66,062,121
11,918,950
18.042%
Accounts Payable 181,173,288
0
181,173,288
Accrued expenses and other payable 88,395,767
42,627,067
45,768,700
107.370%
long term Loan-short term maturity Provision for taxation Unearned revenue Total
347,550,126
108,689,188
238,860,938
219.765%
Total Liabilities
347,550,126
108,689,188
238,860,938
219.765%
Total assts 587,637,508
292,391,878
295,245,630
100.976%
Interpretation:
The comparative balance sheet of the company reveals that during 2010 there has been an increase in fixed assets of Tk 10,970,166,i.e. 24.117%.Noncurrent Liabilities to outsiders have relatively increased by Tk 3,283,841,i,e,( 21.631%)and equity share capital has increased byTk. 17,182,171,i,e,( 48.486%). This fact indicates that the policy of the company is to purchase fixed assets from the long-term equity and debt sources of finance .No investment is made.
The current assets have increased by Tk. 25,592,881,i.e,47.271% and cash has increased by 18,763,738,i,e, 116.595%. The current liabilities have increased only by 16,097,035,i.e. 32.844%.This further confirms that the company has used long-term finances even for the current assets resulting into much improvement in the liquidity position of the company
Total assets is increased by 36,563,047 (36.699%) where equity portion is increased by 17,182,171 (48.486%) and total liabilities is increased by 19,380,876 (30.192%)So, the company is going to dependent on itself.
The overall financial position of the company is satisfactory
Overall Analysis:
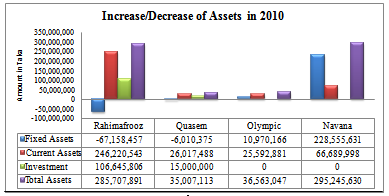

Rahimafrooz Batteries limited has reduced fixed assets Tk.-67,158,457 and negative growth rate is -12.98%. Company has sold the fixed assets and laid out their money in investments Tk.106,645,806 (106.64%) from noncurrent liabilities increased 72.36% Tk.253,712,995.
Quasem Drycell limited has reduced fixed assets Tk. -6,010,375 respectively and negative growth rate is -1.20% .Both company has sold the fixed assets and laid out their money in investments Tk.15,000,000(1500%) from equity funds increased by 9,273,827 (1.86%).They made equity injection.(lowering the debt-equity ratio).
Olympic Industries Limited has no investment, they purchasing fixed assets by 10,970,166 with the growth rate of 24.12% from equity increase by 48.49% and noncurrent liability also increased by 21.63% and current liability is 32.84%.It has the highest increased working capital Tk.9,495,846.
Navana Batteries Limited have no investment, they purchasing fixed assets by 228,555,631 201.01% from increased current liabilities is 238860938 (219.765%).It is suffering lowest working capital tk.-172,170,940.
Vertical Analysis:
Rahimafrooz Batteries Limited and Quasem Drycell Limited
Particulars | Rahimafrooz Batteries Ltd. 2010 | Percent (%of Total Assets) | Quasem Drycell Ltd. 2010 | Percent (%of Total Assets) |
| Non-Current Assets | ||||
| property,plant and Equipment | 413,465,817 | 22.380% | 363,282,344 | 41.007% |
| Capital Work in progress | 126,307,883 | 14.258% | ||
| Intangible Assets: | ||||
| Goodwill | 28,808,059 | 1.559% | ||
| Trademark and Brand Names | 7,875,000 | 0.426% | 3,764,075 | 0.425% |
| Priliminary expenses | ||||
Total | 450,148,876 | 24.366% | 493,354,302 | 55.689% |
| Investments: | 206,655,806 | 11.186% | 16,000,000 | 1.806% |
| Current assets: | ||||
| Inventories | 470,966,115 | 25.493% | 221,552,994 | 25.009% |
| Receivables | 146,238,314 | 7.916% | 24,161,564 | 2.727% |
| Advances,deposits and prepayments | 325,989,928 | 17.645% | 89,039,555 | 10.051% |
| Inter-company current account-receivable | 237,090,676 | 12.833% | 32,613,585 | 3.681% |
| cash and cash equivalent | 10,355,735 | 0.561% | 9,182,358 | 1.036% |
| Income tax deducted at source | ||||
Total | 1,190,640,768 | 64.448% | 376,550,056 | 42.505% |
| Total assts | 1,847,445,450 | 100.000% | 885,904,358 | 100.000% |
| EQUITY AND LIABILITIES | ||||
| Equity: | ||||
| Capital and reserves | ||||
| Share Capital | 111,390,900 | 6.029% | 192000000 | 21.673% |
| revalutaiton reserve | 63,396,995 | 3.432% | 55728358 | 6.291% |
| Share premium | 198000000 | 22.350% | ||
| Reserve account | 1,670,500 | 0.090% | ||
| Redemption reserve account | 132,898,500 | 7.194% | ||
| Retained earnings | 282,238,948 | 15.277% | 63466424 | 7.164% |
Total | 591,595,843 | 32.022% | 509194782 | 57.477% |
| Liabilities: | ||||
| Non-current Liabilities: | ||||
| long term Loan | 28,126,648 | 1.522% | 8377075 | 0.946% |
| liability for gratuity | 39,241,035 | 2.124% | ||
| Provision for deferred tax | 42,791,417 | 2.316% | ||
| lease finance-long term | ||||
| Other deffered liabilities | 1467602 | 0.166% | ||
| Total | 110,159,100 | 5.963% | 9844677 | 1.111% |
| Current Liabilites: | ||||
| Bank Overdraft | 27,764,361 | 1.50285% | ||
| short term loan | 537,836,968 | 29.112% | 275085801 | 31.051% |
| Accounts Payable | 163,145,791 | 8.831% | 5535542 | 0.625% |
| Accrued expenses and other payable | 183,056,698 | 9.909% | 43895008 | 4.955% |
| long term Loan-short term maturity | 29,101,856 | 1.575% | ||
| Provision for taxation | 204,784,832 | 11.085% | 42348548 | 4.780% |
| Unearned revenue | ||||
Total | 1,145,690,506 | 62.015% | 366864899 | 41.411% |
| Total Liabilities | 1,255,849,606 | 67.978% | 376,709,576 | 42.523% |
| Total assets | 1,847,445,449 | 100.000% | 885,904,358 | 100.000% |
Interpretation:
(i) An analysis of pattern of financing of both the companies shows that Quasem Drycell Ltd is more traditionally financed as compared to Rahimafrooz Batteries Ltd. The former company has depended more on its own funds as is shown by balance sheet. Out of total investment, 57.477% of the funds are proprietory funds and outsiders funds account only for 42.523%. In Rahimafrooz Batteries Ltd proprietors’ fund are 32.022% while the share of outsiders funds is 67.978%which shows that this company has depended more upon outsiders funds.
(ii) Both the companies are enjoying sufficiency of working capital. The percentage of current liabilities is more than the percentage of current assets in both the companies.
(iii) A close look at the balance sheet shows that investments in fixed assets have been from working capital in both the companies. In Rahimafrooz Batteries Limited fixed assets account for 24.366% of total assets.But it uses the funds of working capital in investment projects(11.186%).While in Quasem Drycell limited fixed assets account for 55.689%,this company purchases more fixed assets from working capital.
(iv) Thus, both the companies has moderate level of working capital .So, immediate steps should be taken to issue more capital or raise long term loans to improve working capital position.
Rahimafrooz Batteries and Olympic Industries Limited
Particulars | Rahimafrooz Batteries Ltd. 2010 | Percent (%of Total Assets) | Olympic Industries Ltd. 2010 | Percent (%of Total Assets) |
| Non-Current Assets | ||||
| Property,plant and Equipment | 413,465,817 | 22.380% | 56,458,194 | 41.455% |
| Capital Work in progress | ||||
| Intangible Assets: | ||||
| Goodwill | 28,808,059 | 1.559% | ||
| Trademark and Brand Names | 7,875,000 | 0.426% | ||
| Preliminary expenses | ||||
Total | 450,148,876 | 24.366% | 56,458,194 | 41.455% |
| Investments: | 206,655,806 | 11.186% | ||
| Current assets: | ||||
| Inventories | 470,966,115 | 25.493% | 24,512,371 | 17.998% |
| Receivables | 146,238,314 | 7.916% | 1,354,329 | 0.994% |
| Advances, deposits and prepayments | 325,989,928 | 17.645% | 19,009,701 | 13.958% |
| Inter-company current |
account-receivable
237,090,676
12.833%
cash and cash equivalent
10,355,735
0.561%
34,856,781
25.594%
Income tax deducted at source
Total
1,190,640,768
64.448%
79,733,182
58.545%
Total assts
1,847,445,450
100.000%
136,191,376
100.000%
EQUITY AND LIABILITIES Equity: Capital and reserves Share Capital
111,390,900
6.029%
23,218,170
17.048%
Revaluation reserve
63,396,995
3.432%
Share premium
5,692,915
4.180%
Reserve account
1,670,500
0.090%
Redemption reserve account
132,898,500
7.194%
Retained earnings
282,238,948
15.277%
23,708,253
17.408%
Total
591,595,843
32.022%
52,619,338
38.636%
Liabilties: Non-current Liabilities: long term Loan
28,126,648
1.522%
6,268,605
4.603%
liability for gratuity
39,241,035
2.124%
Provision for deferred tax
42,791,417
2.316%
lease finance-long term
4,175,990
3.066%
Other deffered liabilities
8,020,266
5.889%
Total
110,159,100
5.963%
18,464,861
13.558%
Current Liabilites: Bank Overdraft
27,764,361
1.50285%
short term loan
537,836,968
29.112%
13,936,600
10.233%
Accounts Payable
163,145,791
8.831%
19,021,551
13.967%
Accrued expenses and other payable
183,056,698
9.909%
7,372,234
5.413%
long term Loan-short term maturity
29,101,856
1.575%
3,201,826
2.351%
Provision for taxation
204,784,832
11.085%
14,592,533
10.715%
Unearned revenue
6,982,433
5.127%
Total
1,145,690,506
62.015%
65,107,177
47.806%
Total Liabilities
1,255,849,606
67.978%
83,572,038
61.364%
Total assts
1,847,445,449
100.000%
136,191,376
100.000%
Interpretation:
(i) An analysis of pattern of financing of both the companies shows that Olympic Industries Ltd is more traditionally financed as compared to Rahimafrooz Batteries Ltd. The former company has depended more on its own funds as is shown by balance sheet. Out of total investment, 38.636%of the funds are proprietory funds and outsiders funds account only for 61.364%. In Rahimafrooz Batteries Ltd proprietors’ fund are 32.022% while the share of outsiders funds is 67.978% which shows that this company has depended more upon outsiders funds.
(ii) Both the companies are enjoying for the sufficiency of working capital. The percentage of current liabilities is more than the percentage of current assets in both the companies.But, Olympic has high percentage of working capital of the total assets(10.739%) where Rahimafrooz Batteries Limited has 2.433% of the total assets.
(iii) A close look at the balance sheet shows that investments in fixed assets have been from working capital in both the companies. In Rahimafrooz Batteries Limited fixed assets account for 24.366% of total assets. But it uses the funds of working capital in investment projects(11.186%).While in Olympic Industries limited fixed assets account for 41.455%,this company purchases more fixed assets from working capital.
(iv) Thus, both the companies has moderate level of working capital .But,Rahimafrooz has high dependency on outside claim than internal funds.So, immediate steps should be taken to issue more capital or raise long term loans to improve working capital position.
Rahimafrooz Batteries Limited and Navana Batteries Limited
Particulars | Rahimafrooz Batteries Ltd. 2010 | Percent (%of Total Assets) | Navana Batteries Ltd. 2010 | Percent (%of Total Assets) |
| Non-Current Assets | ||||
| Property, plant and Equipment | 413,465,817 | 22.380% | 127,650,378 | 21.723% |
| Capital Work in progress | 214,369,352 | 36.480% | ||
| Intangible Assets: | ||||
| Goodwill | 28,808,059 | 1.559% | ||
| Trademark and Brand Names | 7,875,000 | 0.426% | 238,925 | 0.041% |
| Priliminary expenses | ||||
Total | 450,148,876 | 24.366% | 342,258,655 | 58.243% |
| Investments: | 206,655,806 | 11.186% | ||
| Current assets: | ||||
| Inventories | 470,966,115 | 25.493% | 111,150,844 | 18.915% |
| Receivables | 146,238,314 | 7.916% | 58,582,418 | 9.969% |
| Advances,deposits and prepayments | 325,989,928 | 17.645% | 31,766,320 | 5.406% |
| Inter-company current account-receivable | 237,090,676 | 12.833% | ||
| cash and cash equivalent | 10,355,735 | 0.561% | 27,426,959 | 4.667% |
| Income tax deducted at source | 16,452,311 | 2.800% | ||
Total | 1,190,640,768 | 64.448% | 245,378,852 | 41.757% |
| Total assts | 1,847,445,450 | 100.000% | 587,637,507 | 100.000% |
| EQUITY AND LIABILITIES | ||||
| Equity: | ||||
| Capital and reserves | ||||
| Share Capital | 111,390,900 | 6.029% | 183,702,690 | 31.261% |
| revalutaiton reserve | 63,396,995 | 3.432% | ||
| Share premium | ||||
| Reserve account | 1,670,500 | 0.090% | ||
| Redemption reserve account | 132,898,500 | 7.194% | ||
| Retained earnings | 282,238,948 | 15.277% | 56,384,692 | 9.595% |
Total | 591,595,843 | 32.022% | 240,087,382 | 40.856% |
| Liabilties: | ||||
| Non-current Liabilities: | ||||
| long term Loan | 28,126,648 | 1.522% | ||
| liability for gratuity | 39,241,035 | 2.124% | ||
| Provision for deferred tax | 42,791,417 | 2.316% | ||
| Lease finance-long term | ||||
| Other deferred liabilities | ||||
| Total | 110,159,100 | 5.963% | ||
| Current Liabilities: | ||||
| Bank Overdraft | 27,764,361 | 1.50285% | ||
| Short term loan | 537,836,968 | 29.112% | 77,981,071 | 13.270% |
| Accounts Payable | 163,145,791 | 8.831% | 181,173,288 | 30.831% |
| Accrued expenses and other payable | 183,056,698 | 9.909% | 88,395,767 | 15.043% |
| Long term Loan-short term maturity | 29,101,856 | 1.575% | ||
| Provision for taxation | 204,784,832 | 11.085% | ||
| Unearned revenue | ||||
Total | 1,145,690,506 | 62.015% | 347,550,126 | 59.144% |
| Total Liabilities | 1,255,849,606 | 67.978% | 347,550,126 | 59.144% |
| Total assts | 1,847,445,449 | 100.000% | 587,637,508 | 100.000% |
Interpretation
(i) An analysis of pattern of financing of both the companies shows that Navana Batteries Ltd is more traditionally financed as compared to Rahimafrooz Batteries Ltd. The former company has depended more on its own funds as is shown by balance sheet. Out of total investment, 40.856% of the funds are proprietory funds and outsiders funds account only for 59.144%.In Rahimafrooz Batteries Ltd proprietors’ fund are 32.022% while the share of outsiders funds is 67.978% which shows that this company has depended more upon outsiders funds.
(ii) Rahimafrooz Batteries Limited is enjoying for the sufficiency of working capital. The percentage of current liabilities is more than the percentage of current assets in both the companies.But, Navana Batteries Limited has negative percentage of working capital of the total assets (-17.387%) where Rahimafrooz Batteries Limited has 2.433% of the total assets.
(iii) In Rahimafrooz Batteries Limited fixed assets account for 24.366% of total assets. But it uses the funds of working capital in investmentprojects(11.186%).While in Navana Batteries limited fixed assets account for 58.243% this company purchases more fixed assets from equity financing (240,087,382,i,e,40.856%).
(iv) Thus, Rahimafrooz Batteries Limited has moderate level of working capital But Navana Batteries Limited has negative working capital.On the other hand,Rahimafrooz has high dependency on outside claim than internal funds. So, immediate steps should be taken to issue more capital or raise long term loans to improve working capital position.
Overall Analysis:
Here, we see that Rahimafrooz has highly dependent on external debt equity holding only 32.02% of the total capital structure where Quasem holding the highest dependency on the funds.
Rahimafrooz has focused highly in investment and on the other hand Olympic and Navana has also focused highly on investing fixed assets.
Statement of Cash Flow:
Horizontal Analysis:
Rahimafrooz Batteries Limited
Particulars | Rahimafrooz Batteries Ltd. 2010 | Rahimafrooz Batteries Ltd. 2009 | Increase/ Decrease | % of Growth |
| INFLOWS | ||||
| Cash Inflows from Operating Activities: | ||||
| Cash receipt from customers and other income | 2631894036 | 3025863289 | -393969253 | -13.020% |
Total | 2631894036 | 3025863289 | -393969253 | -13.020% |
| Cash inflows from Investing Activities: | ||||
| sale proceeds from property,plant and equipment | 580150 | 672999 | -92849 | -13.796% |
| Income from Interest on FDR | 14672562 | 1134247 | 13538315 | 1193.595% |
Total | 15252712 | 1807246 | 13445466 | 743.975% |
| Cash inflow from financing activities: | ||||
| Short-term Loan | 98474158 | 98474158 | nil | |
| Lease finance | ||||
| Intercompany | 129781126 | -129781126 | -100.000% | |
| Liability for otheres finance | ||||
Total | 98474158 | 129781126 | -31306968 | -24.123% |
TOTAL INFLOWS | 2,745,620,906 | 3,157,451,661 | -411830755 | -13.043% |
| OUTFLOWS: | ||||
| Outflows from Operating Activities: | ||||
| Payment for cost and expenses | 2297037902 | 2714715212 | -417677310 | -15.386% |
| income tax paid | 50128223 | 60546700 | -10418477 | -17.207% |
| Interest expenses | 50363565 | 64933954 | -14570389 | -22.439% |
Total | 2397529690 | 2840195866 | -442666176 | -15.586% |
| Outflows from Investing Activities: | ||||
| Purchase of Property,plant and equipment | 46479355 | 73615556 | -27136201 | -36.862% |
| Property,plant and equipment in transit | 1299097 | 526921 | 772176 | 146.545% |
| Investment in share money deposit | 106645806 | 100010000 | 6635806 | 6.635% |
Total | 154424258 | 174152477 | -19728219 | -11.328% |
| Cash Outflows from finnancing activities: | ||||
| Long-term Loan | 19342085 | 64385474 | -45043389 | -69.959% |
| Lease finance | ||||
| Liability for otheres finance | ||||
| Short-term Loan | 44782254 | -44782254 | -100.000% | |
| Intercompany | 139841729 | 139841729 | ||
| Repayment of Secured Loan and Interest | ||||
| Dividend paid | 33417270 | 44556360 | -11139090 | -25.000% |
Total | 192601084 | 153724088 | 38876996 | 25.290% |
TOTAL OUTFLOWS | 2744555032 | 3168072431 | -423517399 | -13.368% |
| Net cash flow from operating/financing and investing activities | 1,065,874 | -10,620,770 | 11686644 | -110.036% |
| Opening Balance | 9289860 | 19910630 | -10620770 | -53.342% |
| Closing Balance | 10355734 | 9,289,860 | 1065874 | 11.474% |
Overall Analysis:
|
Rahimafrooz Batteries Limited has decreased its cash inflows from operating activities and cash outflows from operating activities both are decreased. Cash inflow from investing is increased because Rahimafrooz Batteries Limited has invested it in share money market and on the same as the cash inflow from financing activities decreased and cash outflow from financing activities increased.
Vertical Analysis:
| Particulars | Rahimafrooz Batteries Ltd. 2010 | Percentage (%) | Quasem Drycell Batteries Ltd. 2010 | Percentage (%) |
| INFLOWS | ||||
| Cash Inflows from Operating Activities: | ||||
| Cash receipt from customers and other income | 2631894036 | 95.858% | 1,032,429,436 | 97.432% |
| Receipt from other income | 3,272,418 | 0.309% | ||
| Total | 2631894036 | 95.858% | 1,035,701,854 | 97.741% |
| Cash inflows from Investing Activities: | ||||
| sale proceeds from property,plant and equipment | 580150 | 0.021% | 4,210,000 | 0.397% |
| Income from Interest on FDR | 14672562 | 0.534% | ||
| Total | 15252712 | 0.556% | 4,210,000 | 0.397% |
| Cash flow from finnancing activities: | 0.000% | |||
| Short-term Loan | 98474158 | 3.587% | 19,726,857 | 1.862% |
| Lease finance | ||||
| Intercompany | ||||
| Liability for otheres finance | ||||
| Total | 98474158 | 3.587% | 19,726,857 | 1.862% |
| TOTAL INFLOWS | 2,745,620,906 | 100.000% | 1,059,638,711 | 100.000% |
| OUTFLOWS: | ||||
| Outflows from Operating Activities: | ||||
| Payment for cost and expenses | 2297037902 | 83.694% | 847,848,618 | 80.186% |
| income tax paid | 50128223 | 1.826% | 5,864,276 | 0.555% |
| Interest expenses | 50363565 | 1.835% | 32,570,755 | 3.080% |
| Vat Paid | 91,853,571 | 8.687% | ||
| Total | 2397529690 | 87.356% | 978,137,220 | 92.508% |
| Outflows from Investing Activities: | ||||
| Purchase of Property,plant and equipment | 46479355 | 1.694% | 21,803,997 | 2.062% |
| Property,plant and equipment in transit | 1299097 | 0.047% | ||
| Investment in share money deposit | 106645806 | 3.886% | 15,000,000 | 1.419% |
| Payment for priliminary expenses | ||||
| Capital Work in progress | ||||
| Total | 154424258 | 5.627% | 36,803,997 | 3.481% |
| Cash Outflows from finnancing activities: | ||||
| Long-term Loan | 19342085 | 0.705% | ||
| Lease finance | ||||
| Liability for otheres finance | ||||
| Short-term Loan | ||||
| Intercompany | 139841729 | 5.095% | ||
| Repayment of Secured Loan and Interest | 9,245,922 | 0.874% | ||
| Dividend paid | 33417270 | 1.218% | 33,171,341 | 3.137% |
| Total | 192601084 | 7.018% | 42,417,263 | 4.012% |
| TOTAL OUTFLOWS | 2744555032 | 100.000% | 1,057,358,480 | 100.000% |
| Net cash flow from operating/financing and investing activities | 1,065,874 | 2,280,231 | ||
| Opening Balance | 9289860 | 6,902,127 | ||
| Closing Balance | 10355734 | 9,182,358 | ||
Olympic and Navana Batteries Limited
Particulars | Olympic Batteries Ltd. 2010 | Percentage (%) | Navana Batteries Ltd. 2010 | Percentage (%) |
| INFLOWS | ||||
| Cash flow from operating Activities: | ||||
| Cash receipt from customers and other income | 249,112,427 | 97.169% | 510,315,177 | 72.549% |
| Receipt from other income | ||||
| Total | 249,112,427 | 97.169% | 510,315,177 | 72.549% |
| Cash flow from Investing activities: | ||||
| Income from Interest on FDR | 763,801 | 0.298% | ||
| Total | 763,801 | 0.298% | ||
| Cash flow from financing activities: | ||||
| Short-term Loan | 5,973,649 | 2.330% | 11,918,950 | 1.694% |
| Lease finance | ||||
| Intercompany | 139841729 | 181,173,288 | 25.757% | |
| Liability for otheres finance | 521,481 | 0.203% | ||
| Total | 6,495,130 | 2.533% | 193,092,238 | 27.451% |
| TOTAL INFLOWS | 256,371,358 | 100.000% | 703,407,415 | 100.000% |
| OUTFLOWS: | ||||
| Cash flow from operating Activities: | ||||
| Payment for cost and expenses | 208,635,932 | 87.807% | 420,451,440 | 61.530% |
| income tax paid | 5,159,377 | 2.171% | 8,572,887 | 1.255% |
| Interest expenses | 3,817,742 | 1.607% | 15,381,235 | 2.251% |
| Vat Paid | ||||
| Total | 217,613,051 | 91.585% | 444,405,562 | 65.035% |
| Cash flow from Investing activities: | ||||
| Purchase of Property,plant and equipment | 17,477,407 | 7.356% | 24,363,095 | 3.565% |
| Capital Work in progress | 214,369,352 | 31.371% | ||
| Total | 17,477,407 | 7.356% | 238,923,012 | 34.965% |
| Cash flow from financing activities: | ||||
| Long-term Loan | ||||
| Lease finance | 684,784 | 0.288% | ||
| Liability for otheres finance | ||||
| Short-term Loan | ||||
| Intercompany | ||||
| Dividend paid | 1,832,379 | 0.771% | ||
| Total | 2,517,163 | 1.059% | ||
| TOTAL OUTFLOWS | 237,607,621 | 100.000% | 683,328,574 | 100.000% |
| Net cash flow from operating/financing and investing activities | 18,763,737 | 20,078,841 | ||
| Opening Balance | 16,093,043 | 7,348,118 | ||
| Closing Balance | 34,856,780 | 27,426,959 | ||

 Items to be discussed:
Ratio Analysis:
Liquidity Ratios: Short-Term Solvency
- The short term paying ability of the enterprise to pay its maturing obligations and to meet unexpected needs for cash. Trade-off between liquidity (risk) and profitability:Higher ratio : lower current liabilities, less costly than long-term financing (lower risk)Higher ratio :larger current assets, less profitable than fixed assets (lower return
- Current Ratio:The current ratio is a commonly used measure of short-run solvency, the ability of a firm to meet its debt requirements as they come due. Current liabilities are used as the denominator of the ratio because they are considered to represent the most urgent debts, requiring retirement within one year or one operating cycle. The available cash resources to satisfy these obligations must come primarily from cash or the conversion to cash of other current assets.
Ratio
Method of Computation
Industry average
Current Ratio:
Current Assets
Current Liabilities
(1.03923421+1.026399+1.224645
+ 0.70602435)/4
= 0.99908
Comparison of Four companies:
Ratio | Rahimafrooz Batteries Ltd | Quasem Drycell Ltd | Olympic Industries Ltd. | Navana Batteries Ltd. |
Current Ratio:
1,190,640,768
376,550,056
79,733,182
245,378,852
1,145,690,506
= 1.03923
366,864,899
= 1.02639
65,107,177
= 1.22464
347,550,126
= 0.70602
Comment:
Current ratio for Rahimafrooz Batteries Limited indicates that at year-end 2010 current assets covered current liabilities 1.03923 times compared to Quasem Drycell Limited (1.02639 times), Olympic Industries Limited(1.22464 times) and Navana Batteries Limited (0.70602 times). For each taka the firm owes (short-term liabilities), the firm has Tk. 1.03923 in its asset.It is also more compared to the industry average 0.99908.So, the company is highly liquid.
Accounts receivable and inventory may not be truly liquid. A firm could have a relatively high current ratio but not be able to meet demands for cash because the accounts receivable are of inferior quality or the inventory is salable only at discounted prices. It is necessary to use other measures of liquidity, including cash flow from operations and other financial ratios that rate the liquidity of specific assets, to supplement the current ratio.
- 2. Acid test ratio:The quick or acid-test ratio is a more rigorous test of short-run solvency than the current ratio because the numerator eliminates inventory, prepaid expenses considered the least liquid current asset and the most likely source of losses. Like the current ratio and other ratios, there are alternative ways to calculate the quick ratio. Some analysts eliminate prepaid expenses and supplies (if carried as a separate item) from the numerator.
Ratio
Method of Computation
Industry average
Acid test ratio:
Current Assets-Inventory-Prepaid expenses
Current liabilities – Bank Overdraft
(0.35215+0.179786+0.556176
+0.294811)/4
= 0.345732847
Comparison of Four companies:
Name of the companies | Calculation | Calculation | Result |
| Rahimafrooz |
Batteries Ltd
1,190,640,768-470966115-325989928
1145690506-27764361
393,684,725
1,117,926,145
= 0.3521562
Quasem Drycell Ltd
376,550,056-221,552,994-89,039,555
366,864,899
65957507
366,864,899
= 0.1797869
Olympic Industries Ltd.
79733182-24512371-19009701
65,107,177
36211110
65,107,177
= 0.5561769
Navana Batteries Ltd.
245,378,852-111,150,844-31,766,320
347,550,126
36211110
347,550,126
= 0.2948112
Comment:
The quick ratio for Rahimafrooz Batteries Limited indicates 0.35215 times compared to Quasem Drycell Ltd. holds 0.17978 times,Navana Batteries Limited holds 0.294811 times .But Olympic Industries Limited has 0.55617 times greater than Rahimafrooz Batteries Limited. Rahimafrooz Batteries Limited has also more times compared to the industry average 0. 34573 times .So, the company is highly liquid.
3. Net Working Capital Ratio:
Ratio | Method of Computation | Industry average |
| Net Working Capital Ratio | Current Assets – Current Liabilities Total Assets | (0.02433+0.010932-0.1073930 |
-0.024331)/4
= -0.0078028
Comparison of Four companies:
Name of the companies | Calculation | Calculation | Result |
| Rahimafrooz |
Batteries Ltd
1190640768-1145690506
1,847,445,449
44,950,262
1,847,445,449
= 0.0243310
Quasem Drycell Ltd
376550056-366864899
885904358
9,685,157
885904358
= 0.0109325
Olympic Industries Ltd.
79733182-65107177
136,191,376
14626005
136,191,376
= -0.1073930
Navana Batteries Ltd.
1190640768-1145690506
1,847,445,449
44,950,262
1,847,445,449
= -0.0243310
Comment:
Rahimafrooz Batteries Limited has the highest net working capital ratio (0.0243310 times) compared to Quasem Drycell Limited (0.0109325 times), Olympic Industries Limited (-0.1073930) and Navana Batteries Limited (-0.0243310).The company also has more Net Working Capital Ratio times compared to the industry average -0.0078028. So, having enough working capital with respect to total assets, the company’s performance and the liquidity position is good.
3. Cash Flow Liquidity Ratio:
For measuring short-term solvency is the cash flow liquidity ratio which considers cash flow from operating activities (from the statement of cash flows).The cash flow liquidity ratio uses in the numerator, as an approximation of cash resources, cash and marketable securities, which are truly liquid current assets, and cash flow from operating activities, which represents the amount of cash generated from the firm’s operations, such as the ability to sell inventory and collect the cash.
Ratio | Method of Computation | Industry average |
Cash Flow Liquidity Ratio | Cash and Cash Equivalents+CFO[1] Current Liabilities | (0.009038+0.025029+0.535375 |
+0.07891)/4
= 0.1620897
Comparison of Four companies:
Ratio | Rahimafrooz Batteries Ltd. | Quasem Drycell Ltd. | Olympic Industries Ltd. | Navana Batteries Ltd. |
| Cash Ratio: | 10355735+234364346 1,145,690,506 = 0.213600514 | 9182358+57564634 366864899 = 0.181938889 | 34856781+31499376 65,107,177 = 1.019183446 | 27426959+65909615 347,550,126 = 0.268555719 |
Some are parts:
Financial Statement Analysis of Rahimafrooz Batteries Limited (Part 1)
Financial Statement Analysis of Rahimafrooz Batteries Limited (Part 2)
Financial Statement Analysis of Rahimafrooz Batteries Limited (Part 3)


