5) To analyze the Data on the basis of the steps of financial statement analysis.
6) To recommend how to develop the quality of financial reporting and guide Rahimafrooz Batteries limited to focus on poor line items of the financial statements to increase revenue, profit and market share and to decrease total cost.
Sources of Data:
The report is mainly based on quantitative data. The sources of collecting data are as follows:
Primary Sources:
Internet
Secondary Sources:
The annual report of 2010 of Rahimafrooz Batteries Limited,
The annual report of 2010 Quasem Drycell Limited
The annual report of 2010 Navana Batteries Limited
Methodology:
For the purpose of the study the methods of techniques used:
Using available information
Using available information:
It is inexpensive. But the annual report of Rahimafrooz Batteries not negotiable. So, to collect this copy, I had gone to my friend, who is an employee of this organization and collect this copy. Other three companies are listed. But annual report 2010 of Navana batteries limited collected was not in the market, so to collect that copy I had to go the 125/A, Motijel Commercial Area.
Literature review:
To pinpoint the different directions taken in quantitative ratio based research. By critically considering financial ratio literature, we also aim to help the decision makers to use ratios in an efficient way. (see Foster, 1978, pp. 36-37, and Salmi, Virtanen and Yli-Olli, 1990, pp. 10-11)[1]but here there give no clear practical example to relate these theoretical application. (Jesswein, 2010) explaining the differences between cash and accrual reporting, FASB and IASB presentation differences, and identifies various company ratios based on financial statements from three companies: Toyota, Verizon Communications, and Bed, Bath & Beyond But here no mention of using trend analysis, vertical analysis or using few ratio applications.
Data Analysis:
According to the objectives of the report, I analyzed the factor analysis among the ocean of information and prepared the Analysis of homogeneity (internal consistency), which gives an indication of the reliability of a measurement instrument. The data (each line items/financial statements) selected from the annual report will be analyzed through graphically, horizontal analysis, vertical analysis and ratio analysis. explains the differences between cash and accrual reporting, FASB and IASB presentation differences, and identifies various company ratios based on financial statements from three companies: Toyota, Verizon Communications, and Bed, Bath & Beyond. (Jesswein, 2010)[2]Scope of the report:
To convert the financial statement data into formats that facilitate the evaluation of a firm’s financial condition and performance both over time and in comparison with industry competitors. Rahimafrooz batteries limited is the market leader in the automotive batteries. So, I take other three leading battery manufacturing companies-Quasem Drycell Limited, Olympic Industries limited and Navana Batteries Limited for comparability and performance management.
Limitation of the study:
- As a leading organization, Rahimafrooz all the information regarding accounting treatment and financial information are not disclosed being confidential.
- Due to time constraint and availability of enough information in information regarding the companies, difficult to disclose the detail about the respective companies.
- Some Other leading companies like HAMKO, Rangs, Volvo Batteries; they did not give me their annual report after telling the matter of internship. That’s why I can not show the truth picture of the performance of total automotive battery industry in the Bangladesh.
- The method of data collection is simple but the processing of data is so difficult. So, i tried the most important tools to show the clear scenario of the performance of the four battery companies on the basis of their financial statements.
Chapter # 2
Introduction of Rahimafrooz Group
Items to be discussed:
q Part -1:
- Rahimafrooz Group
q Part-2:
- Rahimafrooz Batteries Limited
- o Quasem Drycells Limited
- Qlymic Industries Limited (Battery Unit)
- Navana Batteries Limited.
PART-1: INTRODUCTION TO RAHIMAFROOZ GROUP
Origin of the Rahimafrooz Group
Late A.C. Abdur Rahim (1915 – 1982) The Founder of Rahimafrooz |
Rahimafrooz Bangladesh Limited was established in 1950A.D. as a trading company. Late A.C. Abdur Rahim was the proprietor in this time. From 1954 it was established as a limited company. In the new environment he had to start afresh. He had little capital. His main assets were self-confidence and a strong faith in the Almighty, which carried him through all the difficulties with a remarkable triumph. He finally established a small proprietary trading company named Rahimafrooz & Co, at Chittagong in 1950 which was later incorporated on 15th April 1954, which is now Rahimafrooz (Bangladesh) Ltd. Rahimafrooz expanded rapidly into various trading items. Within 5 years, Mr. Rahim was able to enter into a joint venture with Lucas (UK) to set up a modern automotive battery factory. He acquired the principal company Lucas Service Ltd in 1980 which is now known as Rahimafrooz Batteries Ltd. Apart from business, he engaged himself in benevolent activities. All through his life he was respected for his values and caring attitude. He passed away on the 14th March 1982 in London leaving behind his dream, Rahimafrooz. After a few years he left that job and ventured into a small partnership business. During early 1940s, he got active in commercial trading of scarce items and gained valuable experience. In 1947, he decided to move to Chittagong to live in an environment of religious freedom. In the new environment he had to start afresh. He had little capital. His main assets were self-confidence and a strong faith in the Almighty, which carried him through all the difficulties with a remarkable triumph. He finally established a small proprietary trading company named Rahimafrooz & Co, at Chittagong in 1950 which was later incorporated on 15th April 1954, which is now Rahimafrooz (Bangladesh) Ltd. Rahimafrooz expanded rapidly into various trading items. Within 5 years, Mr. Rahim was able to enter into a joint venture with Lucas (UK) to set up a modern automotive battery factory. He acquired the principal company Lucas Service Ltd in 1980 which is now known as Rahimafrooz Batteries Ltd. Apart from business, he engaged himself in benevolent activities. Rahimafrooz Bangladesh Limited was started in business agreement with world famous England battery company Lucas from 1959. Later on, they established an ultramodern battery production factory in Nakhalpara Tejgaon, Dhaka with the “Lucas” Brand name. Then from 1980 it got license from the England Lucas Company collaborating technological and information support. At present Rahimafrooz has been producing and marketing various kinds of batteries like automotive battery, storage battery etc. Rahimafrooz Bangladesh Ltd. also has been marketed world famous tire “Dunlop”. Now Rahimafrooz Bangladesh Ltd. is involved with various kinds of production distribution and agency ship business.
“To be leader in each market segment by being the most preferred supply source of quality products and services with high degree of customer delight.”Mission of Rahimafrooz Group:Values of Rahimafrooz Group.SBUs (Strategic Business Units):
of Rahimafrooz Group
- Rahimafrooz (Bangladesh) Ltd. (Group Parent Company)
- Rahimafrooz (Batteries) Ltd.
- Rahimafrooz Distribution Ltd.
- Rahimafrooz Energy Services Ltd.
- Rahimafrooz Renewable Energy Ltd.
- Rahimafrooz CNG Ltd.
- Rahimafrooz Superstores Ltd.
- Excel Resources Ltd.
- Rahimafrooz Globatt Ltd
Organogram of Top Level Management of Rahimafrooz
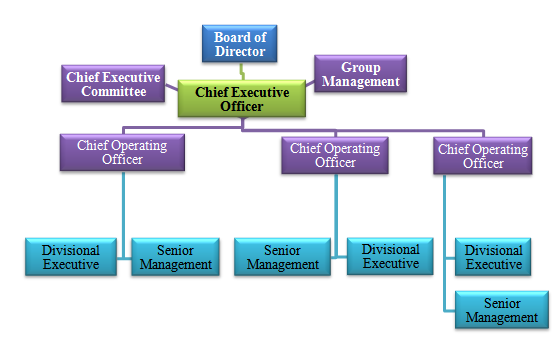
Rahimafrooz (Bangladesh) Limited (RABL) is the Group Holding and Parent Company including the Group Corporate Center that guides the Strategic Business Units (SBUs). It ensures continuous management innovation, technology adoption, new initiatives, corporate governance and compliance. Rahimafrooz Bangladesh Ltd has imported world famous Dunlop Tire and Tube which is producing in Japan and India.At present Rahimafrooz Bangladesh ltd. Is one of the top most organizations in the country many officer and personnel work hard.
From the development of the organization Rahimafrooz Bangladesh ltd. is mainly work in four divisions
- Corporate Division
- Manufacturing Division
- Marketing and sales division
- International division
The chairman is the chief executive officer of the organization and the director is the head of every division.Rahimafrooz Bangladesh ltd. has one head office in Motiheel. Two service offices in Dhaka and Chittagong and one factory in Nakhal Para and other is Savar.
Regional office is operated by regional manager who has controlled all the sales force and also has responsible for his job to the managing director of head office. Every appointed dealer in the sales center of Rahimafrooz Bangladesh ltd. they always get up great training from the company to serve the customer all over the country there are near about 180 dealers of Rahimafrooz Bangladesh ltd. Often the company organize conference for the dealer and they create the opportunity to exchange their value.
Rahimafrooz Battery Ltd.
of Rahimafrooz Group
Rahimafrooz battery ltd has mainly marketed Rahimafrooz battery. At present Rahimafrooz company has been producing and marketing more than one hundred categories battery. Automotive battery and motor cycle battery are produced by Rahimafrooz Company. This is very popular in the market and also high quality.The Company’s manufacturing plants produce a range of products – automotive, motorcycle, and appliance batteries, Industrial (stationary, deep cycle, traction, VRLA batteries, IPS and UPS batteries, and rectifiers. Lucas and Spark are the leading names in the local automotive battery market while Volta, Optus and Delta are gaining equity as International brands.In Bangladesh Rahimafrooz Factory is situated in Nakhal Para. Tejgoan. It is the heist battery production capacity factory. The authority tries their level best but to keep its quality through skill and efficient engineer.
Rahimafrooz distribution ltd.
of Rahimafrooz Group
The company has a huge relation with the market to distribute its products through the network of dealers. It has almost near about 200 dealers, 280 Retailers and 95 Lubricant Dealers across the country for distributing Dunlop tyre, Lucas batteries, Volta batteries, RZ tyre, BP lubricants and Rahimafrooz instant power system.
Rahimafrooz Energy Services Ltd
Rahimafrooz Energy Services Limited was established in the year 2000 as a standby, captive and distributed power solution provider. It is a leading name in the diesel generator industry having a customer base of nearly 700. Its clientele comprise of industrial plants, real estates, hospitals, educational institutions, telecoms, supermarkets, corporate houses and government establishments including the Armed Forces. The company is marketing both diesel and gas generators from Pramac Power Engineering, Italy and Spain, and Mitsubishi Heavy Industries Limited, Japan. Rahimafrooz Energy is also providing Rental Power with both diesel and gas generators. Rahimafrooz Energy is the Authorized Distributor of GE Consumer & Industrial Lighting, USA and Exclusive Distributor of Wiring Accessories and Low Voltage Protection Devices from Hager, France in Bangladesh. Located at the heart of Tejgaon Industrial Area, Dhaka Rahimafrooz Energy is equipped with the necessary service facilities and ready availability of stocks for all kinds of organizations and individuals requiring energy related solutions.
Transforming the lives of people and lighting up different corners of the country, Rahimafrooz Renewable Energy Ltd. (RRE) has been providing Rahimafrooz Solar solutions for households, agriculture, healthcare, education, rural streets and marketplaces. To date, RRE has lightened up more than 40,000 rural homes in Bangladesh and the Company is endeavoring to do much more in the future.
The abundance, inexhaustibility and non polluting nature of solar energy, have made it right alternative for conventional energy sources, which are getting fast exhausted. So far only a small portion of solar energy is being harnessed for use in solar water heating, solar lighting, telecommunications, medical refrigeration and solar water pumping. Working closely with Bangladesh Government’s agencies, NGOs, donor and partner organisations, and international agencies, RRE offers a full rage of solar solutions including home lighting, street lighting, heating systems, water pumps, Photo Voltaic (PV) centralised systems, drip irrigation systems, vaccine refrigeration, support for computer and other electronic systems, and a number of other solutions. More than 60,000 homes already been illuminated with RRE’s solar efforts and the number is always growing.
Rahimafrooz CNG Ltd
Rahimafrooz CNG Ltd. (RACNG) offers comprehensive solutions for CNG refueling, conversion, conversion centres, and maintenance. The Company runs state-of-the-art CNG conversion centres offering 1st to 5th generation conversion, and is setting up a wide country-wide network of refueling stations. It also assists, through equipments, technological know-how, training and marketing, in setting up CNG conversion centres and refueling stations.
Rahimafrooz Superstores Ltd
Rahimafrooz Superstores Ltd. (RSL) made a breakthrough in the urban lifestyles by launching the first retail chain in the country – Agora. With outlets in important locations in Dhaka, and many more coming at key locations in Dhaka and other major cities, Agora is endeavoring to fulfill the everyday needs of the urbanites through fair price, right assortment, and best quality.While Agora mainly focuses on food items – ranging from a wide variety of fish, meat, vegetables, fruits, bakery, dairy, and grocery – it also carries a vast array of other household, grocery, personal care, and various other products. Having started its journey in 2001, Agora is committed to sustaining and growing as the most trusted, loved, and frequented retail chain.
Excel Resources Ltd
Excel Resources Ltd. (ERL) is a leading name for tyre retread. ERL also manufactures and markets emery cloths and abrasive papers.Retread of tyre is a process whereby new tread rubber is applied on a used tyre casing; if done properly, this process allows similar mileage like new tyres. The process extends longer casing life. Based on the casing, a tyre can be retread up to 3 or 4 times, as long as the casing supports. The retread process is eco-friendly and does not result in environmental pollution. A retread tyre can save up to 50% of new tyre’s cost.
Operations
- Super Abrasives Limited
Producer of quality ‘emery cloth’ used for machinery maintenance
- Greyfab Limited
Grey Fab and Asia Tex are two ventures that manufacture and export textile and terry towels.
- Excel Retreads Limited(ERL)
Tyre retreading operation for commercial vehicle One of the leading tyre retread centre. It retreads all types of tyre from cars to buses and trucks.
- Metronet BD Limited
Metronet Bangladesh limited has established the first ever fiber optic networking backbone on commercial basis in Bangladesh. Presently this backbone is providing data communication facilities in Dhaka metropolitan Areas.
Customers of Rahimafrooz:
Rahimafrooz has their customers all over Bangladesh. As they have products like batteries, generators, IPS, UPS, CNG, solar both the corporations and households are getting benefits from Rahimafrooz. Starting from farmers, different multinational companies and telecommunication companies are the loyal customers of Rahimafrooz. in addition it can be said that some SBUs of Rahimafrooz are their own customers such as Rahimafrooz distribution limited is the customer of Rahimafrooz battery limited and RRE and RESL are the customer of RDL.
Distribution network:
Different products of Rahimafrooz have been distributed through different sectors. They have their own distribution centers and also direct retailers. Such as, the automotive batteries and industrial batteries from RBL are sold locally by RDL. And they export it by their own. RDL has institutional selling centers in Mohakhali, Motijhill, and Uttora in Dhaka districts, and also in Chittagong, Bogra, Sylhet, and Jessor. Automotive batteries are also locally sold with the help of direct retailers. On the other hand, IPS is sold by RDL. Solar are distributed by RRE and RBL. Tyre and lubricant are sold through RDL.
Competitors of Rahimafrooz:
Some years back, Rahimafrooz was running monopoly business. But now days there are many other businesses competing in the market like Navana and Hamco are two competitors in the Battery market. There is very high competition with Navana, Intraco, Southern and Shohag CNG conversion. For CNG refueling station there are Navana, Intraco, IMW, Getco, Prident as competitor. On the other hand, Rangs stands as the competitor of IPS.
Brand Names:
Automotive, appliance, motorcycle battery
Automotive tyre of all categories
Superstore with 25,000 varieties of products
Heavy duty truck/bus tyre
Instant power system for main power grid failure
Power back-up for computer and other electronics
Comprehensive computerized automobile service
Industrial battery & maintenance free automobile battery
Complete solution of CNG systems
Solar power systems
Diesel Generators
Tyre retread for bus, truck and cars
Awards of Rahimafrooz:
| Enterprise of the year 2000. | |
| Mr. Feroz Rahim is seen receiving National Export Trophy (Silver), 2001-02 from Mr. Amir Khosru Mahmud Chowdhury, Honorable Minister (former)-Ministry of Commerce at a program held on 20 December 2003. It reflects their commitment to expand global market, diversity export product portfolio and earn foreign currency for the country. | |
| Rahimafrooz Electric Vehicle was awarded second prize among other environment friendly products in the “Environment Day Fair 2002”. |
Rahimafrooz Batteries Limited:
|
PART-2: Introduction to Rahimafrooz Batteries Limited
Rahimafrooz Batteries Ltd. (RBL) is the largest lead-acid battery manufacturer in Bangladesh. The Company, with its market leadership at home and export endeavors to more than 30 countries, is among the leading regional players. RBL manufactures around 300 different types of automotive, VRLA, and customized industrial batteries. The Company’s operations are certified in both ISO 9001 as well as ISO 14001 standards.
The Company’s manufacturing plants produce a range of products – automotive, motorcycle, and appliance batteries, Industrial (stationary, deep cycle, traction, VRLA) batteries, IPS and UPS batteries, and rectifiers. Lucas and Spark are the leading names in the local automotive battery market while Volta, Optus and Delta are gaining equity as International brands.
History of RBL:
Rahimafrooz Batteries Ltd. began battery manufacturing in 1959 with the collaboration of Lucas Battery Company, U.K. It is the largest lead-acid battery manufacturer In Bangladesh and offers the most extensive range of automotive batteries for the country’s transport sector
In 1980, the company has acquired Lucas Services (BD) Ltd. and has renamed it as Rahimafrooz Batteries Ltd. Within a few years it has introduced “Dry Charged” plastic case battery and established exclusive nationwide distributorship for automotive aftermarket. It has started assembling and marketing of industrial batteries from 1986 and has completed acquisition of plant and technology of industrial battery manufacturing from Electrona, Switzerland in 1991. It has made a manufacturing agreement with Chloride group, UK. It has started its first export of battery to Singapore. It has expanded the export to Middle East, Nepal, Bhutan, Sri Lanka, Myanmar and Pakistan by acquiring the Yuasa Battery (Bangladesh) Ltd in 1994. In 1996
Plant Capacity: Rahimafrooz has state of the art manufacturing plants. It is equipped with all latest technologies with complete air treatment and lead-recycling management. RBL produces different types of batteries to meet the local and international market.Its capacity in Automotive Battery is 660,000 (N50) units per annum and Industrial Battery is 41 million AH/annum. By the end of 2010, these will increase to 8000,000 (N50) and 120 Million AH respectively. All the products are manufactured following strict quality and environmental standards, and are ensured by international certifications too.
Product diversification of RBL
Quasem Drycells Limited:
Quasem Group is one of the leading Industrial and Trading houses in Bangladesh. The trading company diversified its business activities to jute, coal, cement etc. In the mid-sixties it was one of the largest balers and exporters of raw jute in the country. The group started its business with the establishment of a Trading Company in 1950.It was established in 1981. It produces both Ammonium Chloride and Zink Chloride battery of UM-1 (R-20) & UM-3 (R-6) sizes. The Company meets about 40% of the local demand[1]
Quasem Drycells Limited is the largest dry cell manufacturing & first ISO certified company in Bangladesh of its kind. The journey started in June 14, 1980 , where the company brought a new era of modern battery manufacturing technology in Bangladesh . And now it’s representing as a pioneer company in terms of Dry Cell Manufacturing, where it has successfully established its ‘SUNLITE’ brand as a leader in the dry cell Industry. Quasem Drycells Limited (QDL) is a public limited company and is listed in the Dhaka Stock Exchange (DSE) and the Chittagong Stock Exchange (CSE), and both these exchanges have ranked QDL as a blue chip company by qualifying for the DSE top 20 and the CSE top 30 list in the year 2002.
Olympic Industries Limited
QDL has established itself as a producer of quality batteries and this image is reflected in the price premium enjoyed by its brand, SUNLITE. The sponsors of QDL have continually upgraded the dry-cell production plant and have invested in developing capacity for the company with a vision to be a leading industrial enterprise in Bangladesh . [2] Olympic Industries Limited, is one of the longest running and most reputed manufacturing-based companies in Bangladesh, with a heritage of over 50 years and group profile including interests in Pharmaceuticals, Power, and Information Technology, among other FMCG. Starting with steel production dating back to 1950, Olympic has steadily diversified over the years into various consumer goods including biscuits, confectioneries, batteries, and ball pens, with over 40 brands and 53 SKU’s. The company has gotten to where it is today by staying true to its core beliefs, in providing high quality, innovative products which its consumers can rely on.[3]Navana Batteries Limited
Aftab automobiles ltd. Introduced a battery manufacturing unit, concern of navana group in january 2002, and manufacturing different type of automotive batteries (from small car to big lorries) and marketing the same in the country. The company also manufactures batteries for instant power supply (I.P.S.). Soon the company will go for industrial, motorcycle and ups batteries. The company plans to export its product abroad very shortly.
Our motto is, ‘we give you the quality, quality gives you the guarantee’ and that is, “because we care for you” and for which we offer our customers a very special personalized after sales-service with absolute and non-compromising quality with confidence.[4]
Market Position of Rahimafrooz Batteries Limited
Questionnaire and Interpretation:
1. Types of batteries that are available in the market for using in the car:
To understand the market scenario and to know the market competitors it was asked to the respondents about the present market competitors. And it is clear that the present market of batteries is comprised of LUCAS, VOLVO, OLYMPIC, NAVANA, RANGS, QUASEM, EASTURN BATTERIS, etc.
2.Percentage of car that is driven by Lucas /Globatt battery:
According to the survey, among 30 respondents 24 respondents that means 80% believes that there are about 80% of the total car users uses Lucas battery.
Moreover, according to the survey Navana battery is used by 8% and 5% car users are using Volvo battery. Other batteries like Hamko etc hold the remaining 7% market share.
[1] http://www.bangla2000.com/BusinessWorld/Company_Profile/Quasem/Quasem_Group.shtm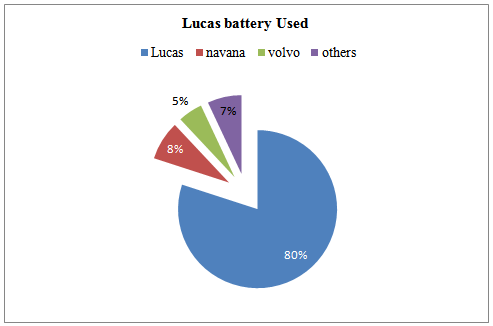
Increasing or decreasing the market share of Lucas Battery:
In the query of increasing or decreasing of market share of Lucas Battery it is found that the market share of LUCAS BATTERY is decreasing proportionately with the emerging of new competitors in the market like HAMKO, NAVANA, and VOLVO etc and for some other major reasons.
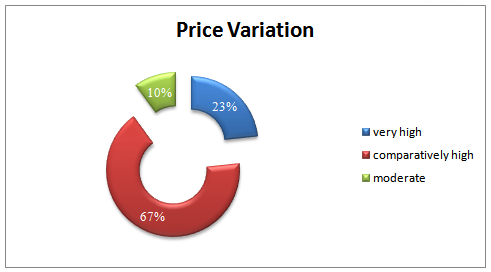
3. Price of Lucas Battery compared to the competitors:
The survey was conducted to observe the price of lucas battery. And it is found from the survey that 23% respondents believe that the price is very high.
On the other hand, a major part that is 67 percent of respondents believe that the price is competitive and it does not any matter to them if quality is sound. But if the question of quality comes to the customers about Lucas only then they will search for alternative best but till these respondents believe that Lucas is the only leading brand.
4. Suggestions from respondents to sustain market position of Lucas Battery:
During the survey it was asked that how the Lucas Battery can sustain its position and all the respondents answered in one word that it should get back the previous quality that was offered in early year.
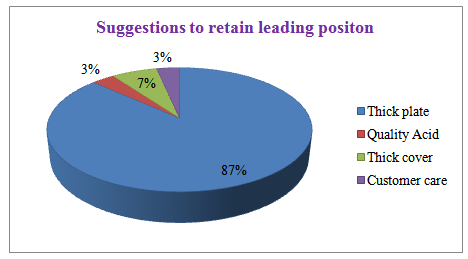
More distinctively about 87 percents of the respondents insisted to improve the quality of the lead plate that is used inside the battery. They argued that only for the fault of this plate the Lucas battery goes out of order during 11/12/13 months of using.
Moreover 7 percent argued to improve the casing of battery, 3 percent claimed to improve customer care and 3 percent claimed to improve the quality of acid used in batteries.
Chapter #3 Why do We analyze Financial Statements? |
Items to be discussed:
Page No.
- Why Financial Statement Analysis is needed? 24-25
- Techniques and tools of financial statement Analysis 26-33
Indicating the trend of Achievements
Financial statements of the previous years can be compared and the trend regarding various expenses, purchases, sales, gross profits and net profit etc. can be ascertained. Value of assets and liabilities can be compared and the future prospects of the business can be envisaged.
Assessing the growth potential of the businessThe trend and other analysis of the business provides sufficient information indicating the growth potential of the business.
Comparative position in relation to other firms
The purpose of financial statements analysis is to help the management to make a comparative study of the profitability of various firms engaged in similar businesses. Such comparison also helps the
management to study the position of their firm in respect of sales,
expenses, profitability and utilising capital, etc.
Assess overall financial strength
The purpose of financial analysis is to assess the financial strength of the business. Analysis also helps in taking decisions, whether funds required for the purchase of new machines and equipments are provided from internal sources of the business or not if yes, how much? And also to assess how much funds have been received from external sources.
Assess solvency of the firmThe different tools of an analysis tell us whether the firm has sufficient funds to meet its short term and long term liabilities or not.
Parties Interested
Analysis of financial statements has become very significant due to widespread interest of various parties in the financial results of a business unit. The various parties interested in the analysis of financial statements are :
(i) Investors : Shareholders or proprietors of the business are interested in the well being of the business. They like to know the earning capacity of the business and its prospects of future growth.
(ii) Management : The management is interested in the financial position and performance of the enterprise as a whole and of its various divisions. It helps them in preparing budgets and assessing the performance of various departmental heads.
(iii) Trade unions : They are interested in financial statements for negotiating the wages or salaries or bonus agreement with the management.
(iv) Lenders : Lenders to the business like debenture holders, suppliers of loans and lease are interested to know short term as well as long term solvency position of the entity.
(v) Suppliers and trade creditors : The suppliers and other creditors are interested to know about the solvency of the business i.e. the ability of the company to meet the debts as and when they fall due.
(vi) Others: Tax authorities,Researchers,Employees,Government and their agencies,stock exchange etc
Techniques and tools of financial statement Analysis
Financial statements give complete information about assets, liabilities, equity, reserves, expenses and profit and loss of an enterprise. They are not readily understandable to interested parties like creditors, shareholders, investors etc. Thus, various techniques are employed for analyzing and interpreting the financial statements. Techniques of analysis of financial statements are mainly classified into three categories:
(i) Cross-sectional analysis:
It is also known as inter firm comparison. This analysis helps in analysing financial characteristics of an enterprise with financial characteristics of another similar enterprise in that accounting period. For example, if company A has earned 15% profit on capital invested. This does not say whether it is adequate or not. If we analyze further and find that a similar company has earned 16% during the same period, then only we can make a conclusion that company B is better. Thus, it turns into a meaningful analysis.
(ii) Time series analysis:
It is also called as intra-firm comparison. According to this method, the relationship between different items of financial statement is established, comparisons are made and results obtained. The basis of comparison may be
Comparison of the financial statements of different years of the same business unit.
Comparison of financial statement of a particular year of different business units.
(iii) Cross-sectional cum time series analysis
This analysis is intended to compare the financial characteristics of two or more enterprises for a defined accounting period. It is possible to extend such a comparison over the year. This approach is most effective in analysing of financial statements. The analysis and interpretation of financial statements is used to determine the financial positon. A number of tools or methods or devices are used to study the relationship between financial statements.
However, the following are the important tools which are commonly used for analyzing and interpreting financial statements:
Comparative financial statements
Common size statements
Trend analysis
Ratio analysis
Equity analysis
Cash flow analysis
1.Comparative financial statements
In brief, comparative study of financial statements is the comparison of the financial statements of the business with the previous year’s financial statements. It enables identification of weakpoints and applying corrective measures. Practically, two financial statements (balance sheet and income statement) are prepared in comparative form for analysis purposes.Using Horizontal [1], Trend analysis[2], Vertical Analysis (Unlike horizontal or trend analysis, vertical analysis can be done on the financial results for a single year. In this method each item or group of items reported in the statement is converted into a percentage of a specific item on the same statement (eg sales or owners equity)., [3]I will depict the total picture.
Comparative Balance Sheet
The comparative balance sheet shows the different assets and liabilities of the firm on different dates to make comparison of balances from one date to another. The comparative balance sheet has two columns for the data of original balance sheets. A third column is used to show change (increase/decrease) in figures. The fourth column may be added for giving percentages of increase or decrease. While interpreting comparative Balance sheet the interpreter is expected to study the following aspects :
(i) Current financial position and Liquidity position
(ii) Long-term financial position
(iii) Profitability of the concern
(i) For studying current financial position or liquidity position of a concern one should examine the working capital in both the years. Working capital is the excess of current assets over current liabilities.
(ii) For studying the long-term financial position of the concern, one should examine the changes in fixed assets, long-term liabilities and capital.
(iii) The next aspect to be studied in a comparative balance sheet is the profitability of the concern. The study of increase or decrease in profit will help the interpreter to observe whether the profitability has improved or not.
After studying various assets and liabilities, an opinion should be formed about the financial position of the concern.
B. Comparative Income statement
The income statement provides the results of the operations of a business.This statement traditionally is known as trading and profit and loss A/c. Important components of income statement are net sales, cost of goods sold, selling expenses, office expenses etc. The figures of the above components are matched with their corresponding figures of previous years individually and changes are noted. The comparative income statement gives an idea of the progress of a business over a period of time. The changes in money value and percentage can be determined to analyse the profitability of the business. Like comparative balance sheet, income statement also has four columns. The first two columns are shown figures of various items for two years. Third and fourth columns are used to show increase or decrease in figures in absolute amount and percentages respectively.
The analysis and interpretation of income statement will involve the following:
The increase or decrease in sales should be compared with the increase or decrease in cost of goods sold.
To study the operating profits
The increase or decrease in net profit is calculated that will give an idea about the overall profitability of the concern.
3. Common Size Statements:
The common size statements (Balance Sheet and Income Statement) are shown in analytical percentages. The figures of these statements are shown as percentages of total assets, total liabilities and total sales respectively. Take the example of Balance Sheet. The total assets are taken as 100 and different assets are expressed as a percentage of the total. Similarly, various liabilities are taken as a part of total liabilities.
Common size balance sheet
A statement where balance sheet items are expressed in the ratio of each asset to total assets and the ratio of each liability is expressed in the ratio of total liabilities is called common size balance sheet.
Common size income statement
The items in income statement can be shown as percentages of sales to show the relations of each item to sales
3. Ratio Analysis:
Many types of ratios can be calculated from financial statement data. However, it is common practice to group ratios into five basic categories:
Liquidity ratios
Asset-management ratios
Financial-leverage ratios
Profitability ratios
Market-value ratios
Liquidity ratios
Liquidity ratios indicate the company’ ability to meet its maturing obligations and are generally of most importance to creditors and lenders. There are many sources of liquidity for a company other than current assets. These include funds from operations and short term borrowing arrangements.
Current ratio
The current ratio is a measure of a company’s ability to meet current liabilities with current assets.
There is really no proper level for this ratio and, in fact, excess liquidity may be a very inefficient use of the company’s limited cash resources. Appropriate levels of this ratio will vary widely from industry to industry.
Calculation of the ratio is: (Current assets/Current liabilities)
Quick or acid test ratio
The key difference between the current ratio and the quick ratio is the removal of inventories as well as any prepaid assets from the current assets. The rationale for removing these items in the calculations of the quick ratio is that they are traditionally the least liquid of the current assets. This ratio, therefore, provides an indication of the company’s ability to meet its current obligations (liabilities) using only the most liquid of the current assets.
Calculation of the ratio is: (Cash+Marketable Securities+Accounts Receivables /Current liabilities
Asset management ratios
Asset management ratios measure how effectively a company uses its assets and are often called turnover or utilisation ratios. For turnover ratios, the higher the turnover, the higher the level of sales the company is able to support with a given level of assets. For average collection period ratios, the lower this measure is, the faster the company is able to turn sales into collections and therefore useable cash.
The ratios include:
1. Inventory turnover.
2. Average collection period.
3. Fixed assets turnover.
4. Total asset turnover.
Inventory turnover
The idea behind inventory turnover is to determine how quickly the company uses its inventory to generate sales. As an example, an inventory turnover of 3.0 would indicate that a company turns over its inventory three times a year, or approximately every four months. High inventory turnover indicates high usage while low inventory turnover indicates low usage. Inventory can be related to the required investment to finance the inventory. Firms with low turnover generally require additional capital in order to finance their inventory levels. The general idea is to find the turnover
ratio that is optimal for the company.
Calculation of this ratio is: (annualised cost of goods sold /end period of inventor)
Average collection period
The purpose of this ratio is to measure the time it takes (in days) to collect an average credit sale. The average collection period is generally driven by a company’s stated credit period, but may extend significantly beyond that period if the quality of receivables is not properly monitored. As the average collection period increases, so does the investment in accounts receivable and the associated capital requirements and the need for increased borrowing, and hence interest expense (and interest risk). The proper comparison as to whether a ratio is good or bad is against industry averages. A low average collection period indicates aggressive collection of accounts receivable and can be interpreted positively. A low average collection period, however, may indicate a very tight credit policy on behalf of the company, which could mean that possible sales may be lost as marginal (but
ultimately creditworthy) customers are being turned away. The average collection period is of critical interest to cash managers because it provides an indication of the length of time a company must wait for collection of sales proceeds. It represents the major portion of a company’s cash flow time-line.
Calculation of this ratio is: year-end accounts receivable (average revenue/365)
Fixed assets turnover
The purpose of this ratio is to measure the earning power of the company, especially in relation to other companies in the same industry. The higher the figure, the faster the company is turning over its fixed assets and making more efficient use of its fixed asset base. The fixed asset turnover figure can be thought of as a measure of a company’s operating leverage, or ‘‘yield’’ as a measurement of dollar sales per dollar fixed assets. A company’s analyst should have a target or optimal level for this ratio. The proper level of the ratio will be significantly affected by the industry in which it belongs.
Companies in industries with high levels of capital intensity (heavy machinery) will have much lower fixed asset turnover than those industries with low levels of fixed asset investment (services industries). The ratio that analysts should take care to compare the company with is with other companies in the same industry or with appropriate industry averages.
Calculation of this ratio is: (revenues/net fixed assets)
Total asset turnover
The purpose of this ratio is to measure the efficiency with which the company uses its total asset base in generating revenues. The proper level for this ratio is affected significantly by the industry to which it belongs. For both the fixed assets turnover and the total assets turnover, the real measure is the level of revenues/sales supported by a given level of assets.
Calculation of this ratio is: (revenues/total assets)
Debt management ratios
Debt management ratios monitor the use of debt (leverage) by the company, either by determining the ratio of debt levels to asset levels or by analysing the ratio of various indicators of profitability to debt service. Like liquidity ratios, they are of great interest to creditors in analysing the financial health of the company. Debt management ratios include:
- total debt to total assets;
- times interest earned; and
- debt to equity ratio (leverage)
Total debt to total assets
This ratio is a measure of the relative importance of total debt in the capital structure and is used as a general measure of the creditworthiness and financial risk of the company. The ratio is sometimes referred to as the gearing ratio.
Calculation of this ratio is: (total debt/total assets)
Times interest earned (TIE)
This ratio is an indicator of how many times earnings before interest and tax (EBIT) could decline before the company is unable to meet or cover its interest obligations. A TIE figure of 4.0 means that the company’s EBIT could decline by as much as four times before the company would be unable to cover its interest charges.The ratio is similar to some of the coverage ratios discussed later because it uses a measure of income (or earnings) to determine the ability of the company to meet some fixed obligations.
Calculation of this ratio is: (EBIT/ interest charges)
Debt to equity ratio
The relative importance of debt to the capital structure is shown by this ratio and it is compared over time for the same company and for similar companies. The ratio can be defined in two ways. Some analysts calculate it as total debt (current liabilities plus long term debt) divided by equity, while
others feel that only long term debt should be compared to equity. Deciding what ratio to use depends on the company and the industry convention for ratios. Companies that use a significant amount of short-term debt on a regular basis (for permanent finance) should usually use total debt in the ratio. Companies that use a small amount of short-term debt, or use it only on a seasonal basis, should generally use long-term debt.
Calculation of this ratio is: (Debt (total debt or long-term debt)/Total equity)
Profitability ratios
Profitability ratios show the combined effect of liquidity and asset and debt management on operating ratios .Liquidity does not just happen. Liquidity management is the essence of working capital
management, and it is obvious that high levels of liquidity are not necessarily the desired goal of financial managers, though some desired level of liquidity is important.
This addresses the viability/solvency issue.
Profit margin on sales
This ratio determines the ratio of net profit after tax (NPAT) divided by sales, and is a measure of the general profitability of the company. There are several profit margin ratios, the most popular being gross profit margin, which is calculated, as sales minus variable costs of goods sold divided by sales. This ratio provides a measure of the general operating profitability of the company.
Calculation of this ratio is: (NPAT /Sales)
Basic earning power
This ratio shows the earning power on total assets and is sometimes calculated on total tangible assets to show the operating profit rate of return. Another way to look at this ratio is as a measure of pre-tax
profitability of the company’s assets, or as a measure of the ability of assets to generate profits. This is a useful measure of comparison between different companies because it does not include the impact of taxes or debt structure (leverage), which may vary greatly from company to company.
Calculation of this ratio is: (EBIT total assets)
Return on total assets (ROA):
The return on assets after tax shows the net operating rate of return. Both the ROA and basic earnings power calculations provide an indication of the company’s efficiency of operations, as well as the ability of the company’s asset base to generate profits. In the case of ROA, the ability of the assets to generate after tax profits are measured, thus reflecting the impact of both taxes and the use of debt (leverage).
The term net income could refer to net profit after taxes (NPAT) or could be a more restrictive measure, such as earnings available to shareholders. The ratio analyst must have a clear definition of all components of the formulae in determining them.
Calculation of this ratio is: (net income/total assets)
Return on equity (ROE):
This widely used ratio indicates the earning power on shareholder investment and is frequently used in comparing two or more companies in an industry. The ratio focuses on the returns available to ordinary shareholders.
Calculation of this ratio is: (net income available to ordinary shareholders/common equity
Market value ratios
Market value ratios provide an indication of how investors feel about the company’s
history and future prospects. They differ from the previous ratios in that they are based primarily on the current market value (share price) of the company being analyzed
Earnings per share (EPS) is the amount of earnings per each outstanding share of a company’s stock The EPS formula does not include preferred dividends for categories outside of continued operations and net income. Earnings per share for continuing operations and net income are more complicated in that any preferred dividends are removed from net income before calculating EPS. This is because preferred stock rights have precedence over common stock[4]Dividend payout ratio is the fraction of net income a firm pays to its stockholders in dividends: The part of the earnings not paid to investors is left for investment to provide for future earnings growth. Investors seeking high current income and limited capital growth prefer companies with high Dividend payout ratio. However investors seeking capital growth may prefer lower payout ratio because capital gains are taxed at a lower rate. High growth firms in early life generally have low or zero payout ratios. As they mature, they tend to return more of the earnings back to investors. Note that dividend payout ratio is the reciprocal of dividend cover, which is calculated as EPS/DPS.[5]Uses and limitations of ratio analysis
The three main users of financial ratios are as follows.
1. Corporate managers, who use ratios to manage, control and improve their company.
2. Credit analysts who use ratios to determine the creditworthiness of a company.
3. Share analysts or investors who use ratio analysis to determine which shares to
recommend or purchase, or what the company’s securities ratings should be.
There are four primary problems in using ratio analysis in corporate finance.
1. Ratios look primarily at past performance and may not be an accurate indicator of future performance. They represent a position at one point in time; conditions could change the next day.
2. Ratios only point to potential problem areas and do not always identify the specific problem.
3. It is not always easy to distinguish between good and bad values for ratios. Also, what is good for one company may be bad for another.
Some are parts:
Financial Statement Analysis of Rahimafrooz Batteries Limited (Part 1)
Financial Statement Analysis of Rahimafrooz Batteries Limited (Part 2)
Financial Statement Analysis of Rahimafrooz Batteries Limited (Part 3)