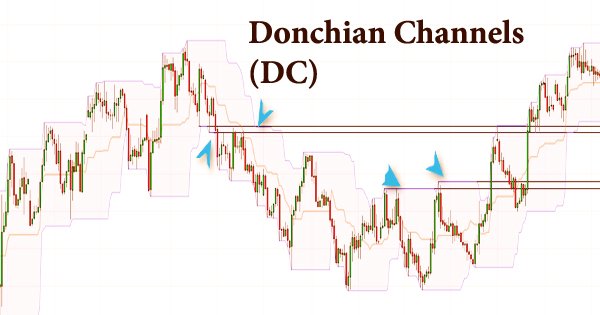
Donchian Channels (DC) are a technical analysis trading technique focused on channels that is used as a trading indicator in financial markets. It’s a banded indicator that looks a lot like Bollinger Bands %B (%B). Other than estimating a market’s instability, Donchian Channels are essentially used to recognize expected breakouts or overbought/oversold conditions when value arrives at either the Upper or Lower Band. Traders mainly use the metric to spot possible breakouts and retracements. A breakout occurs when the price of a security rises above a resistance level (previous high) or falls below a support level (previous low).
The upper band represents a security’s highest price over N periods, while the lower band represents a security’s lowest price over N periods. The Donchian Channel is the region between the upper and lower bands. Then again, a retracement is the point at which the cost of a security begins to move back towards its past cost after a critical change e.g., when a stock falls by 15% and recuperates by 12%. Richard Donchian, a well-known commodity trader, invented the Donchian Channels (DC) predictor. Donchian was dubbed “The Father of Trend Following.”
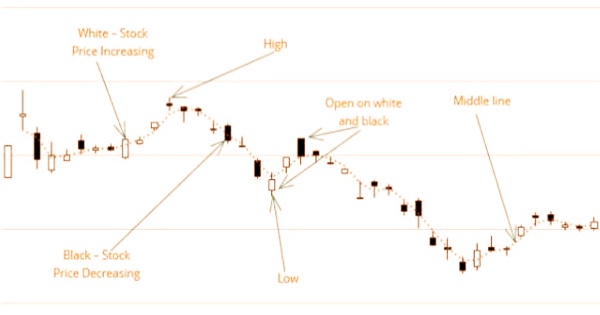
The Donchian Channels were created by Richard Donchian, a prominent American futures and commodities trader. He was a pioneer in controlled futures, founding Futures Inc., the first futures fund, in 1949. Traders use Donchian Channels to consider support and resistance levels, and he also aided the model for mutual funds in the United States. Candlestick charts are used by the Donchian Channel indicator because data is clearly seen and plotted, which aids in decision-making based on signals detected. The Formula for Donchian Channels (DC) is:
UC = Highest High in Last N Periods
Middle Channel = ((UC − LC) / 2)
LC = Lowest Low in Last N periods
where:
UC = Upper channel
N = Number of minutes, hours, days, weeks, months
Period = Minutes, hours, days, weeks, months
LC = Lower channel
The Donchian Channel utilizes three groups in which the upper band shows the most exorbitant cost of the past period, and the lower band shows the least cost of the past period. The centerline shows the normal of the two costs. The indicator simply calculates the Upper and Lower Bands based on a user-defined number of periods (20 Days, for example). The Upper Band represents the period’s highest price. The Lower Band represents the period’s lowest price. The average of the two is the Middle Line. The three groups show the current market force in stock or monetary instruments and empower brokers to take a market position to benefit from a normal ascent or fall in esteem given characteristic signs.
How To Calculate Donchian Channels (DC) –
Channel High:
- Choose time period (N minutes/hours/days/weeks/months).
- Compare the high print for each minute, hour, day, week, or month over that period.
- Choose the highest print.
- Plot the result.
Channel Low:
- Choose time period (N minutes/hours/days/weeks/months).
- Compare the low print for each minute, hour, day, week or month over that period.
- Choose the lowest print.
- Plot the result.
Center Channel:
- Choose time period (N minutes/hours/days/weeks/months).
- Compare high and low prints for each minute, hour, day, week or month over that period.
- Subtract the highest high print from lowest low print and divide by 2.
- Plot the result.
On Donchian Channels (DC), there are two major approaches: one for a possible bullish trend and the other for a possible bearish trend. The middle line is used by traders to distinguish between these two methods. Donchian Channels are primarily used to measure volatility. At the point when instability is high, the groups will extend and when unpredictability is low, the groups become more tight. At the point when value reaches or gets through one of the groups, this demonstrates an overbought or oversold condition. This can essentially result in one of two things.
- To begin with, the current pattern has been verified, and the breakout would result in a major price shift in the same direction.
- The second finding is that the pattern has already been confirmed, and the breakthrough signals the possibility of a minor turnaround before proceeding in the same direction.
Donchian Channels (DC) are a common predictor for predicting market volatility. While there are major price swings, the channels are broader, and when rates are relatively constant, they are narrower. Breakout trading and reversal trading strategies are two effective strategies that are commonly used by traders.
- Breakout Trading Strategy: This is a short to the medium-term procedure where a merchant enters a picked pattern as ahead of schedule as conceivable with the assumption that the security cost will get through the upper or lower band, i.e., a breakout from its present exchanging range through a feasible bullish or bearish pattern, separately.
- Reversal Trading Strategy: A trader using this strategy will wait for a reversal trend from the current trend to occur before entering a long or short position, depending on the reversal trend.
Donchian channels are primarily used to distinguish the breakout of a stock or any exchanged element empowering dealers to take either long or short positions. Dealers can take a long position, if the stock is exchanging higher than the Donchian channels “n” period and book their benefits/short the stock in the event that it is exchanging underneath the DC channels “n” period. Markets follow a number of activity cycles. An arbitrary or widely used N duration value for Donchian Channels cannot accurately represent current market conditions, resulting in false signals that can sabotage trading and investment results.
Information Sources: