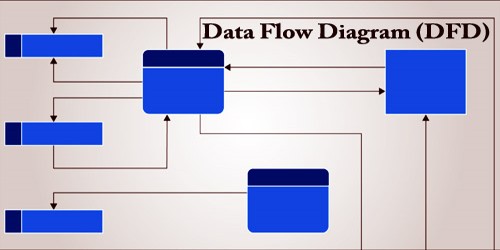
Data Flow Diagram (DFD) graphically representing the functions, or processes, which capture, manipulate, store, and distribute data between a system and its environment and between components of a system. The visual representation makes it a good communication tool between User and System designer.
A Data Flow Diagram (DFD) is a traditional way to visualize the information flows within a system. A neat and clear DFD can depict a good amount of the system requirements graphically. It can be manual, automated, or a combination of both. It shows how information enters and leaves the system, what changes the information, and where information is stored. The purpose of a DFD is to show the scope and boundaries of a system as a whole.
A data-flow diagram has no control flow; there are no decision rules and no loops. Specific operations based on the data can be represented by a flowchart. There are several notations for displaying data-flow diagrams. The notation presented above was described in 1979 by Tom DeMarco as part of Structured Analysis.
The structure of DFD allows starting from a broad overview and expands it to a hierarchy of detailed diagrams. DFD has often been used due to the following reasons:
- Logical information flow of the system
- Determination of physical system construction requirements
- Simplicity of notation
- Establishment of manual and automated systems requirements
There are mainly two types of DFD: Physical Data Flow Diagram, and Logical Data Flow Diagram. There are four basic symbols that are used to represent a data-flow diagram.
Physical data flow diagrams focus on how things happen in an information flow. These diagrams specify the software, hardware, files, and people involved in an information flow. A detailed physical data flow diagram can facilitate the development of the code needed to implement a data system.
Logical data flow diagrams focus on what happens, in particular, information flow: what information is being transmitted, what entities are receiving that info, what general processes occur, etc. The processes described in a logical DFD are business activities a logical DFD doesn’t delve into the technical aspects of a process or system. Non-technical employees should be able to understand these diagrams.
DFD must be consistent with other models of the system ERD, STD, Data Dictionary, and Process Specification models. Each process must have its name, inputs, and outputs. Each flow should have its name. Each Datastore must have input and output flow. Input and output flows do not have to be displayed in one DFD but they must exist in another DFD describing the same system. An exception is a warehouse standing outside the system (external storage) with which the system communicates.
DFD process receives input data and produces output with different content or form. Processes can be as simple as collecting input data and saving in the database, or it can be complex as producing a report containing monthly sales of all retail stores in the northwest region. Every process has a name that identifies the function it performs. The name consists of a verb, followed by a singular noun.
Depending on the methodology (Gane and Sarson vs. Yourdon and Coad), DFD symbols vary slightly. However, the basic ideas remain the same. There are four basic elements of a data flow diagram: processes, data stores, external entities, and data flows.
One of the rules for developing DFD is that all flow must begin with and end at a processing step. This is quite logical because data can’t transform on its own with being process. By using the thumb rule, it is quite easy to identify the illegal data flows and correct them in a DFD. To make the DFD more transparent (i.e. not too many processes), multi-level DFDs can be created. DFDs that are at a higher level are less detailed. The contextual DFD is the highest in the hierarchy.
Information Sources: